Abstract
Concentrating on the case of poly(ethylene glycol) hydrogels, this paper introduces a methodology that enables a natural integration between the development of a so-called mechanistic model and experimental data relating material’s processing to response. In a nutshell, we develop a data-driven modeling component that is able to learn and indirectly infer its own parameters and structure by observing experimental data. Using this method, we investigate the relationship between processing conditions, microstructure and chemistry (cross-link density and polymer-solvent interactions) and response (swelling and elasticity) of non-degradable and degradable PEG hydrogels. We show that the method not only enables the determination of the polymer-solvent interaction parameter, but also it predicts that this parameter, among others, varies with processing conditions and degradation. The proposed methodology therefore offers a new approach that accounts for subtle changes in the hydrogel processing.
Keywords: Hydrogels, calibration, validation, polymer-solvent interaction parameter, degradation rate constant
1. Introduction
PEG hydrogels are promising materials for numerous biomedical applications in drug delivery and tissue engineering [1, 2]. PEG hydrogels imbibe large amounts of water and mimic many aspects of the mechanics of biological tissues [3, 2]. By tuning the crosslink density, a wide range of hydrogel properties can be achieved. Furthermore, degradable linkages are readily incorporated into the crosslinks offering additional control and tunability of the hydrogel properties during degradation [1]. Controlling these properties, however, requires knowledge of the underlying physical and chemical mechanisms, together with an understanding of their connection to processing conditions.
The crosslink density of the polymer network controls two key properties which are important in biomedical applications: the degree to which the hydrogel swells and the resultant mechanical properties. The former depends on the polymer-solvent interaction parameter χ also known as the Flory-Huggins parameter. For a given chemistry and temperature, Flory-Huggins theory predicts a constant value for χ over the entire polymer volume fraction. For solutions of high molecular weight poly(ethylene oxide) hydrogels in water this relationship has been shown experimentally to be valid, resulting in a χ value of 0.426 [4]. However, a number of studies have reported that Flory-Huggins theory is an oversimplification and χ is in fact more complicated, depending on polymer volume fraction [5, 6, 7, 8, 9, 10] and on polymer molecular weight [11]. For PEG in water, this dependence has been shown to be, in part, due to the nature of water association with PEG [12, 13, 14, 15]. Indeed a modified Flory-Huggins theory that included hydrogel bonding between water molecules and PEG has been shown to be able to capture the phase behavior of an experimental PEG-water system [16]. Furthermore, PEG hydrogels are often formed from PEG molecules that are functionalized with a polymerizable group, which alters the overall chemistry. Studies have shown that hydration of PEG molecules differ for methyl and hydroxyl terminated PEG [17]. Therefore, the interaction of PEG and water will depend on a number of factors, most notably, the nature of water association with PEG and the overall chemistry of the functionalized PEG, both of which will likely vary with polymer volume fraction in a crosslinked PEG hydrogel. As a result, it stands to reason that the polymer-solvent interaction parameter for PEG hydrogels in an aqueous solvent will vary with polymer processing conditions, polymer composition and degradation.
To determine the value of χ for different formulations of PEG hydrogels and as a function of degradation, we introduce a so-called self-learning model. This model can indirectly infer its own parameters (e.g., χ) by observing experimental data. By combining Flory’s theory for swollen networks [18, 19] with theories of mixture and poroelasticity, this model can describe the transient gel response [20, 21, 22, 23] arising from the competition between polymer elasticity, that depends on cross-linking density [24, 25], and polymer-solvent interactions. The self-learning framework automatically learns from the experiments in an iterative loop. Each iteration results in an improvement or calibration/estimation of model parameters, in our case χ. The improvement is achieved by determining the relations between model and processing parameters so that material properties (e.g., swelling and modulus) are more accurately predicted over a range of parameters determined by the available experimental data. Once validated, the model may be employed to predict χ, along with a confidence level, and thus can be used to improve the hydrogel design process. Because the model continuously learns from the experimental data, the Efficiency of the model calibration increases in terms of experimental efforts. As a result of the learning process, simple relations between design and model parameters are derived and the resulting model is validated with experimental data.
In this work, we investigate PEG hydrogels formed from a step-growth mechanism between an eight-arm PEG functionalized with norbornene and the crosslinker PEG dithiol. The cross link density was varied by changing the processing conditions through the thiol to ene ratio and the polymer volume fraction in water prior to polymerization. The hydrogel properties, specifically equilibrium swelling ratio and compressive modulus, were measured experimentally. Hydrogels containing an ester linkage were subjected to accelerated hydrolysis in a basic solution and the hydrogel properties assessed. The self-learning model was employed to determine χ as a function of processing conditions and as a function of degradation. The predictive capability of the model was then demonstrated. We begin by first introducing the self-learning model coupled with a mechanistic model of hydrogels. Results of computer simulations follow, where we illustrate how the proposed algorithm learns from experimental data and refines the model accuracy to determine the value of χ for non-degrading and degrading PEG hydrogels under two scenarios: (a) assuming a constant value of χ and (b) allowing χ to vary.
2. Mapping PEG hydrogel processing to properties
PEG hydrogels are formed from a set of well-defined control variables, which include quantities such as percentage of each monomer in an aqueous solvent. Once polymerized, the behavior of the PEG hydrogel is assessed by several properties of interest such as swelling and stiffness. The design goal is to identify the range of control variables that yield the properties of interest for a desired application. In this context, our aim is to enable a statistical model that learns from experimental data and builds a predictive map between control variables and properties of interest. To accomplish this goal, identification of appropriate values of χ for each processing condition is necessary.
2.1. General approach
While we demonstrate the self learning approach to PEG hydrogels, this approach may be more broadly applied to other types of materials. Let us consider a material for which the n control variables are represented by the collection C = (C1, C2, …, Cn) and the m properties of interest are denoted by G = (G1, G2, …, Gm). To map the vector C to G, let us assume that one can introduce a model, that is mechanistically driven; that is, it is based on fundamental understanding of the physical mechanisms driving material behavior at the microscopic level. Due to its underlying physical basis, such a model can therefore be further utilized for design and predictions. Mechanistic models usually take the form of differential equations that do not always admit trivial solutions and exhibit a number of material parameters, which need to be calibrated. Furthermore, in order to provide the processing-properties relationship, two maps may be considered (Fig. 1): (a) a map from material’s processing to microstructure and (b) a map between microstructure and properties [26]. From a mathematical standpoint, it is convenient to charaterize the microstructure by a set of quantities ξi, commonly denoted as internal state variables (ISV). The change of a material’s structure during its lifetime can then be cast in terms of evolution laws of the ISVs [27, 28, 29]. To characterize the relationship between processing and the material structure, we introduce a model of the type
| (1) |
where denotes the value of the ith internal state variable where the superscript 0 denotes the initial swollen hydrogel (i.e., before degradation), and m̄ = (m̄1, …, m̄M1) denotes the collection of the M1 model parameters. The second component of the model maps the microstructure to the material’s properties given by the model
| (2) |
where m̿ = (m̿1, …, m̿M2) denotes the collection of M2 model parameters associated with the structure-property map. Ultimately, the map between material processing and properties takes the form
| (3) |
in which the set of M = M1 + M2 material parameters is m = (m̄, m̿). For situations where the mapping is not explicitly available, the processing-microstructure parameters m̄ may not be inferred directly from the observations of Gi. In such cases, it is more appropriate to include the (components of) vector ξ0 in m̄ for the inference. As we start to describe below, this applies to the application of interest in this study.
Figure 1.
Processing-microstructure and microstructure-properties maps.
2.2. Application to PEG hydrogels
We apply the above framework to PEG hydrogels formed from thiol-ene monomers, which consists of two components: a polymer network (i.e., cross-linked polymer) and water. We examine two properties of interest: the swelling ratio G1 = Q(t) and the Young’s modulus under compression G2 = Ec(t), which in the case of a degradable gel can be a function of time. In this work for a given ‘ene’ and thiol monomer, the initial degree of cross-linking is controlled by the thiol to ‘ene’ ratio C1 = r and the weight percentage of the polymer in solution prior to polymerization C2 = w. For a degrading hydrogel, the degree of cross-linking of the hydrogel will change with time as cross-links are cleaved. One simple way to control degradation is to vary the ratio C3 = η of initial cross-links that are degradable. To simplify our analysis, we consider two extreme cases in which (a) none of the cross-links are degradable, i.e., η = 0 or (b) all of the cross-links are degradable, i.e., η = 1. After processing, the hydrogel microstructure can be described in terms of two internal state variables, namely, the initial cross-link density and the polymer-solvent interaction parameter . For a given set of ‘ene’ and ‘thiol’ monomers, a summary of control variables, properties of interest and state variables is provided in Table 1.
Table 1.
Control variables, internal state variables, and properties of interest in the hydrogel model.
| Control variables (C) | Thiol:ene ratio | r | |
| Weight percent | w | ||
| Ratio of degradable cross-links | η | ||
| Internal state variables (ξ0) | Cross-link density |
|
|
| Polymer-solvent interaction parameter | χ0 | ||
| Macroscopic properties (G) | Compressive Young's modulus | Ec(t) | |
| Swelling ratio | Q(t) | ||
2.2.1. Processing-microstructure mapping
In this work, we limit our investigation to one ‘ene’ monomer, an 8-arm PEG molecule functionalized with norbornene, and one thiol monomer. For a particular combination of a thiol and ‘ene’ monomer, we can directly relate the microstructure to the control parameters through relationships of the form
| (4) |
Note that these are a particular case of equation (1).
2.2.2. Mechanistic model: Microstructure-property mapping
The constitutive relation that describes the link between hydrogel structure and macroscopic properties is based on two competing internal forces governing hydrogel behavior: entropic elasticity and mixing forces.
Chemo-mechanical equilibrium
Following the theory by Flory [18], the free energy per unit volume of mixture is characterized by (a) a mechanical component that describes the increase of stored elastic energy in the polymer due to stretching and (b) a mixing component that characterizes the free energy of mixing of two phases (polymer and solvent)[30]. This yields the following free energy function
| (5) |
with R and T being the ideal gas constant and the absolute temperature, respectively. In expression (5), F is the deformation gradient, J = det(F) is the volumetric equilibrium swelling ratio of the hydrogel, ϕp and ϕw are the volume fractions of polymer and solvent, respectively, while Cw and νw are the nominal concentration and molar volume of solvent. Note that this free energy also involves the internal state variables ρx and χ, which are embedded in J. In addition to the free energy expression, one must also specify the mass conservation in the mixture. Assuming that the polymer and solvent are incompressible constituents (the latter having a specific volume νw), it has been shown that the constraint J = 1 + νwCw must be considered[22]. In other words, the change of total hydrogel volume only occurs if solvent is added to the mixture. To account for this, one can modify the free energy function (5) as follows:
| (6) |
where the Lagrange multiplier π is interpreted as the osmotic pressure in the solvent. Now considering a hydrogel specimen under a homogeneous state of (nominal) stress P̄ and in chemical equilibrium with its surrounding, the equilibrium conditions can be derived by minimizing the above energy functional[31, 32] as follows
| (7) |
| (8) |
Here, P and μw are, respectively, the nominal stress and solvent’s chemical potential within the hydrogel. We used the fact that these quantities are energy conjugate of the deformation gradient and the solvent’s nominal concentration, respectively.
Evolution of internal state variables
In this study, the evolution in gel structure over time is caused by hydrolytic degradation. Specifically, we consider a PEG hydrogel whereby an ester linkage is incorporated into the ends of each cross-link. With this functionality, hydrogels with the same initial cross-link density can display different degradation kinetics by varying the pH of the aqueous solution (i.e., via base-catalyzed hydrolysis of the ester) [33, 34]. From a modeling perspective, degradation is thus written in terms of a first order differential equation [35] that depends on several factors, most notably the chemistry of the degradable linkage and the solvent. The evolution of cross-link density ρx is thus given by
| (9) |
where k′ is the pseudo first order rate constant for hydrolytic degradation. We note that k′ is not the true kinetic constant of the ester bond, it rather encompasses water concentration and the hydroxyl ions (or hydronium depending on the solvent) that catalyze the reaction. When k′ is constant, this equation admits a trivial solution of the form . However, in this study, we will show that this coefficient in fact varies during the degradation process, such that k′ = k′ (ρx) in the general case.
2.2.3. Summary and model parameters
As a summary, the full model that maps hydrogel processing to behavior is only partially known. As shown in Table 2, the processing-microstructure is mostly unknown as (a) it is difficult to measure the polymer-solvent interaction parameter experimentally and (b) it is not possible to directly measure cross link density. The structure of the microstructure-properties model is well-posed through the free energy functional (6) and cross-link degradation kinetics (9). In this work, we therefore aim to build a methodology that allows us to (a) infer unknown model structure (i.e., crosslink density and χ) by analyzing experimental data and (b) determine unknown model parameters (i.e., degradation parameter k′ (ρx)). This will be done by integrating experimental data with modeling, and by solving an inverse problem as described next.
Table 2.
Summary of model structure and parameters for degradable PEG hydrogels
2.3. Integration of experimental data and modeling
In this study, we perform a set of macroscopic experimental measurements, denoted by the vector g and discuss how these can be compared with model predictions. For non-degradable gels, g may represent the swelling ratio (g1 = Q) and elastic moduli (g2 = Ec) measured for various processing conditions. Note that in the following, we use a lowercase symbol g for the measured properties of interest; this is in contrast with the uppercase symbol G used for model predictions.
2.3.1. Measurements and uncertainty
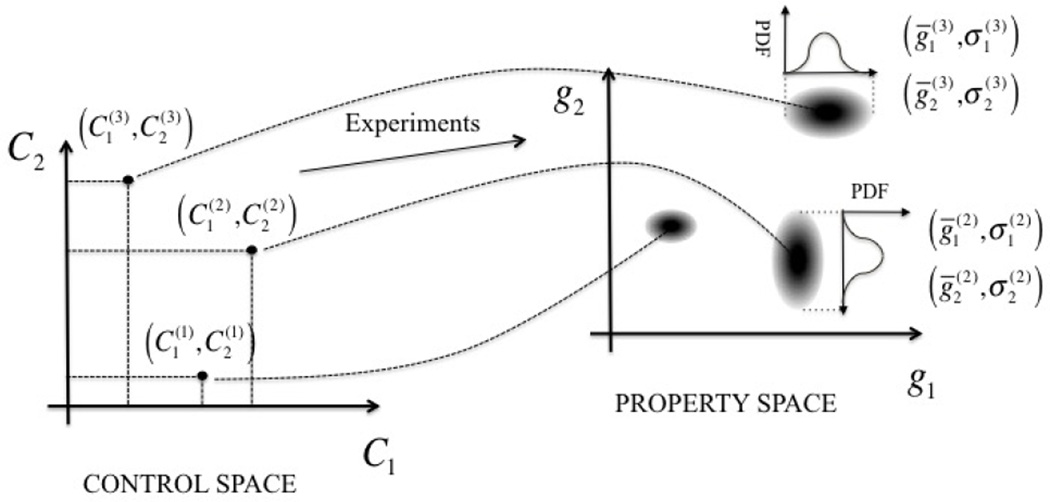
To simplify the approach, we assume that there is neither uncertainty nor noise in the measurements of the control parameters Ci, although there may be uncertainties in the measurement of the properties of interest gi (Fig. 2). Quantification of this uncertainty is achieved as follows. For a fixed set of control parameters characterized by the superscript (k), k = 1, …, K, we repeat the experiments (and thus the macroscopic measurements) R times. Measured quantities of interest are collected in a vector , where kr represents the measurement from the rth repetition. This set of data may then be used to build a probability density function (PDF) for the property of interest . We assume that each of the measured properties follows a Gaussian distribution whose mean and standard deviation can be estimated, respectively, from the mean and standard deviation of data,
| (10) |
Although model accuracy increases with the number of repetitions R, this number usually remains small because of the cost associated with each experiment. The common practice is then to factor in prior knowledge or expert opinion for an appropriate selection of and . In the present study, we used R = 3 but verified that the resulting estimates are compatible with previous observations.
Figure 2.
Experimental tests provide sample points of the map between the control space C and the property space g. Uncertainties in control variables propagate to the property space; this aspect can be quantified by measuring the probability density function (PDF) in both domains through the realization of several experiments under similar design conditions.
2.3.2. Measuring and predicting the properties of interest of a PEG hydrogel
The mechanical response of PEG hydrogels was characterized experimentally by two macroscopic measurements: the equilibrium volumetric swelling ratio and the Young’s modulus.
Equilibrium Swelling Ratio (Q)
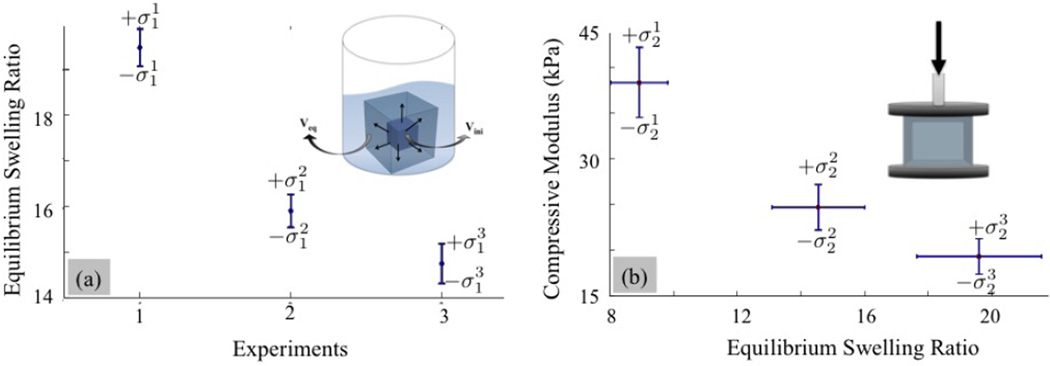
The experimentally determined mean values of Q along with the standard deviation for three different experiments are presented in Fig. 3. To simulate the above experimental procedure, we assume that swelling is isotropic, homogeneous and occurs in stress-free conditions, i.e., P̄ = 0 in (7)[36]. In this case, the deformation gradient of the polymer network after swelling is F = diag(λ, λ, λ) (with λ the linear stretch ratio in each direction axis) and the equilibrium swelling ratio becomes Q = λ3. This leads to the following simplified version of (7) and (8), respectively,
| (11) |
| (12) |
where we used the relation ϕw = (J − 1)/J. This coupled system of nonlinear equations can be solved to determine gel swelling Q through the stretch ratio λ and the osmotic pressure π for any given value of the cross-link density and the polymer-solvent interaction parameter.
Figure 3.
Confidence intervals for (a) the swelling ratio and (b) the compressive modulus of three hydrogel designs. For each design, the properties of interest were measured three times, independently. The data set for each independent experiment can be represented as an interval by using the mean and standard deviation values.
Young’s modulus under compression
Hydrogels typically display a non-linear stress-strain relation when loaded in compression. However, to experimentally characterize their effective stiffness, we often measure a so-called secant modulus [37], which represents the average stiffness as the deformation reaches a given value chosen to be 15% in this study (see experimental section). The specimen usually remains cylindrical during the test so that one can assume a homogeneous deformation state measured from the gel’s swollen state as F = diag(λ1, λ2, λ2). Here, λ1 and λ2 are the stretch ratios in the axis of the cylinder and in the lateral directions, respectively. Similarly, as the specimen is unconstrained on its side during compression, the nominal stress field is given by P̄ = diag(f/A0, 0, 0), where f is the compressive force and A0 is the surface area of the specimen in its undeformed, swollen state.
Due to the relatively fast rate of loading, compared to the characteristic time to reach equilibrium swelling (few hours), it is acceptable to assume that the solvent/polymer mixture remains incompressible during the procedure. In other words, measured from the swollen state, the Jacobian of the deformation J remains equal to 1. This means that no changes of osmotic pressure π occurs as the specimen is loaded. However, the relationship between nominal stress and deformation can be determined from (7) together with the above assumption on F. This yields,
| (13) |
in which we used the fact that . Note that the stretch ratios are written for a swollen polymer network and Gs = ρxRTQ−1/3 is the shear modulus. The secant Young’s modulus at a 15% compression strain can then be computed as
| (14) |
Degradation kinetics
In this work, we monitor degradation by measuring the swelling ratio and the compressive modulus of a degradable (η = 1) hydrogel specimen in time. We assume that the degradation process is slow compared to the characteristic time of solvent diffusion in the gel, thus allowing us to use the equilibrium equations in the prediction step.
3. Mechanistic model calibration
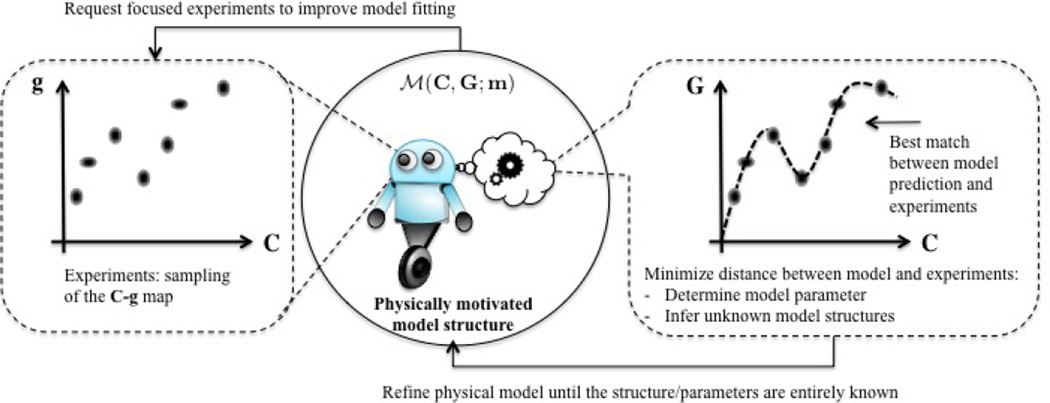
The mechanistic model described above is critical to understand and eventually predict the behavior of hydrogels in many applications. Their reliability and accuracy however depend on parameters, such as and χ that are often not known a priori and evolve in time. To enhance the model’s predictive accuracy, it is therefore essential to determine these parameters from, possibly sparse, measurements of the system responses (Fig. 4). Such a process, referred to as model calibration, may be naturally cast in the form of an inverse problem in which parameters of the mechanistic model are inferred, such that model predictions are as close as possible to the measurements. In doing so, however, several difficulties shall be accounted for. In particular, experimental measurements are often noisy as shown in measurements and uncertainty section, the mechanics model may be computationally expensive to simulate for a given realization of parameters, and the inversion process may be ill-posed in the sense that multiple values of model parameters may result in (approximately) the same measurements.
Figure 4.
Framework for model calibration from experiments. We consider the model as an active entity, represented by a robot that can observe the relationship between input and output obtained from experiments and adjust its free parameters to best fit the data. If it fails at doing so, the model may request a modification of its own structure, represented by differential equations.
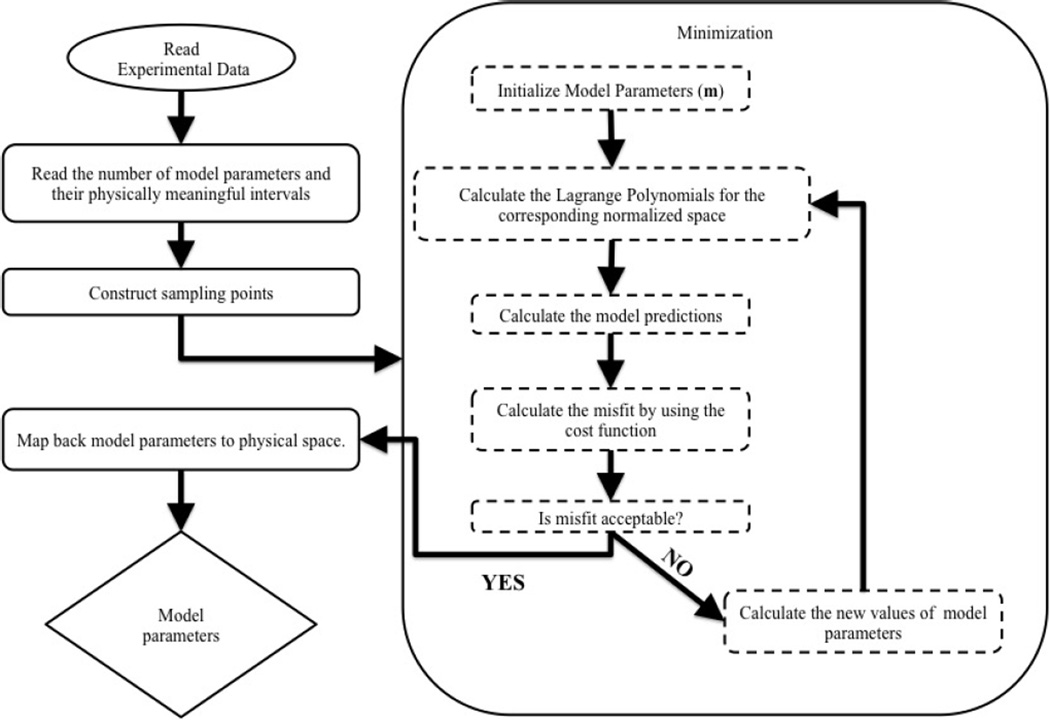
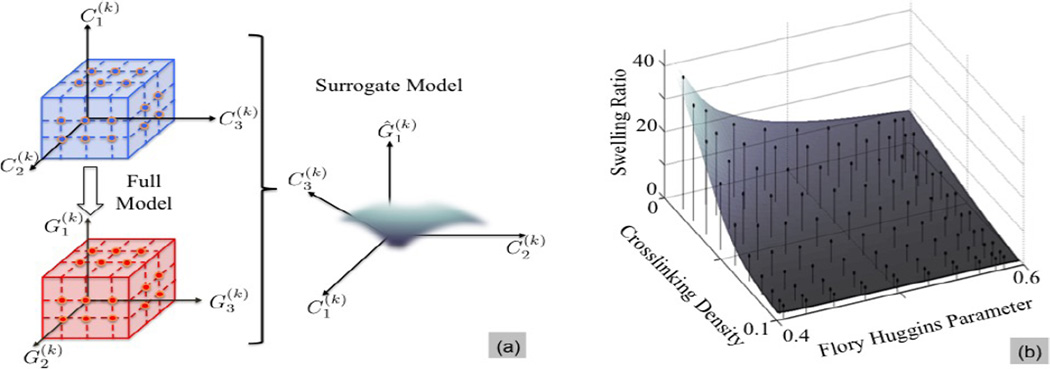
We propose here to estimate the unknown parameters by minimizing a cost function measuring the deviation of model predictions from experimental data. To accelerate this minimization, we construct a surrogate to the map between model parameters and predictions. This map is generated a priori by exploring discrete realizations in the parameter space and predicting, using the mechanistic model, their corresponding output (or properties of interest). We then use interpolation functions between these points to cheaply construct the full parameter-prediction map. Once the model parameters are estimated by learning from experiments, the model is then validated against independent experiments. If not invalidated, the calibrated mechanistic model may finally be utilized for purposes such as prediction of properties of interest, sensitivity analysis, and design of new experiments. This process is also summarized in Fig. 5.
Figure 5.
Flowchart of the utilized model calibration algorithm.
3.1. Inverse problem for mechanistic model calibration
In an inverse problem, model parameters m = (m1, …, mM) are estimated by minimizing the misfit between model outputs and experimental data . Here, i = 1, …, I and k = 1, …, K are indices representing quantities of interest and replications of the experiments, respectively. This misfit is quantified by a cost function, here of a least-squares type assuming a normally distributed measurement error,
| (15) |
where was defined in (10). Note that the summation in (15) is for all properties of interest and for every independent experiment. The only unknowns in the cost function are the model parameters m. When m is sufficiently low-dimensional, the minimization may be performed using standard optimization techniques; here we resort to a Newton-Raphson implementation in MATLAB. The result of this inversion are point estimates (i.e., deterministic values) of m. To account for possible variability of parameter estimates, due to, for instance, uncertainty in the measured data, more advanced methods such as Bayesian inference [38] may be employed. After the estimation of model parameters, the experimental data and model outputs are compared in order to determine if there is a need for modification in the definition of the parameters or, possibly, the structure of the mechanistic model. In other words, we consider the model as an active entity, represented by the robot in Fig. 4, that can observe the relationship between input and output obtained from experiments and adjust its free parameters to best fit the data. If it fails to do so, the model may request a change in its own structure, represented by differential equations.
3.2. Acceleration via surrogate modeling
Finding a global minimum of (15) requires evaluation of , or equivalently solving the model problem of microstructure-property mapping for a potentially large number of m. When the mapping between m and is sufficiently smooth, as in the case of hydrogels considered here, a surrogate to may be employed to reduce the optimization cost. Surrogate modeling refers to the construction of an approximate (but cheap to evaluate) representation of the mapping between a model’s input parameters and the response of interest[39, 40]. Such a model is constructed once based on full model simulations and is used to rapidly generate realizations of the solutions of interest. In particular, here we construct surrogates of Lagrange interpolation type for the mapping between m and , separately for each i. Specifically,
| (16) |
where the nodes , jk = 1, …, Jk and k = 1, …, M, are selected values of m as described below. Additionally,
| (17) |
are the multi- and uni-variate Lagrange polynomials corresponding to nodes m(j) and , respectively. While several choices of nodes may be considered, here we choose them according to the Gauss- Legendre rule that is known to result in more stable interpolations[41]. The numbers Jk of nodes along parameters mk control the accuracy of the surrogate . For smooth , increasing Jk results in more accurate surrogates. However, this will require a larger number of parameter values m(j) at which the model has to be simulated. In the present study, we start with a regular subdivision of the parameter space (constant increments in Jk values), and refine these subdivisions gradually so that is within some desirable distance of at a small number of random realizations of m.
4. Predictive modeling of PEG hydrogel to determine χ
In this section, we demonstrate how the presented model calibration approach can be used to determine χ for different PEG hydrogels and then used to predict χ for different processing conditions. The model can later be used to build a general model expressed in (1). To determine χ, we concentrate on the microstructure-property component of the model whose details are found in the mechanistic model. The unknown quantities are therefore (a) the model parameters m̿ = (k′(ρx)) and (b) the internal state variables . In other words, the internal state variables are treated as model parameters and, referring to the previous section, the vector of model parameters, for a degradable PEG hydrogel becomes . The key objectives of this section are three-fold. First, we use the model calibration approach to predict the microstructure (or internal state variables) of PEG hydrogel fabricated under different conditions. We then relate processing conditions to microstructure to qualitatively understand the processing-microstructure relationship (Fig. 1). Second, we shift our focus to degradable hydrogels and use the model calibration approach to (a) quantify model parameters and (b) characterize the evolution of χ and crosslink density during degradation.
We note that for the following to remain within the physical range of parameter values, we restricted the optimization of ℛ(m) in (15) to the values ρx ∈ [0, 100] mM [42], χ ∈ [0.4, 0.6] [4] and k′ ∈ [0, 0.3] (hr−1) [43] based on literature values for PEG in water. The value for χ, however, is expected to be higher because star polymers have been shown to have a χ value higher than their corresponding linear polymer [44, 45]. In addition, the presence of hydrophobic norbornene moieties on the end of the PEG arms will reduce the overall hydrophilicity of the polymer. We note that for fixed choices of process variables C, as described previously, the experimentally observed values g may be variable from one experiment to another. This variation can arise from slight variations in, for example, the monomer concentration in the final formulation. Such a variability here is accounted for by tuning the values of in (15) directly from the experimental data associated with the same realizations of the process parameters C.
4.1. Elucidating trends between control parameters and microstructure for PEG hydrogels
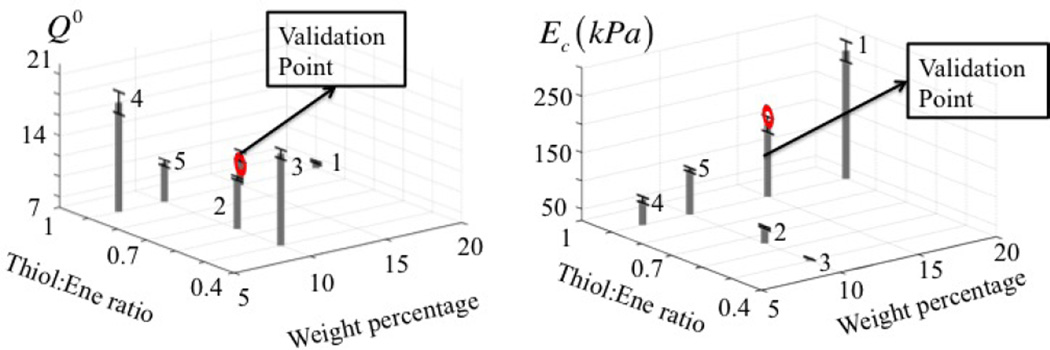
For a PEG hydrogel, the control variables consist of thiol to norbornene ratio r and weight percent of the 8-arm PEG norbornene (w), the properties of interest are the equilibrium swelling ratio and compressive modulus measurements and the model parameters reduce to . In this section, we investigate PEG hydrogels in their initial equilibrium swollen state, but prior to degradation. Five independent experiments were performed to investigate the control parameter space, each of which was repeated three times to quantify the uncertainties in the measurement of properties of interest. The results are reported in Fig. 7. We explore two cases to determine the parameter m. First under the assumption that the polymer-solvent interaction parameter is unknown but independent of processing conditions and second, under the assumption that this parameter varies with processing conditions.
Figure 7.
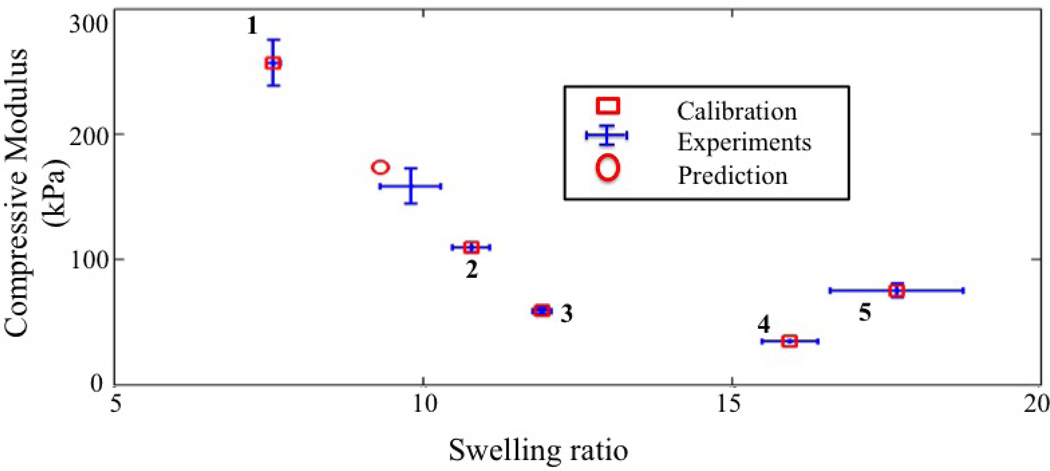
Graphical representation of experimental results. A total of five PEG hydrogel designs was processed, for which both the equilibrium swelling ratio and Young’s modulus (compression) were determined. For each design, the tests were repeated three times in order to quantify uncertainties in measured quantities of interest (depicted by error bars). Apart from these another PEG hydrogel design is processed to validate the calibration.
Case of an independent polymer-solvent interaction parameter
While the control of cross-link density through processing conditions is, at least qualitatively understood, most studies [46, 4, 47, 48] assume that the polymer-solvent interaction parameter remains independent of formulation, for a PEG hydrogel. Using this assumption as our first hypothesis, for five experiments, we therefore look for six parameters, , k = 1, …, 5, and χ0. In other words, the vector m becomes . The cost function (15) therefore becomes
| (18) |
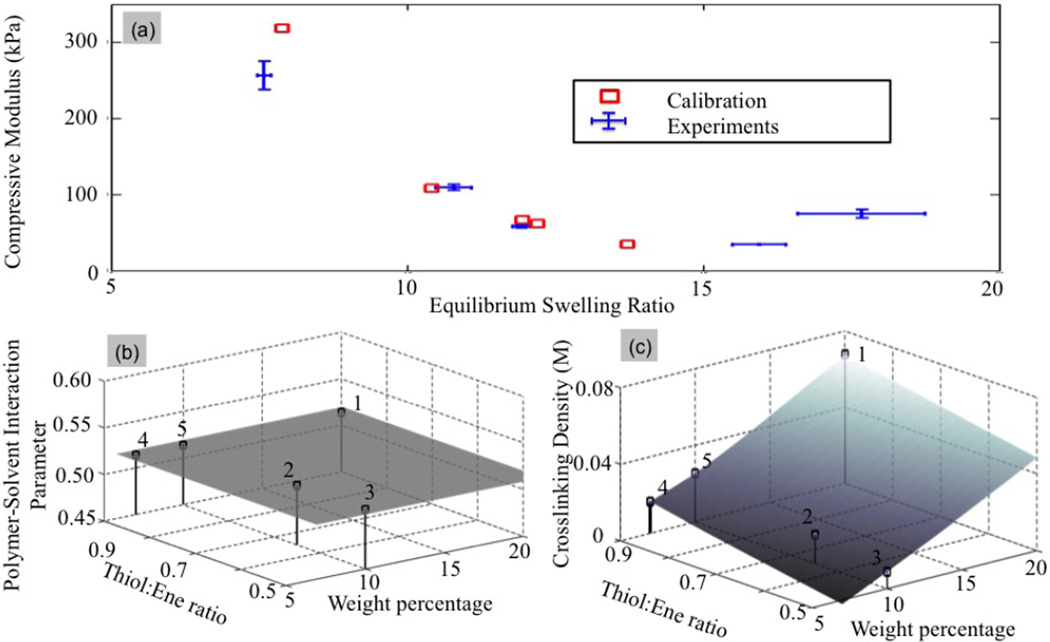
where and q0(k) denote the measured compressive modulus and equilibrium swelling ratio for each experiment. The corresponding standard deviation and are computed from the error bars shown in Fig. 7. Finally, the model values and Q0(k) (m) are obtained from the surrogate model (See Fig. 6). Upon minimization of ℛ, a map between processing conditions and microstructure could be established (Fig. 8), showing a monotonic increase of initial cross-link density with weight percentage and Thiol:ene ratio. However, it is clear that the assumption of an independent polymer solvent interaction parameter results in a poor match between experimental and modeling results (Fig. 8a), especially for extreme behaviors, i.e. either low cross-linked gels (large swelling ratio) or highly cross-linked gels (low swelling ratio). This observation implies that the polymer-solvent interaction parameter should in fact be dependent on the gel processing.
Figure 6.
(a) A surrogate model is an approximation which is constructed by using a set of realizations of model parameters (defined over an appropriate range) and the corresponding solutions of interest. (b) Surrogate model for swelling ratio of the initial PEG hydrogel properties based on equation (6).
Figure 8.
Minimization of the cost function (18) for an independent polymer-solvent interaction parameters: (a) Distance between experimental and model predictions in the (Q0 − Ec) space, (b) Value of the polymer-solvent interaction parameters as a function of control parameters, and (c) Initial cross-link density in terms of control parameters.
Case of a dependent polymer-solvent interaction parameter
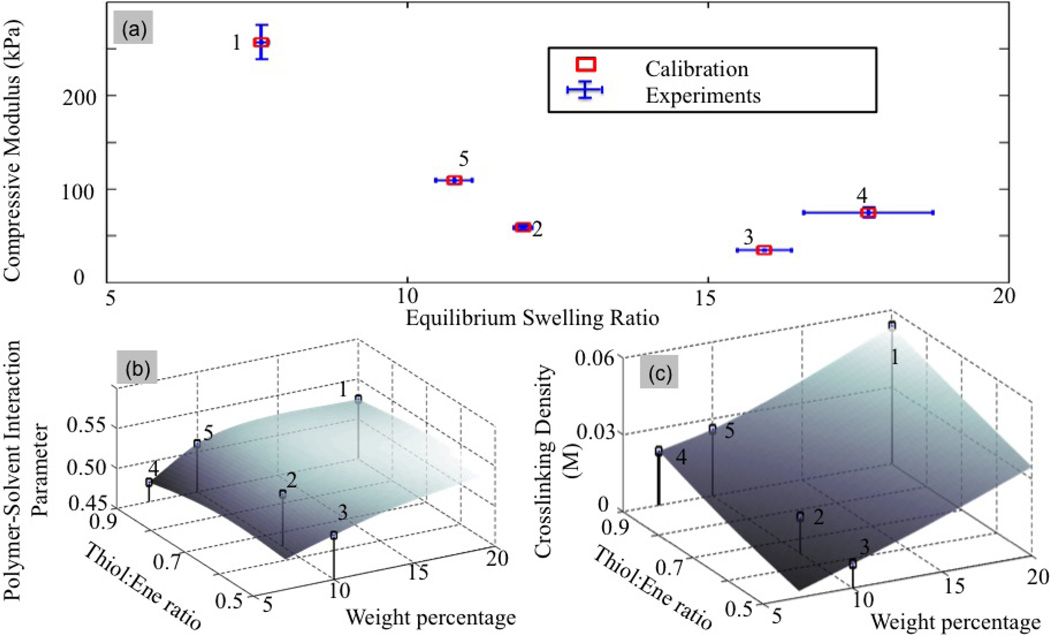
Based on the above observations, we now let the parameter χ0 vary in the physic al range [0.4, 0.6] for each independent experiment. The new cost function therefore takes the same form in (18), with the difference that χ0 is now allowed to vary between independent experiments, that is, the parameter vector m takes the form . Fig. 9 shows an improved fit between experimental points and model findings. This result suggests that the polymer-solvent interaction parameter is dependent of the control parameters as depicted in Fig. 9(b). Interestingly, the model is highly sensitive to this parameter as slight variations in χ0 lead to fairly large differences in swelling ratio and Young’s modulus. Furthermore, the model can describe χ0 for a given set of monomers, as a function of weight percentage of the ‘ene’ monomer and Tiol:Ene ratio. In particular, the model predicts that for a given Thiol:Ene ratio, an increase in weight percentage of the ‘ene’ monomer, and thus in polymer volume fraction, leads to higher χ0 values.
Figure 9.
Minimization of the cost function (18) for a dependent polymer-solvent interaction parameter: (a) Distance between experimental and model predictions in the (Q0 − Ec) space, (b) Values of the polymer-solvent interaction parameter as a function of control parameters and (c) Initial cross-link density in terms of control parameters.
The dependence of χ0 on the polymer volume fraction is consistent with reports in the literature for other polymer and solvent combinations [5, 7, 49]. However, when the Thiol:Ene ratio is varied for a given wt% of ‘ene’ monomer, the effects of the processing parameters on χ0 is more complicated. For example, point 2 (referring to the processing parameters of 10wt% of the ‘ene’ monomer and a Thiol:Ene ratio of 0.65) and point 5 (referring to the processing parameters of 10wt% of the ‘ene’ monomer and a Thiol:Ene ratio of 0.9), the χ0 values are distinctly different at 0.516 and 0.510, respectively. This is counterintuitive as the latter has a higher polymer volume fraction, arising from the higher Thiol:Ene ratio, yet the value of χ0 is lower. However, variations in the Thiol:Ene ratio for a given wt% of the ‘ene’ monomer will lead to changes in the chemistry of the polymer. For example the Thiol:Ene ratio will influence the number of unreacted arms endcapped with norbornene moieties and the number of reacted enes with norbornane flanked with PEG chains on both sides. In addition, the presence of dangling chain ends has been proposed to lead to higher χ0 value owing to the fact that they effectively occupy additional space in the hydrogel [49]. While the exact relationship between the chemistry and molecular structure on χ0 for these types of PEG hydrogels has not been studied in detail, it would not be surprising that small changes to the chemistry and/or structure could have a significant influence on χ0.
4.2. Model Validation
We now discuss the calibration results and the validity of the resulting model. For this, we chose a random point in the control space, corresponding to a Thiol:Ene ratio and Weight percentage of the ene monomer of 0.9 and 15, respectively (Fig. 7). These values were then located in the maps of Fig. 9(b) and 9(c) in order to determine a corresponding cross-link density of ρx = 0.035 M and polymer-solvent interaction parameter of χ = 0.516. We then used these values in equations (11),(12) and (14) to determine the equilibrium swelling ratio and Young’s modulus of the processed gel (Q = 9.32 and Ec = 172.5 kPa). To verify whether this predicted value was corroborated with experimental data, this gel was processed and tested experimentally. The comparison between prediction and experiment are depicted in Fig. 10. We find that, even with only five calibration points, the model prediction manages to be within ranges of the experimental measurements. We note, however, that the experimental data limits the development of a robust relationship for an extended parameter space.
Figure 10.
Model validation. For a given hydrogel formulation (validation point in Fig.7), the map shown in Fig 9 was used to determine the cross-link density and polymer-solvent interaction parameters that lead to the compressive modulus and swelling ratio shown here for the validation point. Experiments for this gel formulation were also performed and compared with the prediction. We show here both calibration and validation points in the Ec-Q0 space.
4.3. Quantifying the polymer-solvent interaction parameter during hydrolytic degradation of PEG hydrogels
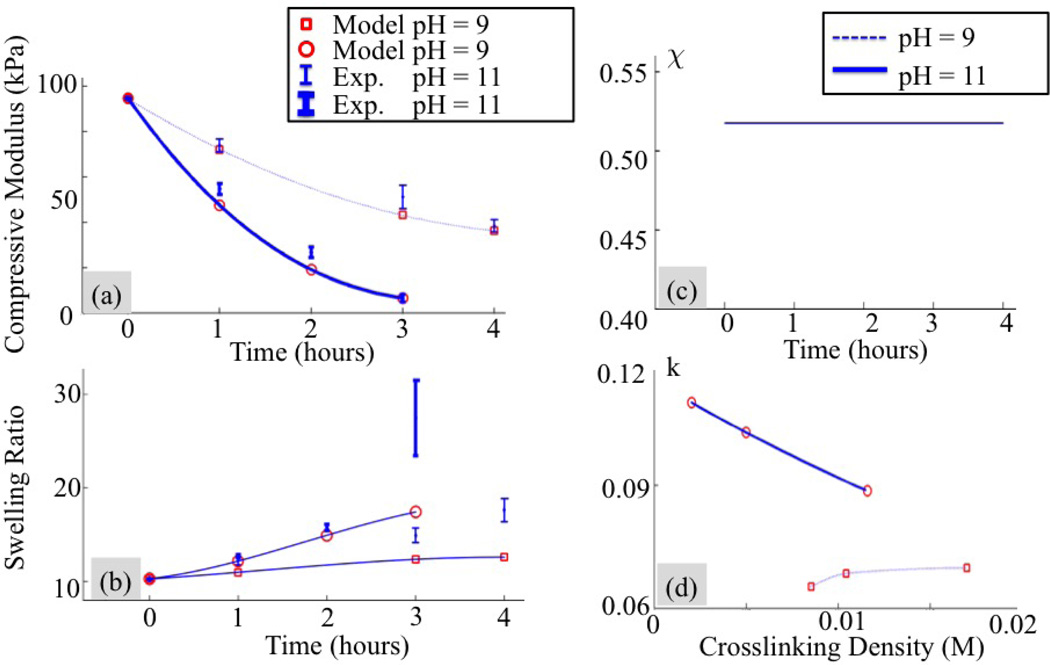
We extend our analysis to PEG hydrogels that are degrading (η = 1). We specifically seek to determine the relationship between the kinetic constant k′ and the cross-link density (see Eq. (9)) and understand whether the polymer-solvent interaction parameter for a given set of processing conditions changes during degradation. For this, we experimentally investigated hydrogel degradation by measuring changes in swelling ratio and compressive modulus in time. The tests were performed at the initial time and repeated three times at intervals of one hour (t = t1, t2, t3 and t4 in our analysis). Two degradation kinetics were considered at a pH of 9 and 11. Data are shown in Fig. 11. Once again, our study is divided into two parts, each based on the assumption that the parameter χ is (a) constant and (b) changes with degradation.
Figure 11.
Experimental measurements and optimized model fitting assuming a constant value of the polymer-solvent interaction parameter during degradation. Evolution of (a) the compressive modulus and (b) the swelling ratio of a hydrogel immersed in aqueous solutions at pH of 9 and 11. (c) Predicted polymer-solvent interaction parameter and (d) change in kinetic coefficient with respect to the crosslinking density during degradation.
Case of a non-evolving polymer-solvent interactions parameter
In this case, the parameter χ is unknown but assumed to be independent of cross-link density. The parameter vector is therefore where the index k = 1, …, 4 denotes the discrete measurement times and the index p = 1, 2 spans the two degradation kinetics. The cost function becomes
| (19) |
where and q(p)(tk), are respectively, experimental observations of and Q(p)(tk). Minimization of this function leads to the model prediction represented by circle and squares in Fig. 11(a) and (b). The best match between experiments and modeling was found for a polymer-solvent interaction parameter of 0.52 (Fig. 11(c)) and relation between k′ and ρx shown in 11(d)). We observe that for the faster degradation rate (pH = 11), the kinetic constant decreases linearly with cross-link density while this is not the case when pH = 9. We also note that a poor match is observed for longer degradation times, either for compressive modulus or swelling ratio, depending on the experiment. This seems to imply that once again, our assumption of a non-evolving polymer-solvent interaction parameter does not capture the hydrogel physics.
Case of an evolving polymer-solvent interaction parameter
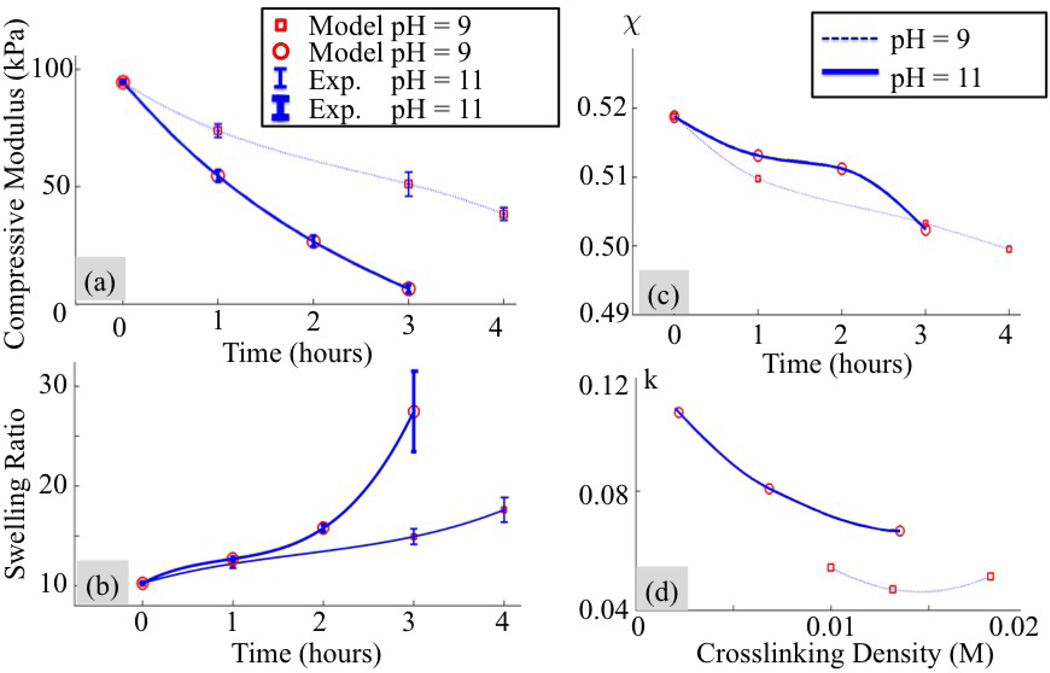
To examine a changing χ during degradation, we let its magnitude vary in time between experiments in the physical range [0.4, 0.6]. The new cost function is now augmented by a different value of χ for all experiments and all testing times. This leads to , the index being unchanged from the above analysis. Besides the change in the definition of m, the cost function remains the same as given in (19). We see in Fig. 12(a),(b) that minimization of this function leads to a near perfect match between experimental results and predictions. It was found that the polymer-solvent interaction parameter and degradation kinetic constant both depend on the control parameters and the evolving hydrogel structure (crosslink depletion) during degradation in a nonlinear fashion (as shown in Figs. 12(c) and (d)). We also show that the degradation constant is still a decreasing function of the cross-link density for pH = 11 and remains rather constant for pH = 9 (Fig. 12(d)).
Figure 12.
Experimental measurements and optimized model fitting for a variable Flory-Huggins parameter during degradation. Evolution of (a) the compressive modulus and (b) the swelling ratio of a hydrogel immersed in aqueous solutions at pH of 9 and 11. (c) predicted change in polymer-solvent interaction parameter and (d) kinetic constant with respect to the crosslinking density during degradation.
5. Summary and concluding remarks
To summarize, we have derived a self-learning simulation approach that integrates a mechanistic material’s model to experimental data with the goal of fitting its unknown parameters and refining its structure. This approach provides a unique way to evaluate the value of material’s parameters and internal state variables that are usually challenging to measure experimentally. We applied this methodology in order to better understand the complex behavior of PEG hydrogels and its relation to processing conditions. Based on the well-known Flory’s theory [18], our objective was to shine a light on the relationship between cross-link density, polymer-solvent interaction parameter and degradation with processing conditions. It was found that the polymer-solvent interaction parameter and degradation kinetic constant both depend on the control parameters and the evolving hydrogel structure during degradation in a nonlinear fashion. Our findings for PEG hydrogels support a growing body of literature describing that the polymer-solvent interaction parameter is indeed more complicated and varies with a number of polymer factors such as polymer volume fraction and subtle changes in the polymer chemistry. For instance, the polymer structure and even temperature [50] may affect the affnity of hydrogen bonds between water molecules and polymer chains [51]. Such effects have not been investigated in the present study due to the lack of available data. A better understanding of these is left for the future studies however, in which new experiments can be designed to investigate each factor explicitly.
We extended our analysis to degrading PEG hydrogels and showed that χ also varies during degradation as the structure of the hydrogel evolves over time. While others have shown that the degradation kinetic constant for hydrolysis of PEG hydrogels varies with initial cross-link density[35, 52], we demonstrate that this kinetic constant dynamically changes during degradation as a result of the evolving hydrogel structure. The self-learning simulation approach offers a method to predict the values of χ and k′ for a given set of monomers without requiring an in-depth knowledge of the relationship between these two parameters and the hydrogel, which would otherwise be difficult to achieve experimentally. For example variations in the polymer volume fraction encompass subtle changes in chemistry, making it difficult if not impossible to isolate. Overall, this self-learning simulation approach will improve our ability to design hydrogels by better predicting the processing conditions required to achieve a set of targeted material properties.
One final note, we acknowledge that our approach is based on a small amount of experimental data, but we have shown that even in this situation, the approach can do reasonably well at predicting the hydrogel behavior from its processing conditions. In the future, however, the self-learning methodology will allow the model to increase its accuracy and predicting power through a fast processing of a larger number of experimental data that can be added over time. More complex materials (composites, tissue scaffolds) could also be investigated by combining this approach to full 3-dimensional finite element analysis. Efficiency will also be improved by integrating Bayesian methods [38] into the statistical description of the problem.
5.0.1. Experimental Section
Materials
The ene macromolecular monomer, 8-arm PEG norbornene was synthesizd from 8-arm PEG hexaglycerol (JenKem Technology) with a molecular weight of 10,000 g/mol following previously published protocols[53]. 1H NMR was used to confirm that approximately 92% of the arms were functionalized with norbornene following previously published methods[42]. The thiol macromolecular monomer, PEG dithiol with a molecular weight of 1000 g/mol, was purchased (Sigma-Aldrich) and used as received. Hydrogels were formed by mixing the ‘ene’ and thiol monomers with 0.05% (g/g) photoinitiator (Irgacure 2959, BASF) in water and exposing to 365 nm light at 5 mW/cm2 for 7 minutes. The Thiol:Ene ratio was varied from 0.5 to 0.9 and the weight percent of the ‘ene’ monomer was varied from 7 – 20% (g/g). Cylindrical specimens (5mm height and 5mm radius) are prepared for testing.
Hydrogel Degradation
Hydrogels showed no signs of degradation in water (up to one week). Hydrogels that were pre-swollen in water were placed in a large bath of either 1 M or 2 M sodium hydroxide for up to four hours. The pH of each solution was determined to be 9 and 11 using an electronic pH meter. After each hour, hydrogels were removed from solution, rinsed multiple times in water for 15–30 minutes prior to measuring swollen mass, the dry polymer mass and the compressive modulus.
Methods of Measurements
Hydrogels were allowed to swell to equilibrium in water over night at room temperature to measure the initial hydrogel properties. For degrading hydrogels, the hydrogels at varying time points were placed in water prior to measuring the properties. For each hydrogel, the swollen hydrogel was weighed to determine the equilibrium swollen mass Ms. The hydrogel was lyophilized to remove the water and re-weighed to determine the dry polymer mass Md. The volumetric equilibrium swelling ratio Q was computed as[54]
| (20) |
where the densities were assumed to be 1.07 g/cm3 and 1 g/cm3 for the polymer (ρpeg) and solvent (ρsol), respectively. A sample size of 3 was used. The data are reported as average with standard deviation as error bars.
The modulus was determined on swollen hydrogels by testing the cylindrical specimen under unconfined compression up to 15% strain at a rate of 0.5 mm/min (MTS Synergie 100, 10 N). A sample size of 3 was used. The data are reported as average with standard deviation as error bars.
A self-learning framework is developed to assess the χ parameter in PEG hydrogels.
The framework provides an indirect way to measure χ parameter.
Stiffness and swelling are very sensitive to χ parameter.
The effect of processing conditions and degradation on χ parameter is measured
The approach provides better understanding of the molecular physics of hydrogels.
Acknowledgement
FJV gratefully acknowledges the support of the National Science Foundation under the CAREER award 1350090. FJV and SJB acknowledge that research reported in this publication was supported by the National Institute of Arthritis and Musculoskeletal and Skin Diseases of the National Institutes of Health under Award Number 1R01AR065441. The content is solely the responsibility of the authors and does not necessarily represent the official views of the National Institutes of Health. AD’s contribution is supported by the U.S. Department of Energy Office of Science, Office of Advanced Scientific Computing Research, under Award Number DE-SC0006402. SC was supported by a National Institutes of Health Pharmaceutical Biotechnology Training Grant. SCS was supported by a National Science Foundation Graduate Research Fellowship.
Footnotes
Publisher's Disclaimer: This is a PDF file of an unedited manuscript that has been accepted for publication. As a service to our customers we are providing this early version of the manuscript. The manuscript will undergo copyediting, typesetting, and review of the resulting proof before it is published in its final citable form. Please note that during the production process errors may be discovered which could affect the content, and all legal disclaimers that apply to the journal pertain.
References
- 1.Bryant SJ, Anseth K. Hydrogel properties influence ecm production by chondrocytes photoencapsulated in poly(ethylene glycol) hydrogels. Journal of Biomedical Materials Research Part A. 2002;59:63–72. doi: 10.1002/jbm.1217. [DOI] [PubMed] [Google Scholar]
- 2.Nicodemus G, Bryant S. Cell encapsulation in biodegradable hydrogels for tissue engineering applications. Tissue Eng Part B Rev. 2008 Jun;14:149–165. doi: 10.1089/ten.teb.2007.0332. [DOI] [PMC free article] [PubMed] [Google Scholar]
- 3.Anseth KS, Bowman N, Peppas L. Mechanical properties of hydrogels and their experimental determination. Biomaterials. 1996;17:1647–1657. doi: 10.1016/0142-9612(96)87644-7. [DOI] [PubMed] [Google Scholar]
- 4.Merrill EW, Dennison KA, Sung C. Partitioning and diffusion of solutes in hydrogels of poly(ethylene oxide) Biomaterials. 1993;14(15):1117–1126. doi: 10.1016/0142-9612(93)90154-t. [DOI] [PubMed] [Google Scholar]
- 5.Koningsveld R, Kleintjens LA. Liquid-liquid phase separation in multicomponent polymer systems. x. concentration dependence of the pair-interaction parameter in the system cyclohexane-polystyrene. Macromolecules. 1971;4(5):637–641. [Google Scholar]
- 6.Qian C, Mumby SJ, Eichinger BE. Phase diagrams of binary polymer solutions and blends. Macromolecules. 1991;24:1655–1661. [Google Scholar]
- 7.Petri HM, Wolf BA. Concentration-dependent thermodynamic interaction parameters for polymer-solutions - quick and reliable determination via normal gas-chromatography. Macromolecules. 1994;27(10):2714–2718. [Google Scholar]
- 8.Mikos AG, Peppas NA. Flory interaction parameter χ for hydrophilic copolymers with water. Biomaterials. 1988;9:419–423. doi: 10.1016/0142-9612(88)90006-3. [DOI] [PubMed] [Google Scholar]
- 9.McKenna GB, Flynn KM, Chen Y. Swelling in crosslinked natural rubber: experimental evidence of the crosslink density dependence of χ. Polymer. 1990;31:1937–1945. [Google Scholar]
- 10.Huang L, Nishinari K. Interaction between poly(ethylene glycol) and water as studied by differential scanning calorimetry. Journal of Polymer Science Part B - Polymer Physics. 2001;39(5):496–506. [Google Scholar]
- 11.Petri H, Wolf BA. Composition-dependent ory-huggins parameters: molecular weight influences at high concentrations. Macromolecular Chemistry and Physics. 1995;196(7):2321–2333. [Google Scholar]
- 12.Graham N, Zulfiqar M, Nwachuku N, Rashid A. Interaction of poly(ethylene oxide) with solvents: 2. water-poly(ethylene glycol) Polymer. 1989;30(3):528–533. [Google Scholar]
- 13.Lusse S, Arnold K. The interaction of poly(ethylene glycol) with water studied by 1h and 2h nmr relaxation time measurements. Macromolecules. 1996;29(12):4251–4257. [Google Scholar]
- 14.Graham N, Zulfiqar M, Nwachuku N, Rashid A. Interaction of poly(ethylene oxide) with solvents: 4. interaction of water with poly(ethylene oxide) crosslinked hydrogels. Polymer. 1990;31(5):909–916. [Google Scholar]
- 15.Eliassi A, Modares H, Mansouri G. Measurement of activity of water in aqueous poly(ethylene glycol) solutions (effect of excess volume on the ory-huggins chi-parameter) Journal of Chemical and Engineering Data. 1999;44(1):52–55. [Google Scholar]
- 16.Bekiranov S, Bruinsma R, Pincus P. Solution behavior of polyethylene oxide in water as a function of temperature and pressure. Physical Review E. 1997;55(1):577–585. [Google Scholar]
- 17.Dormidontova E. Influence of end groups on phase behavior and properties of peo in aqueous solutions. Macromolecules. 2004;37(20):7747–7761. [Google Scholar]
- 18.Flory PJ. Principles of Polymer Chemistry. Cornell University Press; 1953. [Google Scholar]
- 19.Flory P, Erman B. Theory of Elasticity of Polymer Networks. 3. Macromolecules. 1982;15:800–806. [Google Scholar]
- 20.Holmes M, Mow V. The nonlinear characteristics of soft gels and hydrated connective tissues in ultrafiltration. Journal of Biomechanics. 1990;23(11):1145–1156. doi: 10.1016/0021-9290(90)90007-p. [DOI] [PubMed] [Google Scholar]
- 21.Kwan M, Lai W, Mow V. A finite deformation theory for cartilage and other soft hydrated connective tissues–I. Equilibrium results. J Biomech. 1990;23(2):145–155. doi: 10.1016/0021-9290(90)90348-7. [DOI] [PubMed] [Google Scholar]
- 22.Hong W, Zhao X, Suo Z. Large defromation and electrochemistry of polyelectrolyte gels. Journal of the Mechanics and Physics of Solids. 2010;58:558–577. [Google Scholar]
- 23.Vernerey F, Greenwald E, Bryant S. Triphasic mixture model of cell-mediated enzymantic degradation of hydrogels. Computer Methods in Biomechanics and Biomedical Engineering. 2011;15(11):1197–1210. doi: 10.1080/10255842.2011.585973. [DOI] [PMC free article] [PubMed] [Google Scholar]
- 24.Bell C, Peppas N. Biomedical membranes from hyrogels and interpolymer complexes. Advances in Polymer Science. 1995;122:125–175. [Google Scholar]
- 25.Erman B, Flory P. Experimental Results Relating Stress and Birefringe to Strain in Poly(dimethylsiloxane) Networks. Comparison with Theory. Macromolecules. 1983;16(10):1607–1613. [Google Scholar]
- 26.McDowell DL, Olson G. Concurrent design of hierarchical materials and structures. Journal of Scientific Modeling and Simulation. 2008;15(1–3):207–240. [Google Scholar]
- 27.Roters F, Raabe D, Gottstein G. Work hardening in heterogeneous alloys- a microstructural approach based on three internal state variables. Acta Materialia. 2000;48:4181–4189. [Google Scholar]
- 28.Gambarotta L, Lagomarsino S. A microcack damage model for brittle materials. International Journal of Solids and Structures. 1993;30(2):177–198. [Google Scholar]
- 29.Mather PT, Luo X, Rousseau IA. Shape memory polymer research. Annual Review of Materials Research. 2009;39:445–471. [Google Scholar]
- 30.Dhote V, Vernerey F. Mathematical model of the role of degradation on matrix development in hydrogel scaffold. Biomech. Model. Mechanobiol. 2014;13:167–183. doi: 10.1007/s10237-013-0493-0. [DOI] [PMC free article] [PubMed] [Google Scholar]
- 31.Vernerey F, Farsad M. A mathematical model of the coupled mechanisms of cell adhesion, contraction and spreading. Journal of Mathematical Biology. 2014;68(4):989–1022. doi: 10.1007/s00285-013-0656-8. [DOI] [PMC free article] [PubMed] [Google Scholar]
- 32.Vernerey F, Farsad M. A constrained mixture approach to mechano-sensing and force generation in contractile cells. Journal of the Mechanical Behavior of Biomedical Materials. 2011;4(8):1683–1699. doi: 10.1016/j.jmbbm.2011.05.022. [DOI] [PubMed] [Google Scholar]
- 33.Atzet S, Curtin S, Trinh P, Bryant S, Ratner B. Degradable poly(2-hydroxyethyl methacrylate)-co-polycaprolactone hydrogels for tissue engineering scaffolds. Biomacromolecules. 2008;9(12):3370–3377. doi: 10.1021/bm800686h. [DOI] [PMC free article] [PubMed] [Google Scholar]
- 34.Zhang H, Patel A, Gaharwar AK, Mihaila SM, Iviglia G, Mukundan S, Bae H, Yang H, Khademhosseini A. Hyperbranched polyester hydrogels with controlled drug release and cell adhesion properties. Biomacromolecules. 2013;14(5):1299–1310. doi: 10.1021/bm301825q. [DOI] [PMC free article] [PubMed] [Google Scholar]
- 35.Metters A, Bowman CN, Anseth K. A statistical Kinetic Model for the Bulk Degradation of PLA-b-Peg-b-PLA Hydrogel. Journal of Phys. Chem. B. 2000;104(30):7043–7049. [Google Scholar]
- 36.Farsad M, Vernerey F. An xfem-based numerical strategy to model mechanical interactions between biological cells and a deformable substrate. International Journal of Numerical Methods in Engineering. 2012;92(3):238–267. [Google Scholar]
- 37.Callister WD. Materials Science and Engineering: An Introduction. 7 ed. John Wiley and Sons Inc.; 2007. [Google Scholar]
- 38.Oberkampf WL, Roy CJ. Verification and Validation in Scientific Computing. Cambridge University Press; 2010. [Google Scholar]
- 39.Jin CR, Simpson WT. Comparatice studies of metamodelling techniques under multiple modelling criteria. Structural and Multidisciplinary Optimization. 2001;23:1–13. [Google Scholar]
- 40.Queipo NV, Haftka RT, Shyy W, Goel T, Vaidyanathan R, Tucker PK. Surrogate-based analysis and optimization. Progress in Aerospace Sciences. 2005;41(1):1–28. [Google Scholar]
- 41.Boyd JP. Chebysev and Fourier Spectral Methods. Courier Dover Publications; 2001. [Google Scholar]
- 42.Gould S, Darling N, Anseth K. Small peptide functionalized thiol-ene hydrogels as culture substrates for understanding valvular interstitial cell activation and de novo tissue deposition. Acta Biomaterialia. 2012;8:3201–3209. doi: 10.1016/j.actbio.2012.05.009. [DOI] [PMC free article] [PubMed] [Google Scholar]
- 43.Metters AT, Anseth K, Bowman C. Fundamental studies of a novel, biodegradable peg-b-pla hydrogel. Polymer. 2000;41:3993–4004. [Google Scholar]
- 44.Xiong XP, Eckelt J, Wolf BA. Linear versus three-arm star polybutadiene: Effects of polymer architecture on the thermodynamic solution behavior. Macromolecules. 2012;45(23):9539–9546. [Google Scholar]
- 45.Striolo A, Prausnitz JM. Osmotic second virial coefficient for linear and star poly(ethylene oxide) Polymer. 2001;42(10):4773–4775. [Google Scholar]
- 46.Kofinas P, Athanassiou V, Merrill EW. Hydrogels prepared by electron irradiation of poly(ethylene oxide) in water solution: unexpected dependence of cross-link density and protein diffusion coefficients on initial peo molecular weight. Biomaterials. 1996;17:1547–1550. doi: 10.1016/0142-9612(96)89781-x. [DOI] [PubMed] [Google Scholar]
- 47.Metters A, Hubbell J. Network formation and degradation behavior of hydrogels formed by michael-type addition reactions. Biomacromolecules. 2005;6:290–301. doi: 10.1021/bm049607o. [DOI] [PubMed] [Google Scholar]
- 48.Zhang J, Zhao X, Suo Z, Jiang H. A finite element method for transient analysis of concurrent large deformation and mass transport in gel. Journal of Applied Physics. 2009;105 [Google Scholar]
- 49.Qiao BF, Zhao DL. A theory of polymer solutions without the mean-field approximation in ory-huggins theory. Journal of Chemical Physics. 2004;121(10):4968–4973. doi: 10.1063/1.1781091. [DOI] [PubMed] [Google Scholar]
- 50.Israelachvili J. The different faces of poly(ethylene glycol) Proceedings of the National Academy of Sciences. 1997;94:8378–8379. doi: 10.1073/pnas.94.16.8378. [DOI] [PMC free article] [PubMed] [Google Scholar]
- 51.Wang R, Kreuzer H, Grunze M. The interaction of oligo(ethylene oxide) with water: a quantum mechanical study. Physical Chemistry Chemical Physics. 2000;2:3613–3622. [Google Scholar]
- 52.Nicodemus G, Shiplet K, Kaltz S, Bryant S. Dynamic compressive loading influences degradation behavior of peg-pla hydrogels. Biotechnology Bioengineering. 2009;102(3):948–959. doi: 10.1002/bit.22105. [DOI] [PubMed] [Google Scholar]
- 53.Fairbanks BD, Schwartz MP, Halevi AE, Nuttelman CR, Bowman CN, Anseth KS. A versatile synthetic extracellular matrix mimic via thiol-norbornene photopolymerization. Advanced Materials. 2009;21(48):5005–5010. doi: 10.1002/adma.200901808. [DOI] [PMC free article] [PubMed] [Google Scholar]
- 54.Dhote V, Skaalure S, Akalp U, Roberts J, Bryant S, Vernerey F. On the role of hydrogel structure and degradation in controlling the transport of cell-secreted matrix molecules for engineered cartilage. Journal of the Mechanical Behavior of Biomedical Materials. 2013 Mar;19:61–74. doi: 10.1016/j.jmbbm.2012.10.016. [DOI] [PMC free article] [PubMed] [Google Scholar]


