

Abstract
We present a de novo model building approach that combines predicted backbone conformations with side-chain density-fit to accurately assign sequence into density maps. We show this method yields accurate models for six experimental maps at 3.3–4.8 Å resolution, and produces a nearly complete model for an unsolved map containing a 660-residue hetero-dimeric protein. This method should enable rapid and reliable protein structure determination from near-atomic resolution cryo-EM maps.
Model building is a key step in macromolecular structure determination. While most atomic-resolution structures are solved using X-ray crystallography, single-particle cryo-electron microscopy (cryo-EM) has emerged as a powerful tool in determining electron density maps of large and high-symmetry particles to near-atomic resolution (3–5 Å)1–5. Recent advances even allow it to reach these resolutions from smaller particles with low or no symmetry6–12. Despite these developments, little progress has been made in de novo model building into near-atomic resolution cryo-EM density maps. Structural interpretation of cryo-EM maps typically starts with fitting an atomic X-ray or NMR structure into the map13–15. Previous work has shown that atomic resolution models are achievable from near-atomic resolution cryo-EM density, starting from a homologous structure of the correct topology16. However, when there are no previously solved structures of homologous proteins, de novo model building must be carried out. Currently, such structure determination requires manually building a backbone model into density and assigning sequence6–9. While tracing the backbone into density at this resolution is generally straightforward, manually assigning sequence remains time consuming and error-prone.
Automated protein model-building tools developed for X-ray crystallography18–20 are widely used in structure determination from maps with resolution better than 3 Å. These methods separate backbone tracing and side-chain assignment, with density features largely guiding side-chain identification. Consequently, at resolutions worse than 3 Å, where side-chain density is mostly indiscernible, these approaches fail. Several de novo model building methods targeted to cryo-EM have been developed for maps with resolution ranging from near-atomic (3–5 Å) to medium resolution (5–10 Å)21–23. Although these methods are powerful in identifying the protein topology given a map, they have poor recovery, often <50%, of correct sequence registration21,22. Here, we describe a novel de novo model-building approach for cryo-EM maps at 3–5 Å resolution. Our approach combines sequence-derived backbone conformations with side-chain fit-to-density to assign sequence into the maps. On a benchmark set of nine experimental cryo-EM maps at near-atomic resolution with previously determined structure and a previously unsolved map for the 660-residue contractile sheath protein of the type VI secretion system from Vibrio cholera, we show that high-accuracy models can be obtained without knowledge of detectable structural homologues. Our method should streamline the protein structure determination process from cryo-EM maps at near-atomic resolution.
Our approach for de novo interpretation of near-atomic resolution density maps consists of three steps: (1) matching sequence-based local backbone conformations into the density map; (2) identification of a maximally consistent subset of these fragment matches and assembly into a partial model, and (3) completion of the partial model using density-guided sampling and all-atom refinement (Fig. 1a). In the first step, for overlapping 9-residue windows of amino-acid sequence, we identify segments (or fragments) of solved protein structures with similar local sequences and predicted secondary structures24, analogous to the fragments used in Rosetta de novo structure prediction25. For each fragment, a translation/rotation search identifies placements with good map agreement after optimizing side-chain conformations; only a small subset of these placements are located near the native position (RMSd < 2.5 Å). To identify these correct placements, we search a mutually compatible subset of fragment placements, using a score function that favors fragment pairs with: (a) the same residue in the same place, (b) residues nearby in sequence nearby in space, and (c) no two residues occupying the same space. Simulated annealing Monte Carlo (SA-MC) guided by this score function finds the maximally consistent subset of fragment placements from this larger set. Fragment matching and SA-MC assembly are applied iteratively until >70% of the sequence has been assigned into density. Each iteration places fragments from unassigned sequence positions of the sequence into unoccupied regions in density (Fig. 1b). Finally, the partial model from the final iteration is completed through rebuilding and all-atom refinement using RosettaCM26 guided by the experimental density data.
Figure 1. Protocol Overview.

(a) First, for a 9-residue window centered on each position in the sequence, representative backbone conformations (fragments) are collected and docked into the density map. Second, the resulting fragment placements are then evaluated using a score function consisting of four terms: a density correlation term assessing the agreement of fragment and map; an overlap term favoring fragment pairs assigning the same residue to the same location; a closability term favoring fragment pairs close in sequence that are close in space; and a clash term preventing two residues from occupying the same place. Third, from the candidate placements (square green blocks), simulated annealing Monte Carlo finds a set of fragments (square orange blocks) optimizing the score function; a null placement (empty blocks) may be assigned in positions where no good placements have been identified. Fourth, a partial model is assembled by combining fragment placements from multiple Monte Carlo trajectories. Steps 1–4 are carried out iteratively until ~70% of sequence is covered. Finally, unassigned regions in the final partial model are completed using density-guided loop sampling followed by all-atom refinement. (b) Model building for the 20S α-subunti in a 4.8 Å resolution cryo-EM map required three iterations, illustrated in the three rows in the figure. In leftmost column, the density map used for the corresponding iteration, after masking out density from the previous round’s partial model. In column 2, the assembled partial models after Monte Carlo sampling (colored blue at the N-terminus to red at the C-terminus). In column 3, fragment placement results after translation and rotation search. The x-axis covers the sequence of the protein, and each black point represents a single fragment placement; the y-axis indicates the distance of the fragment placement to the native conformation. Pink points indicate fragments chosen to assemble the partial model, and the grey shading shows residues covered in the partial model. Secondary structural elements in the native are indicated above the plot, where H indicates helix and S indicates strand. In rightmost column, convergence of Monte Carlo trajectories. Each point represents the fragment assignment of an independent search trajectory, colored by number of total fragments placed. The X-axis indicates the percentage of fragments placed within 2.5 Å RMSd to the native configuration, while the Y-axis shows the score with the fragment compatibility function. The horizontal dashed line shows the score cut used for partial model generation.
We tested our method on a benchmark set of 9 proteins. These proteins range in size from 155 to 397 residues, include different fold types, and have experimental cryo-EM maps varying in resolution range from 3.3 to 4.8 Å (Supplementary Table 1). For each map, a single subunit was first segmented from the entire density map. Fragments from proteins with similar topology or sequence were excluded while constructing the fragment libraries. In 7 out of the 9 cases, partial models from the final iteration of the de novo building step are within 1.1–2.3 Å Cα RMSD from the experimental structures (Supplementary Table 1 and Fig. 2), 6 of which are more than 70% complete. These partial models were then completed and refined using RosettaCM, yielding models with 1.3–2.2 Å Cα RMSd (2.0–3.1 Å all-atom RMSd) from the experimentally determined structures. In contrast, Buccaneer18, a widely used model building method from X-ray crystallography – while able to trace portions of the backbone for all targets – only correctly identifies more than 5% of the sequence in 3 cases, and never identifies more than 50% (Supplementary Table 2).
Figure 2. High-accuracy model building in near-atomic resolution cryo-EM maps.
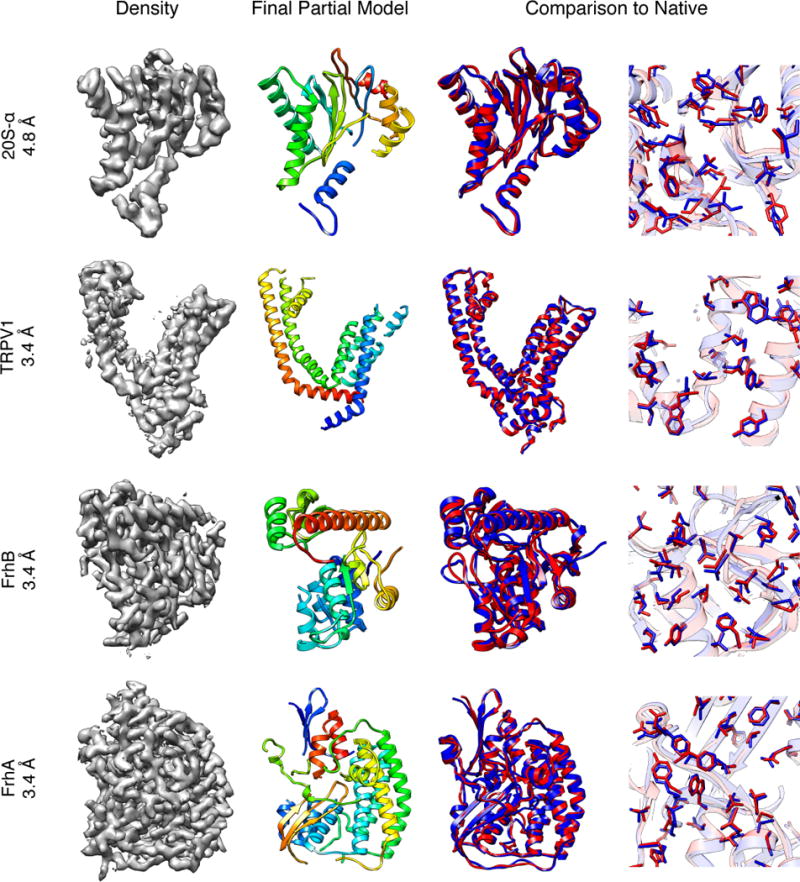
(Leftmost column) The density maps used for de novo model building on 20S-α at 4.8 Å, TRPV1-TM at 3.4 Å, FrhB at 3.4 Å, and FrhA at 3.4 Å (Row 1 to 4, respectively). (Column2) The partial model at the final iteration. (Column 3 and 4) Full-length RosettaCM models (red) are superimposed with the native structure (blue). Each sub-figure shows the lowest-RMSd structure from 10 lowest-electron-density-score models (left) with a close-up of the core showing that native core packing is recovered (right).
Among the proteins in the benchmark set, TRPV18 and FrhB7,27 were proteins with new folds solved recently by manually building models into cryo-EM density. Our method automatically obtained completed models with 1.4 Å Cα RMSd model for TRPV1 and 1.7 Å Cα RMSd for FrhB. To test the resolution limit at which de novo structure determination is possible, a previously unpublished 4.8 Å resolution map from the 20S proteasome α-subunit (20S-α) was used. At this resolution, the α-helix pitch is somewhat visible, however, β-strand separation is only barely resolved (Fig. 1b). Using our approach, the final partial model had 196 out of 221 residues placed, with just 1.3 Å RMSd to the crystal structure (Figs. 1 and 2, and Supplementary Table 1). Using RosettaCM to build a completed model, we obtained a 1.2 Å Cα RMSd model (2.0 Å all-atom RMSd). Despite the lack of side-chain density details, side-chains in the core of the protein show very good agreement to the deposited crystal structure (Fig. 2). Even though one or more of the predicted fragments adopt near-native conformations for 78% of the sequence (Supplementary Table 3), near-native placements of some fragments do not score well enough initially to be carried over to SA-MC assembly. Therefore, we iterate fragment matching and assembly, in each round assembling a consensus assignment, only containing fragments placed in similar locations in all low-scoring SA-MC trajectories. These regions are locked, the corresponding density is masked out, and another round of fragment search and SA-MC is carried out. In all cases except one (TMV), more than one iteration was required to obtain a partial model with at least 70% of the sequence placed (Supplementary Table 1). For example (Fig. 1b and Supplementary Table 1), 20S-α took three rounds to reach this level of coverage; the partial model after one round only had 34% of the sequence placed. Sequence positions at S3, S6 and S7 were correctly traced only in the second round, and S1, S2, S5, S9 and S10 only in the third (Fig. 1b).
There are three cases (BBP1, STIV and VP6) where our approach was unable to automatically determine accurate full-length models. This is clearly identifiable by the poor coverage of the models after a single round of modeling (Supplementary Table 1). There are two main reasons for such failures. If a large portion of the protein does not have sufficiently accurate fragments, it is not possible to accurately assign positions for these residues into the map. BPP1 is one such case, where almost half the sequence has no accurate fragments (Supplementary Table 2). Secondly, β-sheet assembly from fragments is difficult due to the conformational variability of sheets compared to helices. STIV and VP6 are such cases where we fail to accurately build sheets (Supplementary Fig. 2). These failures suggest possibilities for future method improvement.
We applied our method on a recently reconstructed cryo-EM map of the contractile sheath proteins of type VI secretion system (EMD-2699) at 3.5 Å resolution, with no detectable homologues of known structure. The asymmetric unit contained a hetero-dimer with 660 residues total. After manually segmenting the map, eight iterations of our protocol generated a partial model with 466 residues placed. In parallel, the map was manually traced with the aid of Buccaneer in the lab of co-author Basler. There is good overall agreement between two models: over 394 residues, the Cα RMSd is 1.1 Å. However, there are 35 residues where sequence registration is shifted by six positions between the two models (Fig. 3a–b). The segment is flanked by disordered residues; this combined with the poor local resolution makes sequence assignment particularly difficult. The sequence assignment made by our method shows better agreement with the density map than the hand-traced model in this region (Supplementary Fig. 3). We used RosettaCM to assemble full-length structures starting from both configurations. Among the low-energy models RosettaCM generated, the segment assigned by the automated method was exclusively chosen, suggesting our assignment is more energetically favorable and hence correct. Additionally, our approach was able to assign sequence in regions where the manual model did not (Fig. 3c). Combining our model with the manual model in RosettaCM, we were able to build a full-length model for the hetero-dimer complex (Fig. 3d and Kudryashev et al, in review). The blind case shows that our approach is tolerant to errors in segmentation; although our manual segmentation was imperfect, structure determination was still successful.
Figure 3. Blind structure determination.

An error in the manually traced model (pink, a) is corrected by our method (green, b). The arrows in black show the positions of two residues in both models (F95 and F101), highlighting the six-residue registration shift between the models. Orange and blue arrows in (a) and (b) indicate the beginning and end of the region with the sequence registration discrepancy. (c) A partial trace generated by our method in a region where manual tracing was impossible. (d) The full-length RosettaCM model at the same region shows good agreement with the map.
We have developed a method for automatic de novo protein structure determination from near-atomic resolution cryo-EM data, and demonstrated its applicability to a wide range of datasets. Our method uses predicted backbone conformation to aid in sequence assignment, allowing determination of structure to atomic-level accuracy without requiring prior knowledge of protein topology from homologous structures or manually traced models15,16. The key concept introduced in this paper, that certain local sequences have preferences for certain backbone conformations, has previously been used to predict structures of small proteins (< 100 residues)28 de novo, and larger proteins using sparse backbone-only NMR data29–31. However, no previous approach in protein structure modeling has used this concept in conjunction with experimentally determined local Cartesian-space restraints to restrict conformational space. The method described here should provide a general framework for the use of these types of sparse experimental constraints in protein structure determination.
Several improvements will increase both the applicability and accuracy of our approach. Our tests assumed a map where the asymmetric unit was segmented. While manual segmentation is often straightforward (as in the blind case), it may prove difficult in highly intertwined structures. Further improvements of the method on all-β proteins are also necessary: strand-pairing bonuses in the scoring function combined with more aggressive fragment optimization into density should improve accuracy with all-β proteins. Our approach is amenable to incorporate additional structural information: known structures of components are easily incorporated, experimentally derived pairwise distance restraints may guide conformational sampling, and Cα traces provided by users. Our method should contribute to the determination of high accuracy models from near-atomic resolution maps, reducing human effort and errors due to human biases.
Methods
Map preparation
For all benchmark targets, the cryo-EM maps were segmented into single-subunit guided by native structures using UCSF Chimera’s “zone” tool at a distance of 4 Å. The cryo-EM maps and the corresponding deposited native structures used are listed in Table 1.
Matching fragments into density
For each 9-residue window of amino-acid sequence, we used the standard Rosetta fragment picker24 to collect libraries of representative backbone conformations from proteins of known structure based on similar sequence and predicted secondary structure. Fragments from proteins of known structure homology (PSI- BLAST e-value < 0.05) to the benchmark proteins were excluded while constructing the fragment libraries. A sequence-derived fragment library given a protein sequence was curated with 25 backbone conformations per sequence position.
We used backbone information given a fragment to first identify the likely locations and orientations in the density map using 6-D translation/rotation search. The density map was subdivided into a regular three-dimensional grid and the search fragment was translated to each grid point in turn. At each grid point, the spherical harmonic decomposition of model and map density was used to rapidly search all rotations of a backbone fragment against regions of experimental density32. To further speed up matching, this rotation search was only carried out at regions of high density (mean density Z score > 1 in a sphere around each grid point). For each fragment, the top 2000 placements were collected using the approximated correlation score between backbone configurations and density33, giving 50000 candidate placements per sequence position.
Side-chain information was then used to further refine the placements and identify the most likely placements where both backbone and physically realistic side-chain conformations have good agreement to the local density. At each sequence position, the 50000 backbone placements were then further refined with rotamer optimization and rigid-body minimization using Rosetta. After this optimization, 2500 placements for each sequence position are selected for each sequence position using the Rosetta full-atom density correlation score33. These fragments were clustered (with 2 Å RMSd cluster radius), and the lowest density score member was taken from each cluster. Finally, if there were more than 50 clusters, only 50 models were carried over to model assembly.
Evaluating compatible set of fragments
From these fragment placements, we next want to select a mutually compatible set. We assessed this compatibility using a scoring function with four terms:
The term scoredens measures the fit of a fragment to density, and is based on the density correlation between the fragment after side-chain rotamer optimization and the experimental map33. The other three terms, scoreoverlap, scoreclose, and scoreclash, assess the compatibility of a pair of fragments:
The term scoreoverlap gives a bonus to pairs of fragments that place the same residue nearby, with a larger bonus for more overlapping residues; scoreclose penalizes pairs of fragments that put residues close in the sequence further apart than maxdist, the maximum observed distance of residues at a particular sequence separation; finally, scoreclash penalizes fragment pairs with two residues occupying the same place.
Simulated annealing Monte Carlo sampling
Simulated annealing Monte Carlo sampling (SA-MC) was used to search for a set of fragments that are mutually compatible. Each sequence position is initially assigned one random (out of 50 possible) fragment placements or a “null placement” which handles the possibility that there may be no good fragment placements at a particular sequence position. Each step in the trajectory replaces the fragment at a particular position subject to the Metropolis criterion using the scoretotal. For pairwise score terms, precomputing all pairwise scores allows for fast score evaluation of a fragment assignment. To control precision versus coverage, we assign a density score, densnull, to the null placement; lower values lead to reduced coverage but more precision in fragment placement. All experiments in the paper used densnull = −150. Finally, simulated annealing was carried out by slowly reducing the temperature from 500 to 1 in 200 increments with 5000 moves each. Total runtime was approximately 10 minutes per trajectory.
Iterative assembly of models
In many cases, there are a few similar fragment assignments with roughly equivalent scores. To identify all of these alternate models, we run 2000 SA-MC trajectories. We use this ensemble to find a high-confidence partial model to carry into the next round. From the lowest scoring 5% of trajectories, we assemble a backbone model by identifying all residues that are placed in the same position (with 3 Å tolerance) and taking the average backbone coordinate at each residue position. If fewer than 70% of backbone residues have been assigned, we iterate fragment matching and SA-MC assembly. The subsequent iteration of fragment matching was carried out by first masking out density which has been assigned in the backbone model from the previous iteration, then placing fragments only from sequence not yet assigned into density.
Completing models with RosettaCM
The final step in our approach is to rebuild the final set of unassigned residue positions in the partial models using RosettaCM26, a comparative modeling method. Unassigned sequence positions in each partial model are rebuilt in the same manner as unaligned regions in comparative modeling. RosettaCM is guided by the cryo-EM density maps in completing partial models, by adding a score term assessing agreement of a model to experimental density during model-building and refinement with Rosetta’s physically realistic all-atom energy function34. For each partial model, 1000 full-length models are generated with RosettaCM. The best 20% by Rosetta energy are selected, and of those, the 10 models with best fit to the density are selected.
In four of the cases from our testset, this leads to models that have similar or slightly higher RMSds than the partial model from the final iteration, which is expected since the unbuilt parts are mostly loops or regions with less resolved density. However, in two cases – FrhA and 20S-α – we see an improvement in overall RMS. For FrhA, this improvement is particularly striking: the Cα RMSd decreases from 2.3 Å to 1.3 Å. Supplementary Fig. 1 illustrates some improvements in the structure: RosettaCM corrected several loop residues incorrectly placed into density from the previous SA-MC assembly step. As indicated in Supplemtary Table 1, this rebuilding is consistent and robust, with minimal structural deviation over the 10 lowest scoring models.
Model-building with Buccaneer
Model building with Buccaneer18 used the same segmented maps and was provided the same sequences as was our approach. Reflection data was computed from the cryo-EM maps using phenix.map_to_structure_factors35. SIGF was set to F/10 for all reflections using SFTOOLS from the CCP4 Program Suite v6.4.036. A map padding of 5 Å was added to the border to ensure no effects from periodicity on model-building. We ran Buccaneer from the CCP4 Program Suite v6.4.0 with mostly default setting: five cycles of building/refinement were carried out using the correlation target function during model building, with “use R-free” disabled.
20S map reconstruction
T. acidophilum 20S proteasome was expressed and purified from E. coli according to the established protocols37. A drop of 2μL of purified 20S proteasome at a concentration of ~0.9 μM sample was applied to glow-discharged Quantifoil holey carbon grids (Quantifoil, Micro Tools GmbH, Germany), and plunge-frozen by using a Vitrobot Mark III (FEI company, USA). Grids of frozen hydrated samples were imaged using a FEI TF30 Polara electron microscope (FEI Company, Hillsborough, OR) equipped with a field mission electron source and operated at an accelerating voltage of 300kV. Images were recorded at a nominal magnification 20kX using a Gatan K2 Summit™ camera (Gatan Inc., Pleasanton, CA) operated at super resolution counting mode with a calibrated physical pixel size of 1.96 Å at 20kX. A 10 sec exposure time at a dose rate of ~10 counts/pixel/sec leads to a total dose ~30 e−/Å2. The defocus was in the range of 0.8~1.9 μm. The CTFFIND3 (Mindell and Grigorieff, 2003) was used to determine the defocus values. Half number of images with substantial drift and bad Thon rings are discarded. Side view particles of 20S proteasome were picked automatically by using FindEM38. All picked particles were first subject to standard procedure of multiple rounds of multi-reference alignment and classification39. Particles within bad 2D classes were removed. All remaining particles were subject to further manual inspection and more bad particles were removed. The final dataset contains 79,801 particles from 157 images of 20kX magnification.
GeFREALIGN40 was used to refine and determine the 3D reconstructions with a D7 symmetry following a frequency-limited refinement procedure6,41. Note that no motion correction was carried out for this dataset. Atomic structure of archaeal 20S proteasome (pdb code: 2C92) filtered to 15Å was used as initial model. The final 3D reconstruction has a resolution of ~4.8 Å using Fourier Shell Correlation 0.143 criteria42. This resolution is beyond 80% of camera’s physical Nyquist limit. Structure features in the amplitude-sharpened map confirm this claimed resolution.
Method availability
The de novo protein structure determination method described here is freely available for academic use, and will be distributed in an upcoming weekly release of Rosetta modeling suite. A preliminary version of the software described in this manuscript, including all scripts, executable files, and a documented example can be downloaded from: https://www.dropbox.com/s/5jngzlivdtz4zn0/Wang_etal_TRPV1.tar.gz?dl=0
Supplementary Material
Acknowledgments
The authors thank Keith Laidig and Darwin Alonso for setting up and managing the computational resources. This work was supported by the National Institutes of Health under award numbers R01GM092802 (R.Y.W and D.B), EB001567 (E.H.E.), and R01GM098672 (Y.C.); the Swiss systems biology initiative SystemsX.ch grant CINA (M.K.); the University of California, San Francisco Program for Breakthrough Biomedical Research (Y.C.); and Howard Hughes Medical Institute (D.B).
Footnotes
Accession code
The 20S proteasome density map at 4.8 Å has been deposited in EMDataBank (EMD-6219).
Author Contributions
R.Y.W. performed the research and wrote the manuscript. F.D. and D.B. supervised the research and wrote the manuscript. M.K., E.E., M.B., X.L. and Y.C. provided data and analyzed results. All authors edited the final manuscript.
References
- 1.Zhang X, Jin L, Fang Q, Hui WH, Zhou ZH. 3.3 A cryo-EM structure of a nonenveloped virus reveals a priming mechanism for cell entry. Cell. 2010;141:472–82. doi: 10.1016/j.cell.2010.03.041. [DOI] [PMC free article] [PubMed] [Google Scholar]
- 2.Zhang X, et al. Near-atomic resolution using electron cryomicroscopy and single-particle reconstruction. Proc Natl Acad Sci U S A. 2008;105:1867–72. doi: 10.1073/pnas.0711623105. [DOI] [PMC free article] [PubMed] [Google Scholar]
- 3.Veesler D, et al. Atomic structure of the 75 MDa extremophile Sulfolobus turreted icosahedral virus determined by CryoEM and X-ray crystallography. Proc Natl Acad Sci U S A. 2013;110:5504–9. doi: 10.1073/pnas.1300601110. [DOI] [PMC free article] [PubMed] [Google Scholar]
- 4.Grigorieff N, Harrison SC. Near-atomic resolution reconstructions of icosahedral viruses from electron cryo-microscopy. Curr Opin Struct Biol. 2011;21:265–73. doi: 10.1016/j.sbi.2011.01.008. [DOI] [PMC free article] [PubMed] [Google Scholar]
- 5.Hryc CF, Chen DH, Chiu W. Near-atomic-resolution cryo-EM for molecular virology. Curr Opin Virol. 2011;1:110–7. doi: 10.1016/j.coviro.2011.05.019. [DOI] [PMC free article] [PubMed] [Google Scholar]
- 6.Li X, et al. Electron counting and beam-induced motion correction enable near-atomic-resolution single-particle cryo-EM. Nat Methods. 2013;10:584–90. doi: 10.1038/nmeth.2472. [DOI] [PMC free article] [PubMed] [Google Scholar]
- 7.Allegretti M, Mills DJ, McMullan G, Kuhlbrandt W, Vonck J. Atomic model of the F420-reducing [NiFe] hydrogenase by electron cryo-microscopy using a direct electron detector. Elife. 2014;3:e01963. doi: 10.7554/eLife.01963. [DOI] [PMC free article] [PubMed] [Google Scholar]
- 8.Liao M, Cao E, Julius D, Cheng Y. Structure of the TRPV1 ion channel determined by electron cryo-microscopy. Nature. 2013;504:107–12. doi: 10.1038/nature12822. [DOI] [PMC free article] [PubMed] [Google Scholar]
- 9.Amunts A, et al. Structure of the yeast mitochondrial large ribosomal subunit. Science. 2014;343:1485–9. doi: 10.1126/science.1249410. [DOI] [PMC free article] [PubMed] [Google Scholar]
- 10.Bai XC, Fernandez IS, McMullan G, Scheres SH. Ribosome structures to near-atomic resolution from thirty thousand cryo-EM particles. Elife. 2013;2:e00461. doi: 10.7554/eLife.00461. [DOI] [PMC free article] [PubMed] [Google Scholar]
- 11.Lu P, et al. Three-dimensional structure of human gamma-secretase. Nature. 2014;512:166–70. doi: 10.1038/nature13567. [DOI] [PMC free article] [PubMed] [Google Scholar]
- 12.Scheres SH. Beam-induced motion correction for sub-megadalton cryo-EM particles. Elife. 2014;3:e03665. doi: 10.7554/eLife.03665. [DOI] [PMC free article] [PubMed] [Google Scholar]
- 13.Wriggers W, Milligan RA, McCammon JA. Situs: A package for docking crystal structures into low-resolution maps from electron microscopy. J Struct Biol. 1999;125:185–95. doi: 10.1006/jsbi.1998.4080. [DOI] [PubMed] [Google Scholar]
- 14.Rossmann MG, Bernal R, Pletnev SV. Combining electron microscopic with x-ray crystallographic structures. J Struct Biol. 2001;136:190–200. doi: 10.1006/jsbi.2002.4435. [DOI] [PubMed] [Google Scholar]
- 15.Trabuco LG, Villa E, Mitra K, Frank J, Schulten K. Flexible fitting of atomic structures into electron microscopy maps using molecular dynamics. Structure. 2008;16:673–83. doi: 10.1016/j.str.2008.03.005. [DOI] [PMC free article] [PubMed] [Google Scholar]
- 16.DiMaio F, et al. Atomic accuracy models from 4.5 Å cryo-electron microscopy data with density-guided iterative local rebuilding and refinement. Nature Methods. 2014 doi: 10.1038/nmeth.3286. [DOI] [PMC free article] [PubMed] [Google Scholar]
- 17.Zhou ZH. Towards atomic resolution structural determination by single-particle cryo-electron microscopy. Curr Opin Struct Biol. 2008;18:218–28. doi: 10.1016/j.sbi.2008.03.004. [DOI] [PMC free article] [PubMed] [Google Scholar]
- 18.Cowtan K. The Buccaneer software for automated model building. 1. Tracing protein chains. Acta Crystallogr D Biol Crystallogr. 2006;62:1002–11. doi: 10.1107/S0907444906022116. [DOI] [PubMed] [Google Scholar]
- 19.Terwilliger TC, et al. Iterative model building, structure refinement and density modification with the PHENIX AutoBuild wizard. Acta Crystallogr D Biol Crystallogr. 2008;64:61–9. doi: 10.1107/S090744490705024X. [DOI] [PMC free article] [PubMed] [Google Scholar]
- 20.Langer G, Cohen SX, Lamzin VS, Perrakis A. Automated macromolecular model building for X-ray crystallography using ARP/wARP version 7. Nat Protoc. 2008;3:1171–9. doi: 10.1038/nprot.2008.91. [DOI] [PMC free article] [PubMed] [Google Scholar]
- 21.Baker MR, Rees I, Ludtke SJ, Chiu W, Baker ML. Constructing and validating initial Calpha models from subnanometer resolution density maps with pathwalking. Structure. 2012;20:450–63. doi: 10.1016/j.str.2012.01.008. [DOI] [PMC free article] [PubMed] [Google Scholar]
- 22.Lindert S, et al. EM-fold: De novo folding of alpha-helical proteins guided by intermediate-resolution electron microscopy density maps. Structure. 2009;17:990–1003. doi: 10.1016/j.str.2009.06.001. [DOI] [PMC free article] [PubMed] [Google Scholar]
- 23.Baker ML, et al. Modeling protein structure at near atomic resolutions with Gorgon. J Struct Biol. 2011;174:360–73. doi: 10.1016/j.jsb.2011.01.015. [DOI] [PMC free article] [PubMed] [Google Scholar]
- 24.Gront D, Kulp DW, Vernon RM, Strauss CE, Baker D. Generalized fragment picking in Rosetta: design, protocols and applications. PLoS One. 2011;6:e23294. doi: 10.1371/journal.pone.0023294. [DOI] [PMC free article] [PubMed] [Google Scholar]
- 25.Rohl CA, Strauss CE, Misura KM, Baker D. Protein structure prediction using Rosetta. Methods Enzymol. 2004;383:66–93. doi: 10.1016/S0076-6879(04)83004-0. [DOI] [PubMed] [Google Scholar]
- 26.Song Y, et al. High-resolution comparative modeling with RosettaCM. Structure. 2013;21:1735–42. doi: 10.1016/j.str.2013.08.005. [DOI] [PMC free article] [PubMed] [Google Scholar]
- 27.Mills DJ, Vitt S, Strauss M, Shima S, Vonck J. De novo modeling of the F420-reducing [NiFe]-hydrogenase from a methanogenic archaeon by cryo-electron microscopy. Elife. 2013;2:e00218. doi: 10.7554/eLife.00218. [DOI] [PMC free article] [PubMed] [Google Scholar]
- 28.Bradley P, Misura KM, Baker D. Toward high-resolution de novo structure prediction for small proteins. Science. 2005;309:1868–71. doi: 10.1126/science.1113801. [DOI] [PubMed] [Google Scholar]
- 29.Raman S, et al. NMR structure determination for larger proteins using backbone-only data. Science. 2010;327:1014–8. doi: 10.1126/science.1183649. [DOI] [PMC free article] [PubMed] [Google Scholar]
- 30.Lange OF, Baker D. Resolution-adapted recombination of structural features significantly improves sampling in restraint-guided structure calculation. Proteins: Structure, Function, and Bioinformatics. 2012;80:884–895. doi: 10.1002/prot.23245. [DOI] [PMC free article] [PubMed] [Google Scholar]
- 31.Lange OF, et al. Determination of solution structures of proteins up to 40 kDa using CS-Rosetta with sparse NMR data from deuterated samples. Proc Natl Acad Sci U S A. 2012;109:10873–8. doi: 10.1073/pnas.1203013109. [DOI] [PMC free article] [PubMed] [Google Scholar]
- 32.DiMaio FP, Soni AB, Phillips GN, Jr, Shavlik JW. Spherical-harmonic decomposition for molecular recognition in electron-density maps. Int J Data Min Bioinform. 2009;3:205–27. doi: 10.1504/ijdmb.2009.024852. [DOI] [PMC free article] [PubMed] [Google Scholar]
- 33.DiMaio F, Tyka MD, Baker ML, Chiu W, Baker D. Refinement of protein structures into low-resolution density maps using rosetta. J Mol Biol. 2009;392:181–90. doi: 10.1016/j.jmb.2009.07.008. [DOI] [PMC free article] [PubMed] [Google Scholar]
- 34.Kuhlman B, et al. Design of a novel globular protein fold with atomic-level accuracy. Science. 2003;302:1364–8. doi: 10.1126/science.1089427. [DOI] [PubMed] [Google Scholar]
- 35.Adams PD, et al. PHENIX: a comprehensive Python-based system for macromolecular structure solution. Acta Crystallogr D Biol Crystallogr. 2010;66:213–21. doi: 10.1107/S0907444909052925. [DOI] [PMC free article] [PubMed] [Google Scholar]
- 36.Winn MD, et al. Overview of the CCP4 suite and current developments. Acta Crystallogr D Biol Crystallogr. 2011;67:235–42. doi: 10.1107/S0907444910045749. [DOI] [PMC free article] [PubMed] [Google Scholar]
- 37.Chen X, Wang Q, Ni F, Ma J. Structure of the full-length Shaker potassium channel Kv1.2 by normal-mode-based X-ray crystallographic refinement. Proc Natl Acad Sci U S A. 2010;107:11352–7. doi: 10.1073/pnas.1000142107. [DOI] [PMC free article] [PubMed] [Google Scholar]
- 38.Roseman AM. FindEM–a fast, efficient program for automatic selection of particles from electron micrographs. J Struct Biol. 2004;145:91–9. doi: 10.1016/j.jsb.2003.11.007. [DOI] [PubMed] [Google Scholar]
- 39.Frank J, et al. SPIDER and WEB: processing and visualization of images in 3D electron microscopy and related fields. J Struct Biol. 1996;116:190–9. doi: 10.1006/jsbi.1996.0030. [DOI] [PubMed] [Google Scholar]
- 40.Li X, Grigorieff N, Cheng Y. GPU-enabled FREALIGN: accelerating single particle 3D reconstruction and refinement in Fourier space on graphics processors. J Struct Biol. 2010;172:407–12. doi: 10.1016/j.jsb.2010.06.010. [DOI] [PMC free article] [PubMed] [Google Scholar]
- 41.Scheres SH, Chen S. Prevention of overfitting in cryo-EM structure determination. Nat Methods. 2012;9:853–4. doi: 10.1038/nmeth.2115. [DOI] [PMC free article] [PubMed] [Google Scholar]
- 42.Rosenthal PB, Henderson R. Optimal determination of particle orientation, absolute hand, and contrast loss in single-particle electron cryomicroscopy. J Mol Biol. 2003;333:721–45. doi: 10.1016/j.jmb.2003.07.013. [DOI] [PubMed] [Google Scholar]
Associated Data
This section collects any data citations, data availability statements, or supplementary materials included in this article.