

Abstract
Objective
To evaluate the safety and efficacy of a plasmid (VM202) containing two human hepatocyte growth factor isoforms given by intramuscular injections in patients with painful diabetic neuropathy.
Methods
In a double-blind, placebo-controlled study, patients were randomized to receive injections of 8 or 16 mg VM202 per leg or placebo. Divided doses were administered on Day 0 and Day 14. The prospective primary outcome was change in the mean pain score measured by a 7 day pain diary. Secondary outcomes included a responder analysis, quality of life and pain measures, and intraepidermal nerve fiber density.
Results
There were no significant adverse events attributable to VM202. Eighty-four patients completed the study. Patients receiving 8 mg VM202 per leg improved the most in all efficacy measures including a significant (P = 0.03) reduction at 3 months in the mean pain score and continued but not statistically significant reductions in pain at 6 and 9 months. Of these patients, 48.4% experienced a ≥50% reduction in pain compared to 17.6% of placebo patients. There were also significant improvements in the brief pain inventory for patients with diabetic peripheral neuropathy and the questionnaire portion of the Michigan Neuropathy Screening Instrument. Patients not on pregabalin or gabapentin had the largest reductions in pain.
Interpretation
VM202 was safe, well tolerated and effective indicating the feasibility of a nonviral gene therapy approach to painful diabetic neuropathy. Two days of treatment were sufficient to provide symptomatic relief with improvement in quality of life for 3 months. VM202 may be particularly beneficial for patients not taking gabapentin or pregabalin.
Introduction
Painful peripheral neuropathy is a debilitating complication of diabetes mellitus that has a profound negative impact on quality of life, sleep, and mood.1–4 There are no drugs known to halt or reverse the progression of diabetic peripheral neuropathy (DPN), and the only current therapeutic options are analgesics and glucose control.5,6 A therapeutic approach that could stimulate growth or regeneration of peripheral nerves to impede or reverse the manifestations of DPN is needed.
Hepatocyte growth factor (HGF) is a multifunctional, mesenchyme-derived cytokine with potent neurotrophic, angiogenic, and antiapoptotic effects. HGF is trophic for peripheral sensory, sympathetic and motor neurons and enhances neuronal survival and axonal outgrowth both in vitro and in vivo.7–16 The receptor for HGF, c-Met,17 is expressed by Schwann cells as well as peripheral sensory and motor neurons.10,18,19 Nonviral gene transfer of human HGF improved streptozotocin-induced diabetic neuropathy in rats and also improved neuropathic pain-related phenomena in rats.20,21 HGF also stimulated the synthesis of DNA, RNA, and protein in endothelial cells in a dose-dependent manner and attenuated high D glucose-induced endothelial cell death.22,23 HGF gene transfer induced the formation of collateral vessels and increased blood flow both in rat diabetic and nondiabetic hind limb ischemia models.24,25 The combined neurotrophic and angiogenic properties of HGF make it an ideal potential candidate for the treatment of painful DPN.
In humans, two isoforms of HGF are made from the same gene by differential splicing: one consisting of 723 amino acids (HGF723 or called dHGF) and the other of 728 amino acids (HGF728 or called cHGF).26,27 HGF728 and HGF723 share some, but not all, biological functions, and are different in terms of immunological properties. HGF has an in vivo half-life of less than 15 min.28 Thus, a major challenge associated with delivering exogenous HGF to a target site is how to maintain effective doses for therapeutically meaningful lengths of time. One approach is to use nonviral gene therapy to maintain local concentrations of HGF at the sites of injection of the vector.
VM202 is a DNA plasmid that contains a genomic cDNA hybrid human HGF coding sequence expressing both isoforms of HGF simultaneously.29 VM202 more efficiently induced migration of human umbilical vein endothelial cells and C2C12 cells when compared with DNAs expressing either of two isoforms, and it also improved cardiac function in a rat ischemic heart disease model more efficiently than an identical vector encoding only HGF72829,30 Consistent with these preclinical data, an open label phase I/II study in painful DPN and a phase I/II trial for critical limb ischemia showed that VM202 is safe and well tolerated.31,32 Furthermore, intramuscular (IM) VM202 administration provided significant symptomatic relief to patients in the open label study in DPN.31. In total these observations provide a strong rationale for a double-blind, placebo-controlled study to evaluate the safety, tolerability, and preliminary efficacy of HGF gene therapy in patients with painful DPN.
Materials and Methods
Study design
This study was a phase II randomized, multicenter, double-blind, placebo-controlled study designed to assess the safety and efficacy of bilateral IM injections of VM202 in patients with painful DPN (http://www.clinicaltrials.gov registration number: NCT01475786). Potential subjects were evaluated from 17 sites. Patients were randomized within 60 days of screening using a block randomization scheme of 2:2:1 of 8 mg VM202 per leg (16 mg total dose; hereafter low dose [LD] group), 16 mg VM202 per leg (32 mg total dose; hereafter high dose [HD] group), and placebo (P) (saline injection). VM202 or placebo was administered via local IM injections in the calves, with half of the dose administered on Day 0 of the study and the second half administered 2 weeks later. Safety, tolerability, and preliminary efficacy (mean pain reduction and quality of life measures) were evaluated at baseline (screening) and at designated time points throughout the study period. Subjects were followed for 9 months.
Patient eligibility
Eligible patients were men and nonpregnant, nonlactating women of ≥18 years to ≤75 years of age who had been given a primary diagnosis of painful DPN (type I or II diabetes with glycosylated hemoglobin A1C ≤10.0% and lower extremity pain for ≥6 months). Patients were also required to have a score ≥4 cm (0 cm = no pain – 10 cm worst imaginable pain) on the Visual Analogue Scale (VAS) at initial screening, with a ≤5 point difference between legs using the symptoms portion from the brief pain neuropathy screening (BPNS), and a score of ≥3 on the examination component of the Michigan Neuropathy Screening Instrument (MNSI). Pain was confirmed by completion of a 7 day Daily Pain and Sleep Interference Diary after washout of prohibited medications. An average pain score ≥4 with a standard deviation ≤2 was required.
Exclusion criteria included neurologic disorders unrelated to diabetic neuropathy, peripheral neuropathy caused by conditions other than diabetes, other pain more severe than neuropathic pain, myopathy, inflammatory disorder of the blood vessels, active infection, chronic inflammatory disease, stroke, or myocardial infarction within the last 3 months, uncontrolled hypertension, any condition that could confound the study assessment, or recent treatment with any investigational drug or treatment in the past 12 months. In addition, patients were excluded if they were on immunosuppressive medications, were undergoing chemotherapy or radiation therapies, or had evidence (clinical, laboratory or imaging) of malignant neoplasm, except for fully resolved basal cell carcinoma of the skin. Patients also were excluded if they had any of the following abnormal laboratory findings: Hemoglobin <8.0 g/dL, WBC < 3000 cells/μL, platelet count <75,000/mm3, creatinine >2.0 mg/dL; aspartate transaminase (AST) and/or alanine transaminase (ALT) >3 times the upper limit of normal; positive HIV or HTLV serology; positive Hepatitis B or C serology. All patients underwent testing using the American Cancer Society Cancer Screening Guidelines as part of their baseline testing to rule out patients with cancer. Patients were also prohibited from taking daily doses of >81 mg of acetylsalicylic acid, from taking any other COX-1/COX-2 inhibitors (which inhibit HGF activity) and from using opioids for symptomatic relief of DPN.
Materials
VM202 is a 7377-base pair plasmid DNA that contains a genomic cDNA hybrid human HGF coding sequence expressing two isoforms – HGF728 and HGF723.29 It was designed by inserting an optimized truncated intron sequence into sites within HGF cDNA so that both isoforms of HGF protein are expressed simultaneously and efficiently. Because there is no change in the coding region of the HGF gene, HGF proteins generated from VM202 are identical to the wild-type human HGF proteins.
VM202 was supplied in sterile glass vials containing 2.5 mg of the lyophilized study product. The final doses of 8 and 16 mg per leg were divided evenly between the Day 0 and the Day 14 administrations. All subjects received thirty-two 0.5 mL injections IM per calf, per study visit using individual injection syringes prepared by the study pharmacist.
Injection sites were distributed evenly over the calf muscle. Patients receiving placebo received thirty-two 0.5 mL injections of saline per calf per visit. Patients receiving a final dose of 8 mg VM202 per leg received sixteen 0.25 mg/0.5 mL injections of VM202 and sixteen 0.5 mL injections of saline per calf per visit. Patients receiving the 16 mg VM202 final dose per leg received thirty-two 0.25 mg/0.5 mL injections of VM202 per calf per visit. A fine needle (e.g., 27 gauge, 1″) suitable for IM injections was used. Blinding of the treating clinician was maintained because VM202 and saline are visually indistinguishable.
Safety endpoints
A primary intent was to characterize the safety and tolerability of VM202 injections in the calf muscles of patients with DPN. The safety end points including adverse events (AEs), clinical chemistry, ophthalmologic examination using retinal fundoscopy, and physical exam were obtained at screening and during the 9 month follow-up period. Cancer screening included testing for cancer markers; pap smear and mammogram if not performed within past 12 months (females only); prostate specific antigen (males only); for patients ≥50 years old, colonoscopy within past 10 years; and x-ray or CT scan of chest. VM202 DNA concentration levels in whole blood were determined by quantitative real time polymerase chain reaction (QPCR) on Day 0 (preinjection, and 1–3 h post injection), Day 14 (preinjection, and 1–3 h post injection), and Days 21, 30, 60, and 90. The lower limit of quantitation (LLOQ) for VM202 in whole blood was 50 copies. The change from the baseline in serum HGF was assessed on Days 0, 14, 30, 60, and 90 using an enzyme-linked immunosorbent assay (ELISA) kit (R&D systems, Minneapolis, MN).
Efficacy endpoints
Several efficacy parameters were analyzed that focused primarily on reduction in pain and in other symptoms. The primary efficacy endpoint was the mean change from baseline in average pain score as determined by a 7 day Daily Pain and Sleep Interference Diary. The diary asks patients to rate their 24-h average daily pain intensity score using an 11 point Likert-type numerical rating scale from 0 (no pain) to 10 (worst pain possible). The diary was completed at screening following washout of prohibited medications and within 14 days prior to the 3, 6, and 9 months visits. Pain was also evaluated at each in-clinic visit using the visual analog scoring instrument (VAS). Patients were also assessed using brief pain inventory for patients with diabetic peripheral neuropathy (BPI-DPN) questionnaires,33,34 the MNSI,35 and the patient's global impression of change (PGIC). VAS, and BPI-DPN were recorded at Days 0, 30, 60, 90, at 6 and 9 months. Patients’ Global Impression of Change (PGIC) was recorded at Days 30, 60, 90, at 6 and 9 months. MNSI was conducted at 6 and 9 months to track disease progression. Skin biopsy was conducted at baseline and was repeated at 6 months along with the symptoms portion of the brief peripheral neuropathy screening (BPNS). Three millimeter skin biopsy samples were collected from the left ankle, proximal calf, and proximal thigh.
Statistical analyses
A one-way analysis of variance (ANOVA) with treatment (VM202 16 mg per leg, VM202 8 mg per leg, or placebo) as the factor was used to compare the mean change in pain among the three treatment groups. Dunnett's test was used to compare the mean change in pain score between the 16 mg dose per leg to placebo and between the 8 mg dose per leg to placebo. The 95% confidence intervals of the mean pain score differences between dose groups and the placebo group are provided. No imputation was performed.
The PGIC responses at the Days 30, 60, 90, at 6 and 9 months visits were analyzed by the Generalized Estimating Equation with study group (HD, LD, and placebo) and visit as factors, and an unstructured working correlation matrix. Wald statistics were used to compare the differences among the three study groups and the six visits. The effect of HD and that of LD were then compared to the placebo groups since the Wald statistics showed that the treatment groups had statistically significant differences in PGIC.
Approvals
This study was approved by the United States Food and Drug Administration, the Korean Ministry of Food and Drug Safety, the National Institutes of Health Recombinant DNA Advisory Committee (RAC), and the institutional review boards of all participating centers. This study was conducted in accordance with good clinical practice and the Declaration of Helsinki. All subjects provided written informed consent. ClinicalTrials.gov identifier: NCT01475786.
Results
Baseline demographics and medical history
Two-hundred and forty-five subjects were consented and formally screened (Fig.1). One hundred and forty-one subjects were screen failures; 104 were randomized. One subject withdrew prior to treatment. Five subjects were lost to follow-up or withdrew prior to the 9 month study visit. The reported safety data are based on all subjects that received any study medications (n = 103). The majority of subjects (77/103, 74.8%) were male (Table1). Seventy-one subjects (68.9%) were Caucasian; 12 (11.7%) were Black or African American; 17 subjects (16.5%) were Asian; and three subjects were characterized as “Other” (2.9%) (Table1). The average body mass index for all three treatment groups was 30 or higher. The majority of patients were taking one or more medications to manage the pain associated with DPN, and more than one-quarter of all subjects were on two or more such medications prior to study entry (HD: 26.2%, [11/42]; LD: 25%, [10/40]; P: 28.6%, [6/21]). A large percentage of subjects were on pregabalin, gabapentin, and/or duloxetine at study entry (HD: 61.9%, [26/42]; LD: 57.5%, [23/40]; P: 42.9%, [9/21]), and on opioids, NSAIDs, topical analgesics and/or tricyclic antidepressants (HD: 21.4%, [9/42]; LD: 30%, [12/40]; P: 28.6%, [6/21]). Efficacy data are reported in the Efficacy Population, which was determined in a blinded review after database lock. Patients were excluded by protocol due to confounding medication use (e.g., opioids or COX-1/COX-2 inhibitors which inhibit HGF activity), if they did not meet study entry criteria, or if they did not have 6 month data (lost to follow-up not due to AE) (Table S1). Eighty-four subjects met the efficacy group criteria: 17 in the P group, 31 in the LD group, and 36 in the HD group (Fig.1).
Figure 1.
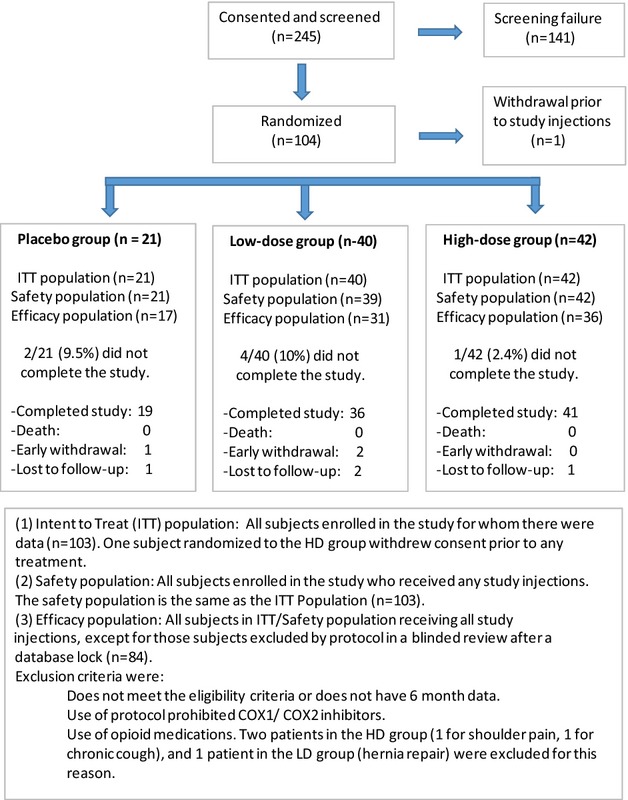
Analysis populations in the study. Intent to treat (ITT) population: All subjects enrolled in the study for whom there were data (n = 103). One subject randomized to the high dose (HD) group withdrew consent prior to any treatment. Safety population: All subjects enrolled in the study who received any study injections. The safety population is the same as the ITT population (n = 103). Efficacy population: All subjects in ITT/safety population receiving all study injections, except for those subjects excluded by protocol in a blinded review after a database lock (n = 84). Exclusion criteria were as follows: does not meet the eligibility criteria or does not have 6 month data. Use of protocol prohibited COX1/COX2 inhibitors. Use of opioid medications. Two patients in the HD group (one for shoulder pain, one for chronic cough), and one patient in the LD group (hernia repair) were excluded for this reason.
Table 1.
Demographics, comorbidities, and concomitant pain medications of the intention to treat population at baseline
| Statistics | High dose (n = 42) | Low dose (n = 40) | Placebo (n = 21) | Overall (n = 103) | P-value |
|---|---|---|---|---|---|
| Age | |||||
| N | 42 | 40 | 21 | 103 | |
| Mean ± SD | 60.6 ± 10.2 | 60.2 ± 7.2 | 60.5 ± 8.3 | 60.4 ± 8.7 | 0.977 |
| Median | 62 | 62 | 61 | 61 | |
| Min, Max | 22, 74 | 45, 71 | 47, 75 | 22, 75 | |
| Sex | |||||
| Female | 9 (21.4%) | 11 (27.5%) | 6 (28.6%) | 26 (25.2%) | 0.733 |
| Male | 33 (78.6%) | 29 (72.5%) | 15 (71.4%) | 77 (74.8%) | |
| Race | |||||
| Asian | 6 (14.3%) | 5 (12.5%) | 6 (28.6%) | 17 (16.5%) | 0.268 |
| Black | 3 (7.1%) | 7 (17.5%) | 2 (9.5%) | 12 (11.7%) | |
| White | 32 (76.2%) | 27 (67.5%) | 12 (57.1%) | 71 (68.9%) | |
| Other: American Indian | 1 (2.4%) | 0 (0.0%) | 0 (0.0%) | 1 (1.0%) | |
| Other: Black-Asian-Native American-White | 0 (0.0%) | 1 (2.5%) | 0 (0.0%) | 1 (1.0%) | |
| Other: Native American | 0 (0.0%) | 0 (0.0%) | 1 (4.8%) | 1 (1.0%) | |
| Height (in) | |||||
| N | 42 | 40 | 21 | 103 | |
| Mean ± SD | 69.2 ± 3.1 | 69.0 ± 3.6 | 68.0 ± 3.6 | 68.9 ± 3.4 | 0.448 |
| Median | 69.3 | 69.0 | 68.4 | 69.1 | |
| Min, Max | 61.0, 75.7 | 62.0, 76.0 | 60.6, 74.8 | 60.6, 76.0 | |
| Weight (lb) | |||||
| N | 42 | 40 | 21 | 103 | |
| Mean ± SD | 223.2 ± 45.9 | 212.7 ± 44.8 | 196.3 ± 42.3 | 213.6 ± 45.4 | 0.083 |
| Median | 217.5 | 205.8 | 192.9 | 209.0 | |
| Min, Max | 112.4, 315.9 | 132.3, 342.8 | 138.9, 278.9 | 112.4, 342.8 | |
| Body mass index | |||||
| N | 42 | 40 | 21 | 103 | |
| Mean ± SD | 32.6 ± 5.8 | 31.3 ± 5.6 | 29.7 ± 5.4 | 31.5 ± 5.7 | 0.147 |
| Median | 32.4 | 31.0 | 29.8 | 31.4 | |
| Min, Max | 17.9, 44.7 | 18.7, 43.4 | 21.1, 38.2 | 17.9, 44.7 | |
| Diabetes type, n (%) | |||||
| Type 1 | 3 (7.1%) | 3 (7.5%) | 1 (4.8%) | 7 (6.8%) | 1.000 |
| Type 2 | 39 (92.9%) | 37 (92.5%) | 20 (95.2%) | 96 (93.2%) | |
| Duration of diabetes (years, mean ± SD) | 16.0 ± 9.2 | 15.3 ± 13.0 | 15.3 ± 8.2 | 15.6 ± 10.6 | 0.948 |
| Duration of DPN (years, mean ± SD) | 8.4 ± 5.1 | 6.7 ± 3.6 | 8.3 ± 5.0 | 7.7 ± 4.6 | 0.191 |
| Baseline pain score (mean ± SD) | 6.6 ± 1.3 | 7.1 ± 1.3 | 6.6 ± 1.4 | 6.8 ± 1.3 | 0.187 |
| Pain medications at entry | |||||
| 1 drug, n (%) | 17 (40%) | 18 (45%) | 10 (48%) | 45 (44%) | 0.074 |
| 2 drugs, n (%) | 8 (19%) | 9 (23%) | 0 (0%) | 17 (17%) | 0.113 |
| 3 drugs, n (%) | 1 (2%) | 0 (0%) | 0 (0%) | 1 (1%) | 1.000 |
| >4 drugs, n (%) | 1 (2%) | 0 (0%) | 0 (0%) | 1 (1%) | 1.000 |
| Anticonvulsant drug | 22 (52%) | 19 (48%) | 8 (38%) | 49 (48%) | 0.478 |
| Opioid | 2 (5%) | 3 (8%) | 0 (0%) | 5 (5%) | 0.829 |
| SNRI | 3 (7%) | 5 (13%) | 1 (5%) | 9 (9%) | 0.781 |
| Trcyclic antidepressant | 3 (7%) | 3 (8%) | 0 (0%) | 6 (6%) | 1.000 |
| NSAID | 7 (17%) | 2 (5%) | 1 (5%) | 10 (10%) | 0.245 |
| Acetaminophen/Paracetamol | 0 (0%) | 1 (3%) | 0 (0%) | 1 (1%) | 0.538 |
Pain medications listed in this table only include concomitant medications taken for the treatment of pain from diabetic peripheral neuropathy. Anticonvulsant drug: pregabalin, gabapentin and clonazepam. Opioid: oxycontin, vicodin, and codein. Serotonin-norepinephrine reuptake inhibitor (SNRI): duloxetine. Tricyclic antidepressant: amitriptyline and nortriptyline. NSAIDs: ibuprofen, meloxicam, and naproxen. 7-day daily pain diary.
Safety and tolerability
There were no deaths or unanticipated AEs in this study. Over the course of the study, 10 subjects in the Safety Population experienced 13 serious adverse events (SAEs) (10/103, 9.7%). All SAEs were classified as unrelated to study drug or placebo. Four subjects in the HD group experienced five SAEs (4/43, 9.3%); three subjects in the LD group experienced three SAEs (3/39, 7.7%); and three subjects in the P group experienced five SAEs (3/21, 14.3%).
Over the course of the study, 202 minor AEs occurred in 69 (69/103, 67%) subjects. Most minor AEs were resolved at study closure (162/202, 80.2%) and the majority of the minor AEs were considered mild in severity (131/202, 64.9%). A total of 26 patients experienced Grade 1 minor injection site reactions (i.e., pain, itching, erythema, and/or bruising) with more than half (14) of the minor skin reactions occurring in the HD group. There were no significant abnormalities in the urinalysis, hematology, and clinical chemistry results across all treatment groups (data not shown).
Serum HGF protein levels were determined by ELISA pre injection on Day 0, immediately pre injection on Day 14, and on Days 30, 60, and 90. The lower limit of quantification (LLOQ) was 0.250 ng/mL of HGF for most assays and 0.500 ng/mL of HGF for the rest. Serum HGF protein levels remained relatively stable throughout the study (no peaks post injections) and were within normal range for patients with diabetes (data not shown).
VM202 plasmid levels in whole blood were determined by PCR at Day 0 (preinjection, and 1–3 h post injection), Days 14 (preinjection, and 1–3 h post injection), and Days 21, 30, 60, and 90. The LLOQ for copies of VM202 in whole blood was 50 copies/μg genomic DNA (10 copies per reaction). In general, the highest numbers of VM202 copies in whole blood were detected in specimens collected at 2 h (±1 h) post injection in patients receiving VM202 treatment (up to ∼3.3 × 10⁷ copies/μg). Copies of VM202 in whole blood were greatly reduced or completely negative within 1 week after VM202 dosing (data not shown).
Daily pain diary
The predetermined primary outcome measure was the Daily Pain and Sleep Interference Diary which quantified subjects’ average 24 h pain and sleep interference. Completed diary data were available for all subjects in the Efficacy Population on Day 0, Day 90, and 6 months. At 9 months, data were missing for one subject in the P group, and one subject in the HD Group. There were no statistically significant differences in pain scores among study groups at screening. At 3 months, patients in the LD group experienced a significant reduction in pain compared to P group (P = 0.04) (Table2 and Fig.2A). Pain reduction persisted at 6 and 9 months in the LD group but statistical significance was not maintained at these follow-up visits (Table2). The HD and P groups did not differ significantly at any timepoint although there was a trend toward improvement in the HD group. Much greater treatment effects were observed in the patients (49/84) who were not taking gabapentin and/or pregabalin during the study compared to the patients (35/84) taking those drugs (Fig.2B and Table2). Patients in the LD group who were not on gabapentin or pregabalin during the study experienced a 3.7-point reduction in pain at 3 months (P = 0.02 by ANOVA among the three groups), and a similar significant reduction in pain was maintained at 6 months (P = 0.03) and 9 months (P = 0.08). Pain reduction in the HD group was unaffected by the presence or absence of cotreatment with gabapentin or pregabalin. However, patients in the P group not on gabapentin/pregabalin experienced a smaller reduction in pain from baseline than patients in the HD group (Fig.2B and Table2).
Table 2.
Daily pain diary: changes in pain severity from baseline
| Population | Visit/statistics | High dose (H) | Low dose (L) | Placebo (P) | ANOVA P-value | H vs. P P-value1 95% CI | L vs. P P-value1 95% CI |
|---|---|---|---|---|---|---|---|
| Efficacy population (n = 84) | Day 90 | n = 36 | n = 31 | n = 17 | |||
| Mean ± SD | −1.90 ± 1.89 | −3.03 ± 2.53 | −1.53 ± 1.76 | 0.033 | 0.758 | 0.038 | |
| 95% CI | −2.53, −1.26 | −3.96, −2.10 | −2.43, −0.62 | −1.76, 1.03 | −2.93, −0.07 | ||
| Median | −1.9 | −2.7 | −1.7 | ||||
| Min, Max | −6.4, 1.7 | −8.6, 0.7 | −5.1, 0.9 | ||||
| Month 6 | n = 36 | n = 31 | n = 17 | ||||
| Mean ± SD | −1.94 ± 1.96 | −2.78 ± 2.23 | −1.59 ± 1.89 | 0.111 | 0.761 | 0.099 | |
| 95% CI | −2.61, −1.28 | −3.59, −1.96 | −2.56, −0.62 | −1.70, 0.99 | −2.56, 0.19 | ||
| Median | −2.1 | −2.1 | −0.9 | ||||
| Min, Max | −5.4, 2.3 | −7.9, 0.0 | −5.0, 1.4 | ||||
| Month 9 | n = 35 | n = 31 | n = 16 | ||||
| Mean ± SD | −2.01 ± 1.98 | −2.98 ± 2.70 | −1.95 ± 2.08 | 0.175 | 0.994 | 0.239 | |
| 95% CI | −2.69, −1.32 | −3.96, −1.99 | −3.06, −0.84 | −1.60, 1.49 | −2.60, 0.55 | ||
| Median | −1.9 | −1.9 | −1.9 | ||||
| Min, Max | −5.6, 1.1 | −8.9, 1.1 | −6.6, 1.2 | ||||
| Subjects who were on gabapentin and/or pregabalin (n = 35) | Day 90 | n = 17 | n = 12 | n = 6 | |||
| Mean ± SD | −1.85 ± 1.80 | −2.01 ± 2.87 | −1.95 ± 1.47 | 0.979 | 0.991 | 0.997 | |
| 95% CI | −2.77, −0.92 | −3.83, −0.19 | −3.50, −0.41 | −2.26, 2.47 | −2.55, 2.43 | ||
| Median | −2.3 | −1.1 | −2.0 | ||||
| Min, Max | −6.4, 0.7 | −8.4, 0.7 | −3.4, −0.3 | ||||
| Month 6 | n = 17 | n = 12 | n = 6 | ||||
| Mean ± SD | −1.87 ± 2.19 | −1.70 ± 2.05 | −2.36 ± 2.30 | 0.831 | 0.827 | 0.739 | |
| 95% CI | −3.00, −0.74 | −3.00, −0.40 | −4.78, 0.06 | −1.85, 2.82 | −1.80, 3.11 | ||
| Median | −2.3 | −1.0 | −2.6 | ||||
| Min, Max | −5.4, 2.3 | −6.6, 0.0 | −4.9, 1.1 | ||||
| Month 9 | n = 16 | n = 12 | n = 5 | ||||
| Mean ± SD | −2.00 ± 1.95 | −2.06 ± 2.91 | −1.66 ± 2.25 | 0.949 | 0.932 | 0.913 | |
| 95% CI | −3.04, −0.95 | −3.91, −0.21 | −4.45, 1.13 | −3.12, 2.44 | −3.29, 2.49 | ||
| Median | −1.5 | −0.9 | −2.0 | ||||
| Min, Max | −5.6, 0.4 | −7.3, 1.1 | −4.4, 1.1 | ||||
| Subjects who were not on gabapentin and/or pregabalin (n = 49) | Day 90 | n = 19 | n = 19 | n = 11 | |||
| Mean ± SD | −1.94 ± 2.01 | −3.67 ± 2.13 | −1.30 ± 1.92 | 0.006 | 0.597 | 0.007 | |
| 95% CI | −2.91, −0.97 | −4.70, −2.65 | −2.59, −0.01 | −2.39, 1.10 | −4.12, −0.63 | ||
| Median | −1.6 | −3.4 | −1.7 | ||||
| Min, Max | −5.4, 1.7 | −8.6, −0.4 | −5.1, 0.9 | ||||
| Month 6 | n = 19 | n = 19 | n = 11 | ||||
| Mean ± SD | −2.01 ± 1.79 | −3.46 ± 2.12 | −1.17 ± 1.58 | 0.006 | 0.386 | 0.005 | |
| 95% CI | −2.87, −1.14 | −4.47, −2.44 | −2.24, −0.11 | −2.45, 0.78 | −3.90, −0.67 | ||
| Median | −1.9 | −2.9 | −0.9 | ||||
| Min, Max | −5.4, 1.1 | −7.9, −0.3 | −5.0, 1.4 | ||||
| Month 9 | n = 19 | n = 19 | n = 11 | ||||
| Mean ± SD | −2.01 ± 2.06 | −3.55 ± 2.45 | −2.08 ± 2.10 | 0.079 | 0.994 | 0.148 | |
| 95% CI | −3.01, −1.02 | −4.74, −2.37 | −3.49, −0.68 | −1.84, 1.98 | −3.38, 0.44 | ||
| Median | −1.9 | −4.0 | −1.9 | ||||
| Min, Max | −5.4, 1.1 | −8.9, −0.1 | −6.6, 0.4 |
Based on Dunnett's test.
Figure 2.
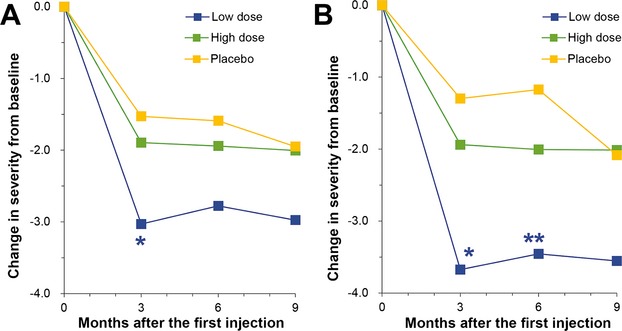
Mean pain scores on the daily pain diary expressed as change from baseline. (A) Scores for all patients in the efficacy population. The means, standard deviations, medians, minimum scores, and maximum scores are given in Table1. The low-dose (LD) group differed significantly from the P group at 3 months (*P = 0.04) by ANOVA with Dunnett's post hoc test. (B) Mean pain scores for patients not taking gabapentin or pregabalin. The LD group differed significantly from the P group both at 3 months (*P = 0.007) and at 6 months (**P = 0.005).
Responder analysis
A responder analysis was conducted using the mean pain scores from the 7 day Daily Pain and Sleep Interference Diary. A responder was defined as a subject that experienced ≥50% reduction in mean pain from baseline. At 90 days, patients in the LD group had nearly threefold more responders than Placebo (P = 0.06; P: 17.6% responders, LD: 48.4% responders). Patients in the HD group had 27.8% responders which was not statistically significant compared to Placebo. By 6 months the number of responders in the LD group decreased to 38.7% and by 9 months to 41.9%, but still trended better than the P group (17.6% at 6 months and 25% at 9 months) and HD groups (25% at 6 months and 28.6% at 9 months). Analysis of responders reporting a > 30% reduction in mean pain from baseline was similar. At 90 days patients in the LD group had twice as many responders as Placebo (P: 29.4% responders; LD: 58.1% responders).
BPI-DPN
The BPI-DPN is a validated pain and quality of life measure for this patient population. Questions one through eight of the questionnaire evaluate pain severity, duration, and pain medications/treatments, and question nine (which is comprised of seven sub-questions) evaluates how the pain interferes with the patient's daily activities. It was administered on Day 0 before the treatment (injection), Days 30, 60, and 90, Months 6, and 9.
Pain interference (BPI-DPN)
Patients in the LD group experienced an overall improvement, in general, in quality of life due to a reduction in pain. This included improvements in some or all of the following: activity, mood, walking ability, ability to work, relationship with other people, sleep, and overall enjoyment of life. Improvements achieved statistical significance in the LD group compared to P group at both 3 and 6 months (−45.29%, P = 0.046, and −37.90%, P = 0.046, respectively) (Fig.3A and Table3). Quality of life improved in the HD group more than in the P group at 6 months, but the difference was not statistically significant.
Figure 3.
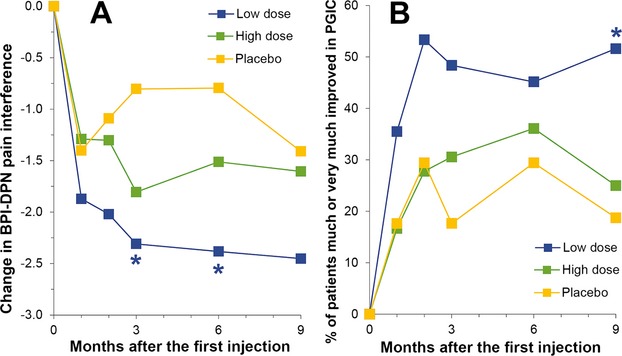
(A) BPI-DPN pain interference scores expressed as change from baseline. The means, standard deviations, medians, minimum scores, and maximum scores are given in Table2. The LD group differed significantly from the P group both at 3 months (*P = 0.046) and at 6 month (*P = 0.046) by ANOVA with Dunnett's post hoc test. (B) Patient's global impression in change (PGIC) expressed as the % of patients who were much or very much improved. The LD group differed significantly from the P group (*P = 0.008) by the Generalized Estimating Equation for repeated measurements. BPI-DPN, brief pain inventory for patients with diabetic peripheral neuropathy; LD, low dose.
Table 3.
Brief pain inventory for patients with diabetic peripheral neuropathy: changes in pain interference from baseline
| Visit/statistics | High dose (H) | Low dose (L) | Placebo (P) | ANOVA P-value | H vs. P P-value1 95% CI | L vs. P P-value1 95% CI |
|---|---|---|---|---|---|---|
| Day 30 | n = 36 | n = 31 | n = 16 | |||
| Mean ± SD | −1.29 ± 1.77 | −1.87 ± 1.85 | −1.40 ± 2.03 | 0.424 | 0.966 | 0.592 |
| 95% CI | −1.89, −0.69 | −2.55, −1.19 | −2.48, −0.32 | −1.13, 1.35 | −1.74, 0.80 | |
| Median | −0.9 | −1.4 | −0.6 | |||
| Min, Max | −6.0, 1.6 | −5.9, 1.6 | −6.7, 0.9 | |||
| Day 60 | n = 36 | n = 30 | n = 16 | |||
| Mean ± SD | −1.30 ± 2.14 | −2.02 ± 2.38 | −1.09 ± 1.90 | 0.287 | 0.916 | 0.273 |
| 95% CI | −2.02, −0.58 | −2.91, −1.13 | −2.10, −0.08 | −1.68, 1.25 | −2.44, 0.58 | |
| Median | −1.5 | −1.6 | −1.1 | |||
| Min, Max | −6.7, 4.0 | −8.0, 2.3 | −4.0, 2.0 | |||
| Day 90 | n = 36 | n = 31 | n = 16 | |||
| Mean ± SD | −1.81 ± 2.14 | −2.31 ± 2.47 | −0.80 ± 1.49 | 0.085 | 0.205 | 0.046 |
| 95% CI | −2.53, −1.08 | −3.21, −1.40 | −1.60, −0.01 | −2.45, 0.45 | −2.99, −0.02 | |
| Median | −1.9 | −1.4 | −0.6 | |||
| Min, Max | −6.1, 1.4 | −7.4, 2.3 | −3.6, 1.9 | |||
| Month 6 | n = 36 | n = 31 | n = 16 | |||
| Mean ± SD | −1.51 ± 2.08 | −2.38 ± 2.65 | −0.79 ± 1.93 | 0.069 | 0.447 | 0.046 |
| 95% CI | −2.21, −0.81 | −3.36, −1.41 | −1.82, 0.23 | −2.24, 0.81 | −3.15, −0.02 | |
| Median | −1.2 | −1.9 | −0.6 | |||
| Min, Max | −5.9, 2.9 | −7.4, 2.3 | −4.0, 1.7 | |||
| Month 9 | n = 36 | n = 31 | n = 15 | |||
| Mean ± SD | −1.61 ± 2.39 | −2.45 ± 2.71 | −1.41 ± 1.61 | 0.252 | 0.941 | 0.267 |
| 95% CI | −2.41, −0.80 | −3.44, −1.46 | −2.30, −0.52 | −1.83, 1.44 | −2.72, 0.64 | |
| Median | −1.4 | −1.7 | −1.6 | |||
| Min, Max | −6.3, 6.6 | −8.0, 2.1 | −3.6, 1.3 |
Based on Dunnett's test.
Pain severity (BPI-DPN)
Patients in the LD group experienced substantial reductions in pain at 3 and 6 months when compared to P group (−41.95%, P = 0.06, and −37.71%, P = 0.05, respectively) (Table4). Pain was reduced in the HD group more than in the P group, but the difference was not statistically significant.
Table 4.
Brief pain inventory for patients with diabetic peripheral neuropathy: changes in pain severity from baseline
| Visit/statistics | High dose (H) | Low dose (L) | Placebo (P) | ANOVA P-value | H vs. P P-value1 95% CI | L vs. P P-value1 95% CI |
|---|---|---|---|---|---|---|
| Day 30 | n = 36 | n = 31 | n = 17 | |||
| Mean ± SD | −0.88 ± 1.48 | −2.11 ± 2.02 | −1.22 ± 1.59 | 0.016 | 0.702 | 0.147 |
| 95% CI | −1.38, −0.38 | −2.85, −1.37 | −2.04, −0.40 | −0.79, 1.47 | −2.05, 0.26 | |
| Median | −0.5 | −2.0 | −0.8 | |||
| Min, Max | −5.3, 1.8 | −7.5, 0.8 | −5.8, 1.0 | |||
| Day 60 | n = 36 | n = 30 | n = 17 | |||
| Mean ± SD | −1.34 ± 1.88 | −2.03 ± 1.76 | −1.04 ± 1.60 | 0.144 | 0.775 | 0.123 |
| 95% CI | −1.98, −0.70 | −2.68, −1.37 | −1.87, −0.22 | −1.47, 0.87 | −2.19, 0.23 | |
| Median | −1.4 | −2.0 | −0.5 | |||
| Min, Max | −6.0, 2.0 | −6.3, 1.0 | −4.0, 1.5 | |||
| Day 90 | n = 36 | n = 31 | n = 17 | |||
| Mean ± SD | −1.94 ± 1.98 | −2.58 ± 2.47 | −1.21 ± 1.85 | 0.108 | 0.378 | 0.064 |
| 95% CI | −2.61, −1.27 | −3.49, −1.68 | −2.16, −0.25 | −2.15, 0.67 | −2.82, 0.07 | |
| Median | −2.0 | −2.3 | −0.8 | |||
| Min, Max | −6.3, 1.8 | −8.3, 1.0 | −4.8, 2.3 | |||
| Month 6 | n = 36 | n = 31 | n = 17 | |||
| Mean ± SD | −1.72 ± 1.81 | −2.27 ± 2.22 | −0.96 ± 1.81 | 0.093 | 0.303 | 0.053 |
| 95% CI | −2.33, −1.10 | −3.08, −1.45 | −1.89, −0.02 | −2.05, 0.53 | −2.63, 0.01 | |
| Median | −1.6 | −1.8 | −0.8 | |||
| Min, Max | −4.8, 2.0 | −7.3, 1.0 | −4.5, 2.3 | |||
| Month 9 | n = 36 | n = 31 | n = 16 | |||
| Mean ± SD | −1.76 ± 2.14 | −2.48 ± 2.49 | −1.36 ± 2.19 | 0.228 | 0.762 | 0.184 |
| 95% CI | −2.48, −1.03 | −3.40, −1.57 | −2.53, −0.19 | −1.93, 1.13 | −2.69, 0.44 | |
| Median | −1.8 | −2.0 | −0.6 | |||
| Min, Max | −6.0, 4.8 | −8.3, 1.5 | −6.0, 2.8 |
Based on Dunnett's test.
Sleep interference and VAS
The degree to which neuropathy pain interfered with a subject's sleep was quantified using the 7 day Daily Pain and Sleep Interference Diary. Subjects reported the most reduction in sleep-interfering pain in LD group (44.28% reduction in sleep interference from baseline, as compared to 20.70% reduction in the P Group), but these improvements were not statistically significant (Table S2). Similarly, VAS scores measured at each in-clinic visit trended toward improvement, but no statistically significant improvement in sleep interference was observed.
Patient's global impression of change
The PGIC questionnaire measures a patient's perception of how treatment affected their level of activity, symptoms, emotions, and overall quality of life. Each descriptor was ranked on an intensity scale of 1 = very much improved; 2 = much improved; 3 = minimally improved; 4 = no change; 5 = minimally worse; 6 = much worse; and 7 = very much worse in comparison to the start of the study.
This test was self-administered on Days 30, 60, and 90, Months 6 and 9. Patients in the LD group reported the greatest degree of improvement at the 90 day, 6 and 9 month visits. At 90 days, only 17.6% (3/17) of patients in the P group were much or very much improved whereas 48.4% (15/31) of patients in the LD group and 30.6% (11/36) of patients in the HD group were much or very much improved (Fig.3B).
MNSI
The MNSI is comprised of a self-administered subject questionnaire (15 questions that require yes/no responses) and a physical evaluation that includes a foot inspection, vibration sensation testing, muscle stretch reflexes, and monofilament testing. The MNSI was conducted at Screening in order to confirm the diagnosis of DPN and at 6 and 9 months to track disease progression.
Patient assessment
Patients in the LD group reported significant improvements at 6 months when compared with P group (P: −0.41 ± 1.87 vs. LD: −1.90 ± 2.04, P = 0.02). Improvements were sustained at 9 months, but were not significant when compared to P group.
Physician assessment
There were no significant overall differences among treatment groups for the physical evaluation portion of the MNSI. However, both the LD and HD groups showed improvements in sensory threshold compared to P group on the monofilament test (Fig.4). At 6 months sensory threshold was improved or normal in only 22.6% (7/31) of the limbs of P group patients but was improved or normal in 37.0% (20/54) in the LD group and 33.9% (21/62) in the HD group. At 9 months sensory threshold was improved or normal in only 19.4% (6/31) of the limbs of P group patients but 41.5% (22/53) of the LD group and 27.4% (17/62) of the HD group.
Figure 4.
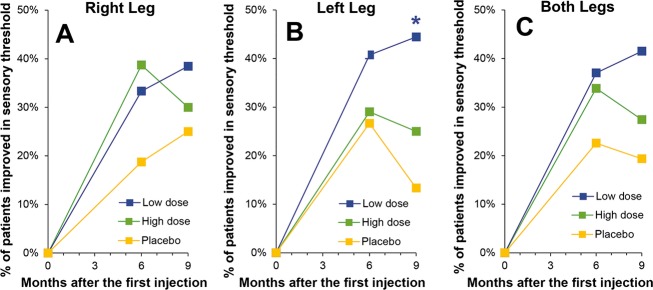
Monofilament test administered as part of the MNSI expressed as the percent of patients improved or normal. Scores are given for (A) right leg, (B) left leg, and (C) both legs. A significant number of subjects in the LD group at 9 months was experienced improvement in sensory threshold of their left leg as compared with the P group (*P = 0.05 by Fischer exact test). MNSI, Michigan Neuropathy Screening Instrument; LD, low dose.
BPNS
The symptoms portion of the BPNS was assessed at prescreening and at Month 6 to evaluate the bilaterality of DPN symptoms. The bilateral nature of neuropathic pain remained the same at 6 months as at baseline, with no significant differences among treatment groups.
Intraepidermal nerve fiber density
There were no significant differences in nerve density at 6 months among treatment groups at any of the sites tested (proximal calf, distal calf, or proximal thigh).
Discussion
The goal of this study was to evaluate the safety as well as the efficacy of nonviral HGF gene therapy for painful DPN. There were no serious AEs associated with VM202 treatment either in this study or in a prior phase I/II of DPN,33 and the plasmid was similarly well tolerated in a study of critical limb ischemia.32 A small number of patients (27) experienced minor injection site reactions. The majority of the skin reactions (14) occurred in the HD group which did not experience significant improvement after treatment, obviating any concern about possible unblinding due to the skin reaction. The remainder of the skin reactions were divided among the LD (10) and placebo groups (3). The safety profile of VM202 thus strongly supports HGF gene therapy as an attractive potential therapeutic approach to DPN.
Although the HGF receptor, c-Met, is expressed by a number of different neuronal populations in the peripheral nervous system as well as by Schwann cells,10,18,19 it is most abundantly expressed by nociceptive neurons in the dorsal root ganglion.8 For this reason amelioration of pain was chosen as the primary endpoint for this study. Administration of a total of 16 mg (LD) of VM202 in two doses separated by 2 weeks resulted in a significant reduction in pain 3 months later as measured by the 7 day Pain and Sleep Interference Diary, significant improvements in the BPI-DPN at 3 and 6 months, significant improvements in the questionnaire portion of the MNSI, improvement in the PGIC, and improvement in sensory threshold evaluated by monofilament testing. These findings are similar to what was observed in a prior open label study of VM202 in DPN in which a similar dose reduced pain, as measured by an in-clinic VAS evaluation. However, there was no placebo comparator arm in that study, so no firm conclusion could be drawn about the efficacy of the treatment. The response of the placebo group in this study was consistent with that seen in the placebo arms of other pain studies in patients with DPN.36 At 90 days, 48.4% of the patients in the LD group experienced a ≥50% reduction in pain compared to only 17.6% of placebo patients. On the PGIC at 90 days, 48% of patients in the LD group were much, or very much, improved whereas only 17% of patients in the Placebo group were much, or very much, improved. Thus, the findings in this study demonstrate a clinically significant therapeutic effect of treatment with VM202.
In the previous phase I/II study of three doses of VM202 there was a progressive enhancement of the therapeutic effect with increasing doses. The highest dose in that study was chosen as the LD in this study, and it was doubled for the HD in this study. The lower dose of VM202 in this study was clearly more effective than the higher dose in all measures. Thus, VM202 displayed a typical dose–response curve at lower pharmacological doses with a bell-shaped dose–response effect at a very HD, a common feature of many drugs and biological agents.37–40 Particularly germane to this study, many growth factors including fibroblast growth factor (FGF), nerve growth factor (NGF), vascular endothelial growth factor (VEGF) and others have been shown to have biphasic dose–response effects on neurite outgrowth both in culture and in vivo (for review see 39). Furthermore, such a biphasic dose–response curve has been previously shown for HGF in a different system.40 Numerous mechanisms have been proposed for such bell-shaped dose–response curves39,40 and any of them could underlie the dose–response curve for VM202. For many drugs dosing is limited by side effects/toxicity, so the bell-shaped part of the efficacy curve is never reached. One of the striking features of the HGF treatment is that there were virtually no side effects which probably reflects the fact that the treatment was local rather than systemic. The lack of side effects allowed us to push the dose to an extremely high level that reached the bell-shaped part of the dose curve. Thus, in both studies the maximal effects were observed at a total dose of 16 mg administered in divided doses over 2 weeks. The effects of the treatment appeared to be maximal at 3 months and to diminish thereafter, suggesting that retreatment at that time might be beneficial.
It was noteworthy that patients not on pregabalin or gabapentin experienced even greater improvements in pain reduction at all time points for both doses of VM202. Patients who were not on gabapentin or pregabalin during the study experienced a remarkable 3.7-point reduction in pain at 3 months after treatment with the 16 mg dose (LD) of VM202. As there were no observable differences between these patient populations for any demographic, HbA1C levels, duration of disease, or pain at study entry, this finding may suggest that the mechanism of action of these drugs somehow attenuates HGF activity. Several studies have demonstrated that pregabalin and gabapentin reduce synaptic vesicle release of a wide range of neurotransmitter substances, both excitatory and inhibitory. This includes release of gamma aminobutyric acid (GABA).41,42 As HGF has been shown to increase GABA production in numerous neurological disorders,43–51 a possible reduction in the inhibitory effects of GABA could result in a reduced therapeutic effect for VM202. Similarly, NMDA activation appears to be requisite for gabapentin and pregabalin activity.41 As HGF decreases synaptic localization of NMDA receptor subunits and inhibits signaling through this receptor,52 activation of NMDA receptors by gabapentin and pregabalin might limit VM202s ability to fully attenuate this neuroexcitatory pathway. Alternatively there may be an unknown variable in the subgroup of patients who have failed with, or are not taking, pregabalin or gabapentin therapy that makes them more responsive to HGF gene therapy. Regardless of the underlying mechanism, the availability of an effective therapy for such patients would be particularly beneficial since there are few effective alternative therapies for them.
One of the features of HGF therapy that distinguishes it from all other currently available approaches to DPN is its potential for disease modification as well as symptom reduction, although such a potential has not yet been demonstrated in clinical trials. Because the treatment preferentially targets smaller fiber (C) rather than large fiber function, electrophysiological examination would be less likely to be revealing. The intradermal nerve fiber density data in this study were inconclusive, but this is not unexpected since the patients received a single course of treatment and the skin biopsies were performed 6 months later. If HGF therapy is actually able to modify DPN, changes in intradermal nerve fiber density would more likely be observed after more prolonged therapy with retreatment at 3 or 4 month intervals. In damaged nerves, c-Met, the HGF receptor, is expressed by medium diameter sensory fibers (Aδ and Aβ) as well as small fibers.18 Interestingly, the monofilament test of Aδ and Aβ fibers53 that was conducted as part of the MNSI evaluation showed a strong trend toward improvement in sensation at 6 months with continued improvements at 9 months. The monofilament testing was not a primary outcome measure and was only part of the MNSI evaluation. Nevertheless, it was one of the only tests of sensory function, and the improvements in treated patients raise the possibility that VM202 has a disease modifying effect separate from effects in reducing symptoms. Prospective use of the Semmes Weinstein monofilament examination in a future pivotal study to quantify the number of insensate sites might provide indirect evidence of disease modification.
Regardless of whether VM202 is able to modify the disease, it was well tolerated and effective in reducing symptoms indicating the feasibility of a nonviral gene therapy approach to painful DPN. Two days of treatment were sufficient to provide symptomatic relief with improvement in quality of life for 3 months. Moreover, VM202 appeared to be particularly beneficial for patients who either failed gabapentin or pregabalin or were not on the drugs for other reasons, so the availability of VM202 as a therapy could potentially provide an effective approach to this group of patients.
Acknowledgments
We acknowledge the dedicated collaboration with Emile R. Mohler, MD, Director of Vascular Medicine, University of Pennsylvania Health System; Tracie C. Collins, MD, MPH, Chair & Professor, Kansas Public Health Department; J. Michael White, Ph.D. at JM White Associates, who are DSMB members; and Reyon Pharmaceuticals.
Conflict of Interest
All investigators received financial support from Viromed which constitutes a potential conflict of interest for most institutions. Dr. Simpson received consulting fees from Viromed [Corrections added on 17 April 2015 after first online publication: the statement initially declares that there was no conflict of interest among the investigators and authors.].
Supporting Information
Additional Supporting Information may be found in the online version of this article:
Table S1. Intention to treat patients not included in the efficacy analysis.
Table S2. Daily diary sleep interference change from baseline.
References
- Jensen MP, Chodroff MJ, Dworkin RH. The impact of neuropathic pain on health-related quality of life: review and implications. Neurology. 2007;68:1178–1182. doi: 10.1212/01.wnl.0000259085.61898.9e. [DOI] [PubMed] [Google Scholar]
- Vinik AI, Nevoret ML, Casellini C, Parson H. Diabetic neuropathy. Endocrinol Metab Clin North Am. 2013;42:747–787. doi: 10.1016/j.ecl.2013.06.001. [DOI] [PubMed] [Google Scholar]
- Davies M, Brophy S, Williams R, Taylor A. The prevalence, severity, and impact of painful diabetic peripheral neuropathy in type 2 diabetes. Diabetes Care. 2006;29:1518–1522. doi: 10.2337/dc05-2228. [DOI] [PubMed] [Google Scholar]
- O'Connor AB. Neuropathic pain: quality-of-life impact, costs and cost effectiveness of therapy. Pharmacoeconomics. 2009;27:95–112. doi: 10.2165/00019053-200927020-00002. [DOI] [PubMed] [Google Scholar]
- Callaghan BC, Cheng HT, Stables CL, et al. Diabetic neuropathy: clinical manifestations and current treatments. Lancet Neurol. 2012;11:521–534. doi: 10.1016/S1474-4422(12)70065-0. [DOI] [PMC free article] [PubMed] [Google Scholar]
- Veves A, Backonja M, Malik RA. Painful diabetic neuropathy: epidemiology, natural history, early diagnosis, and treatment options. Pain Med. 2008;9:660–674. doi: 10.1111/j.1526-4637.2007.00347.x. [DOI] [PubMed] [Google Scholar]
- Funakoshi H, Nakamura T. Identification of HGF-like protein as a novel neurotrophic factor for avian dorsal root ganglion sensory neurons. Biochem Biophys Res Commun. 2001;283:606–612. doi: 10.1006/bbrc.2001.4819. [DOI] [PubMed] [Google Scholar]
- Maina F, Hilton MC, Ponzetto C, et al. Met receptor signaling is required for sensory nerve development and HGF promotes axonal growth and survival of sensory neurons. Genes Dev. 1997;11:3341–3350. doi: 10.1101/gad.11.24.3341. [DOI] [PMC free article] [PubMed] [Google Scholar]
- Gascon E, Gaillard S, Malapert P, et al. Hepatocyte growth factor-Met signaling is required for Runx1 extinction and peptidergic differentiation in primary nociceptive neurons. J Neurosci. 2010;30:12414–12423. doi: 10.1523/JNEUROSCI.3135-10.2010. [DOI] [PMC free article] [PubMed] [Google Scholar]
- Hashimoto N, Yamanaka H, Fukuoka T, et al. Expression of HGF and cMet in the peripheral nervous system of adult rats following sciatic nerve injury. Neuroreport. 2001;12:1403–1407. doi: 10.1097/00001756-200105250-00022. [DOI] [PubMed] [Google Scholar]
- Cheng C, Guo GF, Martinez JA, et al. Dynamic plasticity of axons within a cutaneous milieu. J Neurosci. 2010;30:14735–14744. doi: 10.1523/JNEUROSCI.2919-10.2010. [DOI] [PMC free article] [PubMed] [Google Scholar]
- Kato N, Nemoto K, Nakanishi K, et al. Nonviral HVJ (hemagglutinating virus of Japan) liposome-mediated retrograde gene transfer of human hepatocyte growth factor into rat nervous system promotes functional and histological recovery of the crushed nerve. Neurosci Res. 2005;52:299–310. doi: 10.1016/j.neures.2005.04.004. [DOI] [PubMed] [Google Scholar]
- Ebens A, Brose K, Leonardo ED, et al. Hepatocyte growth factor scatter factor is an axonal chemoattractant and a neurotrophic factor for spinal motor neurons. Neuron. 1996;17:1157–1172. doi: 10.1016/s0896-6273(00)80247-0. [DOI] [PubMed] [Google Scholar]
- Wong V, Glass DJ, Arriaga R, et al. Hepatocyte growth factor promotes motor neuron survival and synergizes with ciliary neurotrophic factor. J Biol Chem. 1997;272:5187–5191. doi: 10.1074/jbc.272.8.5187. [DOI] [PubMed] [Google Scholar]
- Thompson J, Dolcet X, Hilton M, et al. HGF promotes survival and growth of maturing sympathetic neurons by PI-3 kinase- and MAP kinase-dependent mechanisms. Mol Cell Neurosci. 2004;27:441–452. doi: 10.1016/j.mcn.2004.07.007. [DOI] [PubMed] [Google Scholar]
- Yang XM, Toma JG, Bamji SX, et al. Autocrine hepatocyte growth factor provides a local mechanism for promoting axonal growth. J Neurosci. 1998;18:8369–8381. doi: 10.1523/JNEUROSCI.18-20-08369.1998. [DOI] [PMC free article] [PubMed] [Google Scholar]
- Bottaro DP, Rubin JS, Faletto DL, et al. Identification of the hepatocyte growth factor receptor as the c-met proto-oncogene product. Science. 1991;251:802–804. doi: 10.1126/science.1846706. [DOI] [PubMed] [Google Scholar]
- Zheng LF, Wang R, Yu QP, et al. Expression of HGF/c-Met is dynamically regulated in the dorsal root ganglions and spinal cord of adult rats following sciatic nerve ligation. Neurosignals. 2010;18:49–56. doi: 10.1159/000320715. [DOI] [PubMed] [Google Scholar]
- Hashimoto N, Yamanaka H, Fukuoka T, et al. Expression of hepatocyte growth factor in primary sensory neurons of adult rats. Brain Res Mol Brain Res. 2001;97:83–88. doi: 10.1016/s0169-328x(01)00284-4. [DOI] [PubMed] [Google Scholar]
- Kato N, Nemoto K, Nakanishi K, et al. Nonviral gene transfer of human hepatocyte growth factor improves streptozotocin-induced diabetic neuropathy in rats. Diabetes. 2005;54:846–854. doi: 10.2337/diabetes.54.3.846. [DOI] [PubMed] [Google Scholar]
- Tsuchihara T, Ogata S, Nemoto K, et al. Nonviral retrograde gene transfer of human hepatocyte growth factor improves neuropathic pain-related phenomena in rats. Mol Ther. 2009;17:42–50. doi: 10.1038/mt.2008.214. [DOI] [PMC free article] [PubMed] [Google Scholar]
- Bussolino F, Di Renzo MF, Ziche M, et al. Hepatocyte growth factor is a potent angiogenic factor which stimulates endothelial cell motility and growth. J Cell Biol. 1992;119:629–641. doi: 10.1083/jcb.119.3.629. [DOI] [PMC free article] [PubMed] [Google Scholar]
- Matsumoto K, Nakamura T. Emerging multipotent aspects of hepatocyte growth factor. J Biochem. 1996;119:591–600. doi: 10.1093/oxfordjournals.jbchem.a021283. [DOI] [PubMed] [Google Scholar]
- Taniyama Y, Morishita R, Hiraoka K, et al. Therapeutic angiogenesis induced by human hepatocyte growth factor gene in rat diabetic hind limb ischemia model: molecular mechanisms of delayed angiogenesis in diabetes. Circulation. 2001;104:2344–2350. doi: 10.1161/hc4401.098470. [DOI] [PubMed] [Google Scholar]
- Taniyama Y, Morishita R, Aoki M, et al. Therapeutic angiogenesis induced by human hepatocyte growth factor gene in rat and rabbit hindlimb ischemia models: preclinical study for treatment of peripheral arterial disease. Gene Ther. 2001;8:181–189. doi: 10.1038/sj.gt.3301379. [DOI] [PubMed] [Google Scholar]
- Lokker NA, Mark MR, Luis EA, et al. Structure- function analysis of hepatocyte growth factor: identification of variants that lack mitogenic activity yet retain high affinity receptor binding. EMBO J. 1992;11:2503–2510. doi: 10.1002/j.1460-2075.1992.tb05315.x. [DOI] [PMC free article] [PubMed] [Google Scholar]
- Shima N, Tsuda E, Goto M, et al. Hepatocyte growth factor and its variant with a deletion of five amino acids are distinguishable in their biological activity and tertiary structure. Biochem Biophys Res Commun. 1994;200:808–815. doi: 10.1006/bbrc.1994.1523. [DOI] [PubMed] [Google Scholar]
- Liu ML, Mars WM, Zarnegar R, Michalopoulos GK. Uptake and distribution of hepatocyte growth factor in normal and regenerating adult rat liver. Am J Pathol. 1994;144:129–140. [PMC free article] [PubMed] [Google Scholar]
- Pyun WB, Hahn W, Kim DS, et al. Naked DNA expressing two isoforms of hepatocyte growth factor induces collateral artery augmentation in a rabbit model of limb ischemia. Gene Ther. 2010;17:1442–1452. doi: 10.1038/gt.2010.101. [DOI] [PubMed] [Google Scholar]
- Hahn W, Pyun WB, Kim DS, et al. Enhanced cardioprotective effects by coexpression of two isoforms of hepatocyte growth factor from naked plasmid DNA in a rat ischemic heart disease model. J Gene Med. 2011;13:549–555. doi: 10.1002/jgm.1603. [DOI] [PubMed] [Google Scholar]
- Ajroud-Driss S, Christiansen M, Allen JA, Kessler JA. Phase 1/2 open-label dose-escalation study of plasmid DNA expressing two isoforms of hepatocyte growth factor in patients with painful diabetic peripheral neuropathy. Mol Ther. 2013;21:1279–1286. doi: 10.1038/mt.2013.69. [DOI] [PMC free article] [PubMed] [Google Scholar]
- Henry TD, Hirsch AT, Goldman J, et al. Safety of a non-viral plasmid-encoding dual isoforms of hepatocyte growth factor in critical limb ischemia patients: a phase I study. Gene Ther. 2011;18:788–794. doi: 10.1038/gt.2011.21. [DOI] [PubMed] [Google Scholar]
- Cleeland CS, Ryan KM. Pain assessment: global use of the Brief Pain Inventory. Ann Acad Med Singapore. 1994;23:129–138. [PubMed] [Google Scholar]
- Zelman DC, Gore M, Dukes E, et al. Validation of a modified version of the brief pain inventory for painful diabetic peripheral neuropathy. J Pain Symptom Manage. 2005;29:401–410. doi: 10.1016/j.jpainsymman.2004.06.018. [DOI] [PubMed] [Google Scholar]
- Moghtaderi A, Bakhshipour A, Rashidi H. Validation of Michigan neuropathy screening instrument for diabetic peripheral neuropathy. Clin Neurol Neurosurg. 2006;108:477–481. doi: 10.1016/j.clineuro.2005.08.003. [DOI] [PubMed] [Google Scholar]
- Snedecor SJ, Sudharshan L, Cappelleri JC, et al. Systematic review and meta-analysis of pharmacological therapies for painful diabetic peripheral neuropathy. Pain Pract. 2014;14:167–184. doi: 10.1111/papr.12054. [DOI] [PubMed] [Google Scholar]
- Christ GJ, Andersson K-E, editors. Regenerative pharmacology. Cambridge, UK: Cambridge University Press; 2013. p. 55. [Google Scholar]
- Calabrese EJ, Baldwin LA. Hormesis: the dose-response revolution. Annu Rev Pharmacol Toxicol. 2003;43:175–197. doi: 10.1146/annurev.pharmtox.43.100901.140223. [DOI] [PubMed] [Google Scholar]
- Calabrese EJ. Enhancing and regulating neurite outgrowth. Crit Rev Toxicol. 2008;38:391–418. doi: 10.1080/10408440801981981. [DOI] [PubMed] [Google Scholar]
- Konstorum A, Sprowl SA, Waterman ML, et al. Predicting mechanism of biphasic growth factor action on tumor growth using a multi-species model with feedback control. J Coupled Syst Multiscale Dyn. 2013;1:459–467. doi: 10.1166/jcsmd.2013.1028. [DOI] [PMC free article] [PubMed] [Google Scholar]
- Micheva KD, Taylor CP, Smith SJ. Pregabalin reduces the release of synaptic vesicles from cultured hippocampal neurons. Mol Pharmacol. 2006;70:467–476. doi: 10.1124/mol.106.023309. [DOI] [PubMed] [Google Scholar]
- Taylor CP, Angelotti T, Fauman E. Pharmacology and mechanism of action of pregabalin: the calcium channel alpha2-delta (alpha2-delta) subunit as a target for antiepileptic drug discovery. Epilepsy Res. 2007;73:137–150. doi: 10.1016/j.eplepsyres.2006.09.008. [DOI] [PubMed] [Google Scholar]
- Bissonette GB, Bae MH, Suresh T, et al. Prefrontal cognitive deficits in mice with altered cerebral cortical GABAergic interneurons. Behav Brain Res. 2014;259:143–151. doi: 10.1016/j.bbr.2013.10.051. [DOI] [PMC free article] [PubMed] [Google Scholar]
- Russo AJ, Krigsman A, Jepson B, Wakefield A. Decreased serum hepatocyte growth factor (HGF) in autistic children with severe gastrointestinal disease. Biomark Insights. 2009;4:181–190. doi: 10.4137/bmi.s3656. [DOI] [PMC free article] [PubMed] [Google Scholar]
- Russo AJ, Pietsch SC. Decreased hepatocyte growth factor (HGF) and gamma aminobutyric acid (GABA) in individuals with obsessive-compulsive disorder (OCD) Biomark Insights. 2013;8:107–114. doi: 10.4137/BMI.S11931. [DOI] [PMC free article] [PubMed] [Google Scholar]
- Sharma S. Hepatocyte growth factor in synaptic plasticity and Alzheimer's disease. ScientificWorldJournal. 2010;10:457–461. doi: 10.1100/tsw.2010.49. [DOI] [PMC free article] [PubMed] [Google Scholar]
- McDowell I. Alzheimer's disease: insights from epidemiology. Aging (Milano) 2001;13:143–162. doi: 10.1007/BF03351474. [DOI] [PubMed] [Google Scholar]
- Hebert LE, Weuve J, Scherr PA, Evans DA. Alzheimer disease in the United States (2010–2050) estimated using the 2010 census. Neurology. 2013;80:1778–1783. doi: 10.1212/WNL.0b013e31828726f5. [DOI] [PMC free article] [PubMed] [Google Scholar]
- Koike H, Ishida A, Shimamura M, et al. Prevention of onset of Parkinson's disease by in vivo gene transfer of human hepatocyte growth factor in rodent model: a model of gene therapy for Parkinson's disease. Gene Ther. 2006;13:1639–1644. doi: 10.1038/sj.gt.3302810. [DOI] [PubMed] [Google Scholar]
- Elbaz A, Bower JH, Maraganore DM, et al. Risk tables for parkinsonism and Parkinson's disease. J Clin Epidemiol. 2002;55:25–31. doi: 10.1016/s0895-4356(01)00425-5. [DOI] [PubMed] [Google Scholar]
- Nomura M, Oketa Y, Yasui K, et al. Expression of hepatocyte growth factor in the skin of amyotrophic lateral sclerosis. Acta Neurol Scand. 2012;125:389–397. doi: 10.1111/j.1600-0404.2011.01579.x. [DOI] [PubMed] [Google Scholar]
- Akita H, Takagi N, Ishihara N, et al. Hepatocyte growth factor improves synaptic localization of the NMDA receptor and intracellular signaling after excitotoxic injury in cultured hippocampal neurons. Exp Neurol. 2008;210:83–94. doi: 10.1016/j.expneurol.2007.10.001. [DOI] [PubMed] [Google Scholar]
- Keizer D, Fael D, Wierda JMKH, van Wijhe M. Quantitative sensory testing with Von Frey monofilaments in patients with allodynia: what are we quantifying? Clin J Pain. 2008;24:463–466. doi: 10.1097/AJP.0b013e3181673b80. [DOI] [PubMed] [Google Scholar]
Associated Data
This section collects any data citations, data availability statements, or supplementary materials included in this article.
Supplementary Materials
Table S1. Intention to treat patients not included in the efficacy analysis.
Table S2. Daily diary sleep interference change from baseline.