

Abstract
Although interferon-λ [also known as type III interferon or interleukin-28 (IL-28)/IL-29] restricts infection by several viruses, its inhibitory mechanism has remained uncertain. We used recombinant interferon-λ and mice lacking the interferon-λ receptor (IFNLR1) to evaluate the effect of interferon-λ on infection with West Nile virus, an encephalitic flavivirus. Cell culture studies in mouse keratinocytes and dendritic cells showed no direct antiviral effect of exogenous interferon-λ, even though expression of interferon-stimulated genes was induced. We observed no differences in West Nile virus burden between wild-type and Ifnlr1−/− mice in the draining lymph nodes, spleen, or blood. We detected increased West Nile virus infection in the brain and spinal cord of Ifnlr1−/− mice, yet this was not associated with a direct antiviral effect in mouse neurons. Instead, we observed an increase in blood-brain barrier permeability in Ifnlr1−/− mice. Treatment of mice with pegylated interferon-λ2 resulted in decreased blood-brain barrier permeability, reduced West Nile virus infection in the brain without affecting viremia, and improved survival against lethal virus challenge. An in vitro model of the blood-brain barrier showed that interferon-λ signaling in mouse brain microvascular endothelial cells increased transendothelial electrical resistance, decreased virus movement across the barrier, and modulated tight junction protein localization in a protein synthesis– and signal transducer and activator of transcription 1 (STAT1)–independent manner. Our data establish an indirect antiviral function of interferon-λ in which noncanonical signaling through IFNLR1 tightens the blood-brain barrier and restricts viral neuroinvasion and pathogenesis.
Introduction
Interferon-λ (IFN-λ) belongs to a family of cytokines that signal through the heterodimeric IFN-λ receptor, IFNLR, which is composed of interleukin-10 receptor β (IL-10Rβ) and IFNLR1 (IL-28Rα). Analogous to signaling by IFN-α/β and its heterodimeric receptor, IFNAR, binding of IFN-λ to IFNLR initiates a Janus kinase–signal transducer and activator of transcription (JAK-STAT) signaling cascade that induces expression of genes with antiviral and immunomodulatory activities (1). Mice lacking IFNLR1 (Ifnlr1−/−) do not respond to IFN-λ but retain relatively normal responses to IFN-α/β (2). In contrast to IL-10Rβ, which is expressed more widely, IFNLR1 exhibits a cell type–restricted expression pattern (3, 4). IFNLR1 is expressed preferentially on epithelial cells, and inhibitory effects of IFN-λ in vivo have been documented against viruses that target epithelial tissues (4–8). In cell culture, IFN-λ reportedly inhibits infection of a broader panel of viruses, including West Nile virus (WNV) (9).
WNV is an encephalitic flavivirus that cycles in nature between birds and mosquitoes, with humans becoming infected as incidental deadend hosts. About 20% of infected humans develop a febrile illness, and a subset of these progress to severe neuroinvasive disease (10). Among hospitalized patients, the case fatality rate is 5 to 10%, and survivors are commonly left with debilitating neurologic sequelae.
Because WNV is highly neurovirulent, the failure of infections to progress uniformly to neurologic disease suggests that barriers to neuroinvasion exist and that dissemination into the central nervous system (CNS) determines clinical outcome. The precise mechanisms by which WNV spreads to the brain and spinal cord remain unclear (11), but neuroinvasion likely occurs by a hematogenous route. Thus, the blood-brain barrier (BBB) represents a key defense against WNV neuroinvasion (12). The BBB is composed of tight junctions between endothelial cells of the CNS microvasculature and the end-feet of astrocytes; the endothelial cells and astrocytes are further separated by two basement membranes and a perivascular space. BBB permeability is increased in response to proinflammatory stimuli, including lipopolysaccharide (LPS), tumor necrosis factor–α (TNF–α), and IFN-γ, and this opening also permits trafficking of immune cells into the CNS (13, 14). Although BBB opening may be necessary to resolve certain CNS infections, it is regulated to avoid pathological consequences from infiltrating cells or other substances from the periphery (12).
Although some inflammatory stimuli increase BBB permeability, IFN-α/β may enhance BBB integrity. IFN-β treatment reduces endothelial permeability in an in vitro model of the BBB (14, 15) and is used therapeutically to treat multiple sclerosis, which features BBB breakdown and trafficking of autoreactive T cells into the CNS as key components of the disease pathology (16). In tissue culture, IFN-β directly regulates endothelial permeability and tight junction formation via the actions of the GTPases (guanosine triphosphatases) Rac1 and RhoA (14). Given the analogous JAK-STAT–dependent signaling pathways induced by IFN-α/β and IFN-λ, we evaluated the antiviral effects of IFN-λ on WNV infection. Our results suggest that IFN-λ signaling inhibits WNV infection of the CNS by modulating endothelial cell tight junction integrity, which decreases BBB permeability, restricts virus neuroinvasion, and prevents lethal infection.
Results
IFN-λ does not inhibit WNV infection of relevant target cells
Given that IFN-λ reportedly induces an antiviral gene program similar to IFN-α/β (17–19), we tested whether it would inhibit WNV infection in cell culture. We expected IFN-λ to exert its greatest effects on epithelial cells because of the reported tissue-specific expression pattern of Ifnlr1 (3–5). Before assaying for direct antiviral effects, we assessed the relative mRNA expression of the receptors for IFN-α/β (Ifnar1) and IFN-λ (Ifnlr1 and Il10rb) in primary cells: cortical neurons and bone marrow–derived dendritic cells (DCs) and macrophages (Fig. 1, A to D).We also tested a mouse keratinocyte cell line because keratinocytes are one of the few epithelial cells targeted by WNV in vivo (20). All cell types expressed Ifnar1, whereas Il10rb was detected in keratinocytes, DCs, and macrophages, but not cortical neurons. We detected Ifnlr1 expression in keratinocytes and DCs, but expression in macrophages and cortical neurons was near the limit of detection. As expected, Ifnlr1 expression was not detected in cells from Ifnlr1−/− mice.
Fig. 1. IFN-λ produces cell type–restricted induction of ISGs.

(A to D) Expression of Ifnar1, Ifnlr1, and Il10rb was measured by qRT-PCR from uninfected mouse keratinocytes, DCs, macrophages, orcortical neurons. Gene expression was normalized to 18S ribosomal RNA (rRNA). Dotted lines indicate the sensitivity of the assay. WT, wild type. (E to G) Mouse keratinocytes and DCs were treated with murine IFN-λ3 or IFN-β for 6 hours. Expression of Ifit1, Rsad2, and Irf7 was measured by qRT-PCR. Gene expression was normalized to 18S rRNA and to mock-treated cells. Results represent means ± SEM of nine samples from three independent experiments. Dotted lines indicate gene expression in mock-treated cells. (H) Mouse keratinocytes were treated with IFN-λ3 for 6 hours, and expression of Ifit1 was measured by qRT-PCR. Gene expression was normalized to Gapdh. The dotted line represents gene expression in mock-treated cells. Results represent means ± SEM of 2 to 10 samples from three independent experiments. (I) Mouse DCs were treated with IFN-λ3 (10 ng/ml) or IFN-β (20 ng/ml) for 6 hours. Total RNA was analyzed by RNA-seq. Genes that were induced or repressed by more than threefold (relative to mock-treated) are shown in a heatmap representation.
On the basis of Ifnlr1 mRNA expression, we chose keratinocytes and DCs for further studies. We treated cells with IFN-λ3 or IFN-β for 6 hours and measured IFN-stimulated gene (ISG) expression by quantitative reverse transcription polymerase chain reaction (qRT-PCR). Ifit1 and Rsad2 were up-regulated in response to IFN-λ3 or IFN-β (Fig. 1, E and F), although induction was lower with IFN-λ than IFN-β. For example, in keratinocytes, IFN-β (0.1 ng/ml) increased Ifit1 mRNA expression by ∼1700-fold, whereas IFN-λ (100 ng/ml) produced a <150 fold increase (Fig. 1E). The effect of IFN-λ on ISG expression was less potent in DCs compared to keratinocytes and was absent in Ifnlr1−/− DCs. Although IFN-λ induced expression of the ISGs Ifit1 and Rsad2, unlike IFN-β, it did not stimulate expression of Irf7 (Fig. 1G). An increase in the IFN-λ dose to 1000 ng/ml failed to increase ISG expression further (Fig. 1H).
We extended these results using RNA-seq (RNA sequencing) analysis to obtain a profile of the IFN-λ gene signature in primary DCs (Fig. 1I). Using a threefold induction cutoff (relative to mock) after 6 hours of IFN treatment, we detected induction of 208 genes in IFN-β–treated DCs, whereas no genes were induced to this level in the IFN-λ–treated DCs (table S1). We also did not detect any ISGs that were induced uniquely by IFN-λ; the IFN-λ– stimulated genes were a subset of those induced by IFN-β.
To assess whether the gene program induced by IFN-λ inhibited WNV replication, we treated keratinocytes and DCs with IFN-λ3 or IFN-β before infection. In keratinocytes, we observed a dose-dependent inhibition of viral replication by IFN-β (Fig. 2A). In both wild-type and Ifnlr1−/− DCs, even the lower dose of IFN-β blocked WNV infection (Fig. 2, B and C). We did not observe any inhibition of WNV replication by IFN-λ3, even at doses that induced ISGs. We performed multistep viral growth analyses in primary cells from Ifnlr1−/− and wild-type mice and found no differences in WNV infection between Ifnlr1−/− and wild-type DCs, macrophages, or cortical neurons (Fig. 2, D to F). Our results suggest that although IFN-λ induced expression of ISGs, the effect was not directly antiviral. This may be because either the magnitude of the response was insufficient or the specific set of genes induced was not inhibitory against WNV.
Fig. 2. IFN-λ does not directly inhibit WNV infection.

(A to C) Mouse keratinocytes and DCs were pretreated with murine IFN-λ3 or IFN-β for 6 hours and then infected with WNV at a multiplicity of infection (MOI) of 0.1. Viral infection was measured by focus-forming assay and expressed as focus-forming units (FFU) per milliliter. (D to F) Primary cells prepared from WT or Ifnlr1−/− mice were infected with WNV. Results represent means ± SEM of nine samples from three independent experiments. Dotted lines indicate the sensitivity of the assay. Viral titers in IFN- treated cells were compared to mock-treated cells [two-way analysis of variance (ANOVA)]. (A) **P = 0.0057. (B) ***P = 0.0004, ****P < 0.0001. (C) **P= 0.0075, ****P < 0.0001. (D to F) The differences between WT and Ifnlr1−/− cells were not statistically significant (two-way ANOVA).
IFN-λ signaling limits WNV neuroinvasion
We assessed a role for IFN-λ in restricting WNV infection in vivo. We infected wild-type and Ifnlr1−/− mice and measured viral burden in tissues. Wild-type and Ifnlr1−/− mice displayed no significant differences in viral loads at any time point in peripheral tissues, including the serum, draining lymph nodes, spleen, and kidney (Fig. 3, A to D). However, Ifnlr1−/− mice sustained higher viral titers in the brain and spinal cord at days 6 and 8 after infection (Fig. 3, E and F). We also detected virus in the brain earlier in a subset of Ifnlr1−/− mice compared to wild-type mice (two of eight Ifnlr1−/−mice positive at day 4 after infection, compared to zero of five wild-type mice).
Fig. 3. Viral burden in WT and Ifnlr1−/− mice.

(A to I) Nine- to 12-week-old mice were infected with 102 plaque-forming units (PFU) of WNV via subcutaneous injection (A to F) or 101 PFU via intracranial injection (G to I). (A and B) Viral RNA was measured by qRT-PCR. (C to F) Viral titers were measured by plaque assay. Symbols represent individual mice from several independent experiments; bars indicate the mean of 5 to 15 mice per group. (G to I) Viral infection in CNS tissues was measured by plaque assay. Bars indicate the mean of five to six mice per group from two independent experiments. Dotted lines represent the limit of sensitivity of the assay. Viral titers in WT and Ifnlr1−/− mice were compared by the Mann-Whitney test (A to F) or t test (G to I). (E) *P = 0.0124, **P = 0.0045. (F) **P = 0.0031.
To determine whether the higher WNV titers in the CNS of Ifnlr1−/− mice reflected a direct antiviral effect of IFN-λ in brain tissues, we infected mice by an intracranial route and measured viral titers 3 and 5 days after infection. We found no difference in viral titer between wild-type and Ifnlr1−/−mice in any of the CNS regions examined (Fig. 3, G to I). Thus, although Ifnlr1−/− mice developed enhanced CNS infection after peripheral WNV infection, no increase was observed when the virus was inoculated directly into the brain.
Ifnlr1−/− mice develop normal adaptive immune responses to WNV infection
We considered whether IFN-λ might restrict WNV neuroinvasion indirectly by regulating adaptive immune responses, which are required to prevent dissemination to the CNS (21). However, we detected no difference in serum concentrations of anti-WNV immunoglobulin M (IgM) or IgG at days 4, 6, or 8 after WNV infection between wild-type and Ifnlr1−/− mice (fig. S1). To assess cellular immune responses, we profiled leukocytes from the spleen and brain at 8 days after WNV infection and found no differences between wild-type and Ifnlr1−/− mice in total numbers or percentages of CD11b+, CD11c+, CD4+, or CD8+ cells (Fig. 4, A to D and K to N). Antigen-specific CD8+ T cell responses were equivalent between wild-type and Ifnlr1−/− mice (Fig. 4, E and O), and effector functions (production of granzyme B, IFN-γ, and TNF-α) also were similar between wild-type and Ifnlr1−/−mice in both the spleen and the brain (Fig. 4, F to J and P to T).
Fig. 4. Cellular immune responses in WT and Ifnlr1−/− mice.

(A to T) Leukocytes were harvested from the spleen (A to J) and brain (K to T) 8 days after WNV infection. Cells were stained with antibodies against CD45, CD19, CD11b, CD11c, CD3, CD4, CD8, and granzyme B. Cells were either stained with a tetramer displaying the immunodominant WNV peptide (Db-NS4B) (E and O) or restimulated with NS4B peptide and then stained with antibodies against IFN-γ and TNF-α (G, H, Q, and R). Total numbers of the indicated cell populations are shown. IFN-γ and TNF-α production is expressed as geometric mean fluorescence intensity (GMFI). Symbols represent individual mice, and data are combined from two independent experiments. The differences between WT and Ifnlr1−/− mice were not significant (Mann-Whitney test). Representative flow cytometry plots showing CD8+ and NS4B+ cells (I and S) or CD8+ and IFN-γ+ cells (J and T). Numbers indicate the percentage of cells in each quadrant, and the results are representative of two independent experiments.
Ifnlr1−/− mice have increased BBB permeability after WNV infection
Because IFN-α/β signaling can enhance BBB integrity (14), we hypothesized that IFN-λ might exert an analogous effect to prevent virus transport across the BBB, which could explain the increased CNS infection observed in Ifnlr1−/− mice. We assessed BBB permeability in wild-type and Ifnlr1−/− mice 4 days after WNV infection. Compared to mock-infected mice, WNV infection resulted in increased extravasation of sodium fluorescein dye from the peripheral circulation into the CNS (Fig. 5, A to C). Although Ifnlr1−/− mice showed no basal differences in BBB permeability compared to wild-type mice, the WNV-induced permeability change was greater in Ifnlr1−/− mice, suggesting that IFN-λ signaling may tighten the barrier in response to infection. As an independent measure of BBB permeability, we assessed leakage of endogenous IgG into the brain parenchyma after WNV infection (14). Although minimal IgG was detected in the brains of uninfected mice, IgG accumulation became apparent at 4 days after infection, and Ifnlr1−/− mice exhibited greater leakage than did wild-type mice (Fig. 5, D and E). Thus, in the context of WNV infection, the BBB of Ifnlr1−/− mice was more permeable to both small molecules and proteins. Given that inflammatory cytokines, including IFN-γ and TNF-α, promote BBB opening (14, 22), we considered whether the increased permeability in Ifnlr1−/− mice was due to elevated cytokine production. We measured concentrations of 21 cytokines in serum at 3 and 5 days after infection and found no differences between wild-type and Ifnlr1−/− mice (table S2). We also assessed IFN-α/β activity in the serum and found no differences between WNV-infected wild-type and Ifnlr1−/− mice (fig. S2).
Fig. 5. BBB permeability in infected WT and Ifnlr1−/− mice.
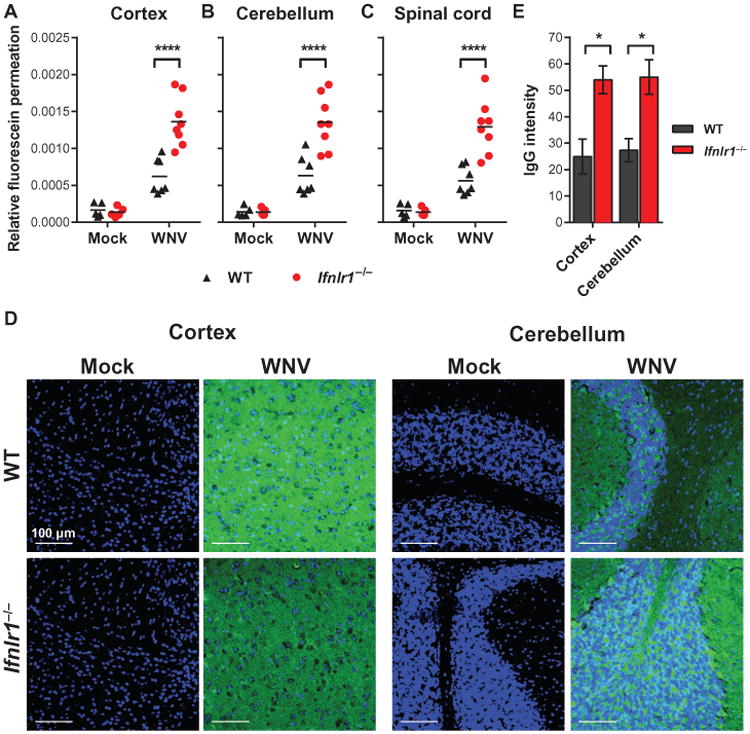
WT and Ifnlr1−/− mice were infected via a subcutaneous route with WNV or diluent (mock). (A to C) BBB permeability was assessed at 4 days after infection by measuring the accumulation of sodium fluorescein dye in CNS tissues after intraperitoneal administration. Symbols represent individual animals from two independent experiments. ****P < 0.0001 (t test). (D and E) Brain sections were stained to detect endogenous IgG leakage into the CNS parenchyma (shown in green); nuclei are shown in blue. Representative images were taken at×40 magnification (scale bars, 100 mm). (E) IgG staining was quantified from two fields from three mice per group and compared by t test. Cortex: *P = 0.0263; cerebellum: *P = 0.0241.
IFN-λ signaling improves endothelial barrier integrity in vitro
To explore how IFN-λ signaling modulates WNV entry into the CNS, we used an in vitro model of the BBB (14, 23). In this system, brain microvasculature endothelial cells (BMECs) were cultured in the upper chamber of a Transwell insert, with supporting astrocytes in the lower chamber. Transendothelial electrical resistance (TEER) across the BMEC monolayer indicated endothelial monolayer integrity, with higher resistance representing a tighter barrier. We first measured expression of IFN receptors and WNV replication in the two primary cell typesin this system. BMECs and astrocytes expressed abundant Ifnar1 and Il10rb mRNA, whereas Ifnlr1 mRNA expression was low (Fig. 6, A and B). We found no difference in WNV replication in BMECs and astrocytes prepared from wild-type and Ifnlr1−/− mice (Fig. 6, C and D).
Fig. 6. IFN-λ increases TEER in BMECs.

(A and B) Expression of Ifnar1, Ifnlr1, and Il10rb was measured by qRT-PCR from WT uninfected BMECs and astrocytes. Gene expression was normalized to 18S rRNA. (C and D) BMECs and astrocytes prepared from WT and Ifnlr1−/− mice were infected with WNV, and viral replication was measured by focus-forming assay (expressed as focus-forming units per milliliter). Results represent means ±SEM of nine samples from three experiments. The differences between WT and Ifnlr1−/− cells were not significant (two-way ANOVA). (E to I) WT or Ifnlr1−/− BMECs were cultured on Transwell inserts with astrocytes prepared from WT (E, left; and F to I) or Ifnlr1−/−(E, right) mice. Results represent means ± SEM of nine samples from two experiments. (E) BMECs were infected with WNV, and TEER was measured 6 hours later. WNV-infected WT BMECs were compared to Ifnlr1−/− BMECs (t test). ****P < 0.0001, ***P = 0.0006. (F) BMECs were treated with murine IFN-β or IFN-λ3, and TEER was measured 6 hours later. WT BMECs were compared to Ifnlr1−/− BMECs (t test). IFN-β and IFN-λ (10 ng/ml): ****P < 0.0001. IFN-λ (100 ng/ml): ***P = 0.0003. (G) BMECs were pretreated with an IFNAR-blocking or isotype control monoclonal antibody (MAb) and then infected with WNV. TEER was measured 6 hours after infection. WT BMECs were compared to Ifnlr1−/− BMECs (t test). ****P < 0.0001. (H) WT BMECs were pretreated with cycloheximide (CHX) (20 μg/ml) for 18 hours and then infected with WNV or treated with murine IFN-β (10 ng/ml) or IFN-λ3 (100 ng/ml). TEER was measured 6 hours later. CHX-treated BMECs were compared to media-treated cells (t test). ****P < 0.0001, *P = 0.009. (I) BMECs were prepared from WT and Stat1−/− mice and treated with murine IFN-β or IFN-λ3, and TEER was measured 2, 6, and 12 hours after treatment. Results represent means ± SEM of six samples from two experiments. IFN-treated BMECs were compared to vehicle-treated cells of the same genotype at 2 hours after treatment (t test). IFN-β: ***P = 0.0005 (WT), ***P < 0.0001 (Stat1−/−). IFN-λ: *P = 0.0204 (WT), *P = 0.0347 (Stat1−/−). WT and Stat1−/− cells were compared by two-way ANOVA. IFN-β: *P = 0.0311. (J) HCMEC/D3 cells were cultured on Transwell inserts and treated with human IFN-β (10 ng/ml) or pegylated human IFN-λ1 (100 ng/ml), and TEER was measured. Results represent means ± SEM of eight samples from two experiments. IFN-treated cells were compared to vehicle-treated cells at 2 hours after treatment (t test). IFN-β: ****P < 0.0001. IFN-λ: **P = 0.0011. IFN-β– and IFN-λ–treated cells were compared by two-way ANOVA. ***P = 0.0006. (K and L) HCMEC/D3 cells were pretreated for 18 hours with LPS (100 ng/ml) or media as control, followed by pegylated human IFN-λ1 (100 ng/ml) for 6 hours (or media). The cells were then infected with WNV at an MOI of 0.01 from the upper chamber. TEER was measured over the course of the experiment (K); at 6 hours after infection, virus crossing into the lower chamber was measured by qRT-PCR (L). Results represent means ± SEM of 12 samples from three experiments. (K) IFN-λ treatment was compared to media or LPS treatment by two-way ANOVA (K) or t test (L). ****P < 0.0001, **P = 0.0047.
We next infected Transwell cultures of BMECs with WNV and measured TEER after 6 hours, a time point that precedes de novo spread of WNV infection (24). Although wild-type and Ifnlr1−/− BMECs exhibited equivalent TEER in the absence of infection, the increase in TEER after WNV infection was blunted in Ifnlr1−/− cells (Fig. 6E). The effect of IFN-λ was due to signaling in BMECs rather than astrocytes; in reciprocal culture experiments, only Ifnlr1−/− BMECs exhibited the lower TEER phenotype regardless of the astrocyte genotype (Fig. 6E). Therefore, subsequent Transwell experiments used wild-type astrocytes paired with wild-type or Ifnlr1−/− BMECs.
We next treated BMECs with recombinant murine IFNs for 6 hours and measured TEER. IFN-λ3 produced a dose-dependent increase in TEER at 6 hours, and this effect was abolished in Ifnlr1−/− BMECs (Fig. 6F). As observed previously (14, 15), IFN-β treatment produced an increase in TEER. However, this effect was diminished in Ifnlr1−/−BMECs, suggesting that a portion of the IFN-β effect may be due to IFN-λ signaling. To distinguish the contributions of IFN-α/β and IFN-λ to the WNV-induced TEER increase, we pretreated BMECs with a blocking monoclonal antibody against IFNAR1 (25). When IFN-α/β signaling was blocked, WNV infection did not produce an increase in TEER in either wild-type or Ifnlr1−/− BMECs (Fig. 6G). These results suggest that IFN-λ signaling promotes endothelial barrier tightening and that IFN-λ production after WNV infection requires IFN-α/β signaling, as opposed to being induced directly by pattern recognition receptor signaling pathways.
Because it remained possible that the IFN-λ signaling effect on TEER was mediated by an induced cytokine, we tested the requirement for de novo protein synthesis. BMECs were pretreated with the protein synthesis inhibitor cycloheximide and then infected with WNV or treated with IFN-β or IFN-λ3 for 6 hours. When cycloheximide was added, the WNV-induced increase in TEER was abolished and the IFN-β–induced increase was diminished (Fig. 6H). Cycloheximide treatment had no effect on the increase in TEER produced by IFN-λ3, indicating that BMECs could form a tighter barrier downstream of IFN-λ–IFNLR signaling without requiring de novo protein synthesis.
To define further the signaling pathway by which IFN-λ regulates TEER changes in BMECs, we assessed mRNA expression of Ifnb, Ifna, and Il28b in BMECs after treatment with IFN-β, IFN-λ3, or LPS for 6 hours. We did not detect expression of these IFNs, although the ISGs Ifit1 and Rsad2 were induced (fig. S3). Given the results from the cycloheximide experiments (Fig. 6H), we hypothesized that the IFN-λ–induced TEER response might occur through a noncanonical signaling pathway that did not require ISG expression. To evaluate this, we prepared BMECs from wild-type and Stat1−/− mice and measured TEER after treatment with IFN-β or IFN-λ3. Both IFN-l and IFN-β induced increases in TEER within 2 hours of treatment in a STAT1-independent manner (Fig. 6I). At later time points (for example, 12 hours), TEER values were lower in Stat1−/− cells compared to wild-type cells, indicating a subordinate role for canonical STAT1 signaling and possibly ISG expression in barrier tightening. To determine whether IFN-λ also could induce endothelial barrier tightening in human cells, we treated a human BMEC cell line (HCMEC/D3) (23) in a Transwell insert with pegylated human IFN-λ1 or human IFN-β and measured TEER over time (Fig. 6J). Within 2 hours of IFN treatment, TEER increased markedly, demonstrating analogous effects of IFN-λ on mouse and human BMECs. Our experiments suggest a model in which WNV infection stimulates the production of IFN-λ, possibly downstream of IFN-α/β signaling. Along with IFN-α/β signaling through IFNAR (14), circulating IFN-λ would signal through IFNLR on BMECs via a noncanonical STAT1-independent and protein synthesis–independent pathway to tighten the endothelial barrier and limit viral neuroinvasion.
We questioned whether changes in TEER directly affected transit of WNV across the endothelial barrier. We treated HCMEC/D3 cells first with LPS for 18 hours, and then with IFN-λ1 for 6 hours. We then added WNV to the upper chamber and, after 6 hours, measured virus that had crossed into the lower chamber. As expected, we observed decreased TEER after LPS treatment and an increase in TEER in response to IFN-λ treatment (Fig. 6K). Consistent with the changes in TEER, LPS treatment resulted in greater crossing of WNV into the lower chamber, and this effect was diminished by IFN-λ treatment (Fig. 6L). Thus, IFN-λ signaling promotes endothelial barrier tightening, which restricts WNV transit.
To define how IFN-λ modulates TEER, we analyzed the location of the endothelial cell junction proteins ZO-1 and claudin-5 in BMECs and mouse brain sections after treatment with LPS and IFN-λ (Fig. 7). Whereas colocalization of ZO-1 and claudin-5 was observed in mock-treated BMECs, treatment with LPS, which disrupts BBB integrity (13), caused ZO-1 and claudin-5 to dissociate. The effect of LPS on cell junction protein colocalization was reversed by IFN-λ3 treatment (Fig. 7, A and B). We observed a similar effect in the brains of mice treated with LPS and pegylated IFN-λ2 (Fig. 7C).
Fig. 7. Cell junction protein localization in endothelial cells.
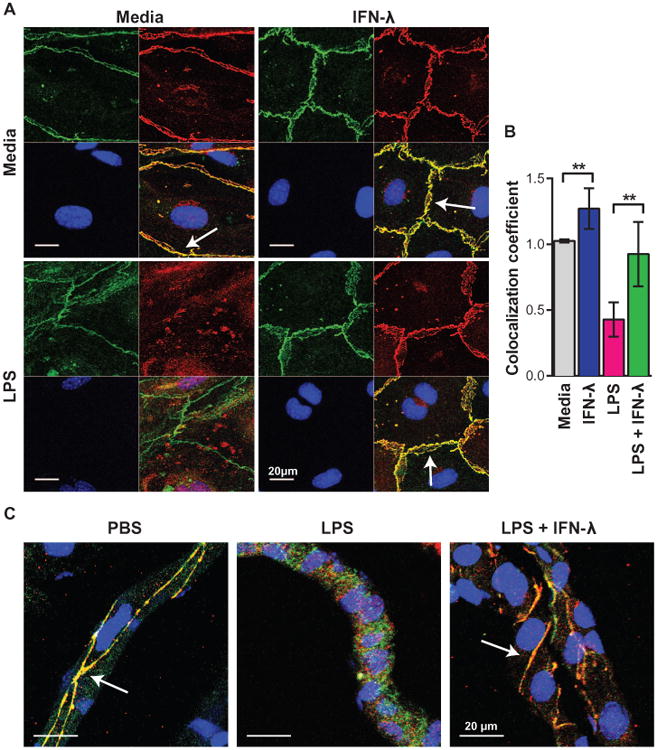
(A and B) WT BMECs were pretreated for 18 hours with LPS (100 ng/ml) and subsequently treated with murine IFN-λ3 (100 ng/ml) for 6 hours. (C) WT mice were treated with LPS (3 mg/kg via an intraperitoneal route), LPS and pegylated murine IFN-λ2 (25 μg via intravenous route), or phosphate-buffered saline (PBS) alone. (A to C) Cells and brain sections were costained for the cell junction proteins ZO-1 (green) and claudin-5 (red); nuclei are shown in blue. Images were taken by confocal microscopy at ×63 magnification (scale bars, 20 mm). Arrows indicate ZO-1 and claudin-5 colocalization at intact tight junctions. Results are representative of two independent experiments. (B) Colocalization of ZO-1 and claudin-5 staining was determined using ImageJ software and compared by t test. Media versus IFN-λ: **P = 0.0033. LPS versus LPS + IFN-λ: **P = 0.0014.
IFN-λ enhances BBB integrity in vivo
Given that Ifnlr1−/− mice displayed increased BBB permeability after WNV infection and IFN-λ decreased the barrier function of BMECs in vitro, we hypothesized that administration of IFN-λ might restrict BBB permeability in vivo. We treated wild-type mice with LPS to open the BBB and then administered pegylated murine IFN-λ2 or PBS. LPS treatment increased BBB permeability compared to PBS, but this effect was diminished in mice receiving IFN-λ2 (Fig. 8, A to C).
Fig. 8. IFN-λ enhances BBB tightness and restricts WNV neuroinvasion.

(A to C) Eight-week-old WT mice were treated with LPS, LPS and pegylated murine IFN-λ2 (25 mg via intravenous route), or PBS alone. BBB permeability was assessed 24 hours later by fluorescein or IgG permeation as described for Fig. 5. Symbols represent individual animals from two independent experiments. Values for LPS-treated mice were compared to mice receiving LPS + IFN-λ (t test). (A) Cortex: ****P < 0.0001, cerebellum: **P = 0.0096, spinal cord: **P = 0.0082. (C) Cortex: *P = 0.0348, cerebellum: *P = 0.0168. (D and E) Five-week-old WT mice were infected with 102 PFU of WNV via a subcutaneous route. On the day of infection and at days 2 and 4 afterward, 20 μg of pegylated murine IFN-λ2 protein (or PBS) was administered via an intravenous route. (D) Viral RNA in the plasma was measured on days 2 and 4 after infection. (E) Survival was monitored for 21 days after infection. n = 22 mice, *P = 0.0264 (log-rank test). (F and G) Nine-week-old WT mice were infected with 102 PFU of WNV via a subcutaneous route. At days 2, 3, and 4, 25 μg of pegylated murine IFN-λ2 protein (or PBS) was administered via an intravenous route. (F) Viral RNA in the plasma was measured on days 3,4, and5. (G) Viral burdeninthe CNS was measured by plaque assayatday 8. Symbols represent individual animals. Dotted lines represent the limit of sensitivity of the assay. ***P = 0.0009 (Mann-Whitney test).
We next tested whether administration of IFN-λ could restrict WNV neuroinvasion. Wild-type mice were inoculated subcutaneously with WNV, and pegylated murine IFN-λ2 was administered via an intravenous route on the day of infection as well as 2 and 4 days afterward. Consistent with data from Ifnlr1−/− mice (Fig. 3A), IFN-λ2 treatment did not exhibit a direct antiviral effect, because viremia remained unchanged (Fig. 8D). Nonetheless, IFN-λ 2–treated mice showed improved survival rates compared to PBS-treated controls (Fig. 8E). To determine whether the improved survival observed in IFN-λ2–treated mice correlated with reduced WNV neuroinvasion, we measured viral burden in the CNS. Wild-type mice were inoculated with WNV and treated with pegylated murine IFN-λ2 at days 2, 3, and 4 after infection. As expected, IFN-λ2 treatment did not reduce viremia (Fig. 8F), but at day 8 after infection, IFN-λ2–treated mice had lower virus titers in the cerebral cortex compared to control mice that received PBS (Fig. 8G). This effect was region-specific, because reductions in virus titer were not observed in the cerebellum or spinal cord.
Discussion
Previous studies in Ifnlr1−/− mice revealed a role for IFN-λ in controlling viral infection in epithelial tissues, although no inhibitory effect was observed with several viruses that disseminate more broadly (2, 4, 5, 7, 8, 26). These observations were consistent with a preferential epithelial cell expression pattern for IFNLR1 (3, 4) and tissue responsiveness to treatment with exogenous IFN-λ (3, 5–7). Although WNV replicates in many cell types in vitro, its main targets in vivo are myeloid cells and neurons (21). Because WNV is not reported to target epithelial cells other than keratinocytes in the skin (20), a virologic phenotype for WNV in the CNS of Ifnlr1−/− mice was unexpected. Our experiments show that IFN-λ signaling did not directly inhibit WNV infection in vitro or in vivo, but instead indicate that IFN-λ signaling enhances the integrity of the BBB, thereby limiting the neuroinvasive potential of WNV.
Although IFN-α/β directly stimulates expression of genes that inhibit WNV and other flaviviruses (27), in our experiments, IFN-λ failed to do so in several cell types in culture, even though the receptors were expressed and ISGs were induced. Although a previous study reported an antiviral effect of IFN-λ on WNV (9), those observations may not be comparable, because they were based on luciferase production by WNV replicons in human tumor cell lines, as opposed to our study, which measured replication of fully infectious virus in primary mouse cells and a mouse cell line.
Why did we not observe a direct inhibitory effect of IFN-λ in our experiments? On the basis of RNA-seq and qRT-PCR analyses, the magnitude and breadth of the ISG response to IFN-λ were reduced compared to IFN-β. Although previous studies have compared the transcriptional signatures induced by IFN-λ and IFN-α/β (17–19, 28), these studies were performed in human tumor cell lines. Our analysis compared the transcriptional profiles induced by IFN-λ and IFN-β in mouse DCs and may help to explain the results of other viral pathogenesis studies in Ifnlr1−/− mice. The ability of IFN-λ to induce ISG expression in a more targeted set of cells compared to IFN-α/β suggests a possible therapeutic application in which IFN-λ would provide a more focused antiviral or immunomodulatory effect with fewer side effects (26, 29).
We observed increased WNV infection in the brain and spinal cord of Ifnlr1−/− mice. Because our experiments failed to show a direct antiviral effect of IFNLR1 in neurons, we hypothesized that IFN-λ signaling might minimize WNV spread to the CNS by affecting BBB permeability. The following observations support a model in which IFN-λ signaling restricts the neuroinvasive potential of WNV by improving BBB function: (i) BBB permeability was greater in WNV-infected Ifnlr1−/− compared to wild-type mice; (ii) wild-type and Ifnlr1−/− mice had equivalent viral burden in peripheral tissues, so the increased infection in the brain was not due to antiviral effects of IFN-λ in the periphery; (iii) proinflammatory cytokine levels were similar in wild-type and Ifnlr1−/− mice and thus did not cause differential changes in BBB permeability; (iv) TEER was lower in WNV-infected Ifnlr1−/− BMECs compared to wild-type cells; (v) TEER was higher after treatment of wild-type BMECs or HCMEC/D3 cells with exogenous IFN-λ; (vi) IFN-λ treatment restricted transit of WNV across HCMEC/D3 monolayers; (vii) treatment of mice with IFN-λ minimized BBB permeability changes associated with LPS administration; and (viii) treatment of mice with IFN-λ decreased WNV infection in the brain without altering viremia, and this was associated with improved survival rates. We readily observed BBB tightening effects of IFN-λ even in the context of intact IFN-α/β responses. Circulating IFN-λ produced in response to infection may serve a protective role by limiting virus transit into the CNS and countering the effects of inflammatory cytokines that increase BBB permeability (for example, TNF-α, IL-1β, or IFN-γ) (14, 22, 23).
How does IFN-λ signaling affect BBB permeability and limit WNV neuroinvasion? Unlike some viruses, which infect peripheral neurons and then enter the CNS by retrograde trafficking, WNV likely enters the CNS via the bloodstream (12). Neuroinvasion by this hematogenous route could occur through trafficking of infected cells across the BBB, transcellular or paracellular transit of virus across the cells of the BBB, or direct infection of BBB cells (11, 12). Because we saw no effect of IFNLR1 expression on WNV replication in BMECs or on trafficking of immune cells into the CNS, our data suggest a model in which WNV virions transit through BBB cell junctions and IFN-λ signaling limits this. Indeed, IFN-λ treatment inhibited the accumulation of viral RNA on the basal side of an HCMEC/D3 monolayer within6 hours of exposure to WNV. The effect of IFN-λ occurred via a noncanonical STAT1- and protein synthesis–independent signaling pathway. IFN-λ signaling enhanced colocalization of the cell junction proteins ZO-1 and claudin-5 under conditions of inflammation in vitro and in vivo, which tightened the endothelial barrier. Because the rapid effect of IFN-λ preceded completion of the viral replication cycle (24), the phenotype was not due to the spread of infection through the cell culture, but rather to cellular responses induced rapidly in response to pathogen sensing. Indeed, previous studies demonstrated that active viral replication was not required for endothelial barrier tightening (14).
As mosquitoes inoculate WNV beneath the epidermis, the BBB may represent one of the first physical barriers encountered by WNV as it spreads in a vertebrate host. Modulation of physical barriers to infection is a previously undescribed antiviral mechanism for IFN-λ. Barrier tightening by IFN-λ signaling also may restrict dissemination of viruses that transit across epithelial surfaces, including the skin, lungs, and gastrointestinal tract. Because many viruses use cell junction proteins as entry receptors (30), some of the antiviral effects of IFN-λ observed in other viral systems (26) may be explained by relocalization of viral entry receptors.
Although our experiments demonstrated a BBB tightening effect of IFN-λ on both human and murine BMECs in culture, one limitation of these studies is that we did not analyze the effects of the different IFN-λ subtypes. Mice encode two functional IFN-λ genes (IFN-λ2 and IFN-λ3), and humans have four paralogs (IFN-λ1, 2, 3, and 4). Whereas IFN-λ2 and IFN-λ3 are nearly identical (1), IFN-λ1 and IFN-λ4 may have distinct properties; a polymorphic allele that enables IFN-λ4 production is associated with impaired hepatitis C virus clearance (31). Because of the limited types of recombinant proteins available, we were unable to assess whether IFN-λ subtypes vary in their BBB tightening activity.
In summary, our results suggest a new function of IFN-λ, whereby signaling through IFNLR1 rapidly modulates endothelial cell junctions without a requirement for STAT1 signaling or protein synthesis. This results in a tighter BBB, which restricts pathogen entry into the CNS parenchyma. In humans, multiple polymorphisms in the IFN-λ locus are associated with differential clearance of hepatitis B and C viruses (31), as well as the severity of herpesvirus infections (32, 33). Further analysis is warranted to define similar genetic linkages to neuroinvasive infections or CNS autoimmune diseases. Such information may provide new contexts for therapeutic interventions with IFN-λ.
Materials and Methods
Experimental design
We initiated this study to determine whether IFN-λ controls WNV pathogenesis. Our initial observation was that Ifnlr1−/− mice had increased viral burden in the CNS, and subsequent experiments evaluated why this occurred. We measured viral titers in tissues and replication in primary cells. We assessed immunologic parameters including antibody and cytokine concentrations in serum and leukocyte phenotypes in the spleen and brain. After excluding antiviral or immunomodulatory effects of IFN-λ, we considered whether increased neuroinvasion might be due to altered BBB permeability. We used an in vitro model of the BBB, in which resistance across a mouse or human endothelial cell monolayer corresponded to barrier tightness. Sample sizes and endpoints were selected on the basis of our experience with these systems. Mice were age- and sex-matched between groups. Investigators were not blinded when conducting or evaluating the experiments, and no randomization process was performed.
Viruses
WNV strain 3000.0259 was isolated in New York in 2000 and passaged once in C6/36 cells. Virus titers were measured by plaque assay on BHK21-15 cells (34).
Mouse experiments
C57BL/6 wild-type mice were obtained commercially (Jackson Laboratories) or bred in-house. Stat1−/− mice (35) were provided by H. Virgin (Washington University). Ifnlr1−/− mice (originally called IL-28RA−/−, obtained from Bristol-Myers Squibb) lack the entire Ifnlr1 coding sequence (2). Five- to 12-week-old wild-type and Ifnlr1−/− mice were used for in vivo studies, as indicated in the figure legends. For peripheral infection, 102 PFU of WNV in 50 ml was inoculated subcutaneously into the footpad. For intracranial infection, 101 PFU of WNV in 25 μl was injected into the right cerebral hemisphere. Experiments were approved and performed in accordance with Washington University Animal Studies Guidelines.
Cells
Macrophages, DCs, cortical neurons, BMECs, and astrocytes were generated from wild-type or Ifnlr1−/− mice as described (14, 23, 36). The human BMEC cell line HCMEC/D3 was cultured as described (23). The mouse keratinocyte cell line PDV was purchased (Cell Lines Service) and cultured in DMEM (Dulbecco's modified Eagle's medium) supplemented with 10% fetal bovine serum, L-glutamine, and non-essential amino acids.
IFN treatment and viral infection of cells Keratinocytes and DCs were treated with recombinant murine IFN-λ3 (0.1 to 1000 ng/ml) or IFN-β (0.1 or 1 ng/ml) (PBL Assay Science) for 6 hours and then infected with WNV at an MOI of 0.1. Supernatants were titered by focus-forming assay (34). Gene expression was analyzed 6 hours after IFN treatment. Total RNA was isolated using an RNeasy Mini Kit (Qiagen), and fluorogenic qRT-PCR was performed using One-Step RT-PCR Master Mix and a 7500 Fast Real-Time PCR System (Applied Biosystems). Gene expression was measured using the indicated TaqMan reagents (Integrated DNA Technologies) (table S3). Multistep virus growth analysis was performed after infection at an MOI of 0.01 for macrophages, astrocytes, and BMECs, or 0.001 for DCs and cortical neurons. Viral infection was measured by a focus-forming assay (34).
RNA-seq analysis
DCs were generated from wild-type mice and treated with serum-free medium (mock), IFN-β (20 ng/ml), or IFN-λ3 (10 ng/ml) for 6 hours. Total RNA was isolated using an RNeasy Kit (Qiagen). Samples were multiplexed and barcoded for sequencing on the Illumina HiSeq 2000. A minimum of 25 million (50–base pair pair-end) reads were generated per sample. Sequencing reads were mapped to the mouse genome [National Center for Biotechnology Information (NCBI) mm10] using Bowtie (2.10) and Tophat (2.010). Transcript assemblies and quantifications (FPKM) were calculated using the Cufflinks package (2.11). Genes with larger than threefold differences with IFN treatment (relative to mock) were retained, sorted, and displayed in a summarizing heatmap using the Matlab software package.
Tissue viral burden
To monitor viral spread in vivo, mice were infected with 102 PFU of WNV by subcutaneous inoculation and sacrificed at specified time points. To monitor viral replication directly in the CNS, mice were infected with 101 PFU of WNV by intracranial injection and sacrificed at day 3 or 5 after infection. After cardiac perfusion with PBS, organs were harvested and virus was titered by plaque assay (34). Viral RNA was isolated from serum and plasma using a Viral RNA Mini Kit (Qiagen) and from draining lymph nodes using an RNeasy Mini Kit (Qiagen). Viral load was measured by qRT-PCR with the indicated primer and probe sequences (table S3).
Antibody responses
WNV-specific IgM and IgG concentrations in serum were determined using an enzyme-linked immunosorbent assay (ELISA) against purified WNV E protein, as described (37).
Serum type I IFN activity
Concentrations of biologically active type I IFN were determined using a bioassay as described (38).
Cytokine analysis
Cytokine concentrations in serum were measured 3 and 5 days after infection using a Bio-Plex Pro 23-Plex Group I Cytokine Kit (Bio-Rad) and Bio-Plex 200 (Bio-Rad).
Cellular immune responses
Wild-type and Ifnlr1−/− mice were infected subcutaneously with 102 PFU of WNV, and at 8 days after infection, spleens and brains were harvested after cardiac perfusion with PBS (39). Cells were incubated with the following antibodies and processed by flow cytometry (LSR II, Becton Dickinson): CD3 (eBioscience, clone 145-2C11), CD4 (Bio-Legend, clone RM4-5), CD8a (BioLegend, clone 53-6.7), CD19 (Invitrogen), CD45 (BioLegend, clone 30-F11), CD11b (BioLegend, clone M1/70), CD11c (BioLegend, clone N418), granzyme B (Invitrogen), IFN-γ (BioLegend, clone XMG1.2), and TNF-α (BioLegend, clone MP6-XT22). IFN-γ and TNF-α staining was performed after ex vivo restimulation with a Db-restricted NS4B immunodominant peptide using 1 μM of peptide and brefeldin A (5 μg/ml) (Sigma). Flow cytometry data were analyzed using FlowJo software (Tree Star).
BBB permeability measurements and confocal microscopy Eight-week-old mice were infected with 102 PFU of WNV or diluent (mock), and BBB permeability was assessed after 4 days. In other experiments, mice were treated with LPS (List Biological Laboratories, 3 mg/kg via intraperitoneal injection) and pegylated murine IFN-λ2 (Bristol-Myers Squibb, 25 μg via intravenous injection), and BBB permeability was assessed 24 hours later. Sodium fluorescein dye (100 mg/ml) was administered via intraperitoneal injection in 100 ml. After 45 min, blood was collected by cardiac puncture into EDTA-coated tubes. Mice were perfused and CNS tissues were harvested, homogenized into PBS, clarified by centrifugation, precipitated in 1% trichloroacetic acid, and neutralized with borate buffer. Fluorescence emission at 485 and 528 nm was determined using the microplate reader Synergy H1 and Gen5 software (BioTek Instruments Inc.). Fluorescein concentration was calculated from a standard curve, and tissue fluorescence values were normalized to the plasma fluorescence values from the same mouse.
Polarized BMECs on chamber slides were treated first with LPS (100 ng/ml) for 18 hours and then with murine IFN-λ3 (100 ng/ml) for 6 hours. Cells were fixed in methanol and blocked with 10% goat serum. Mice were perfused with PBS and then 4% paraformaldehyde. Cryoprotected brains were embedded in O.C.T. medium (Tissue-Tek), and 8-mm frozen sections were mounted on slides. Cells and sections were stained with primary antibodies against the cell junction proteins ZO-1 (rat monoclonal R40.76, Millipore) and claudin-5 (rabbit polyclonal, Invitrogen) followed by Alexa Fluor–conjugated secondary antibodies. Colocalization of ZO-1 and claudin-5 staining was calculated using ImageJ software. Endogenous mouse IgG was detected in brain sections using an Alexa Fluor 488 anti-mouse IgG antibody. Nuclei were stained with TO-PRO-3. The green channel of individual images was converted to 8-bit grayscale format, and mean gray values (sum of gray values in all pixels per total number of pixels) were measured using ImageJ software.
Transwell cultures and TEER measurements BMECs and HCMEC/D3 cells were grown until fully polarized in Transwell cultures (23). BMECs were grown above astrocyte cultures, whereas HCMEC/D3 cells were grown without astrocytes. TEER was measured via chopstick electrode with an EVOM volt meter (World Precision Instruments). Resistance values are reported as W/cm2, with the resistance value for Transwell inserts with no cells subtracted as background. TEER measurements were collected at 6 hours after infection with WNV, an MOI of 0.01, or treatment with murine IFN-λ3 (10 or 100 ng/ml), murine or human IFN-β (10 ng/ml), or pegylated human IFN-λ1 (100 ng/ml) (Bristol-Myers Squibb); mock wells were treated with culture medium. To block IFN-α/β signaling, BMEC cultures were treated with the blocking monoclonal antibody MAR1-5A3 (25 μg/ml) (25) for 1 hour before infection. A nonbinding monoclonal antibody (GIR-208) was used as an isotype control (25). To block de novo protein synthesis, BMEC cultures were pretreated with cycloheximide (20 μg/ml) for 18 hours before treatment with IFN-β or IFN-λ3 or infection with WNV. To measure virus transit across the endothelial barrier, HCMEC/D3 cells in Transwells were treated first with LPS (100 ng/ml) for 18 hours, and then human IFN-β or pegylated human IFN-λ1 (100 ng/ml) for 6 hours. WNV was added to the upper chamber of the Transwell at an MOI of 0.01. After 6 hours, virus in the lower chamber was measured by qRT-PCR.
Statistical analysis
Tissue titers and immunophenotyping experiments were analyzed by the Mann-Whitney test, whereas parametric tests (t test and two-way ANOVA) were used in other experiments. Survival was analyzed by the log-rank test.
Supplementary Material
Fig. S1. Serum antibody responses in wild-type and Ifnlr1−/− mice.
Fig. S2. Serum type I IFN activity in wild-type and Ifnlr1−/− mice.
Fig. S3. ISG induction in BMECs.
Table S1. Transcriptional profiling of DCs treated with IFN-β or IFN-λ.
Table S2. Serum cytokines after WNV infection.
Table S3. Primer and probe sequences used for qRT-PCR.
Primary data tables. (Excel)
Acknowledgments
We thank J. Brien for 18S qRT-PCR reagents and D. Dorsey for technical assistance. Funding: This work was supported by NIH grants U19 AI083019 (M.S.D., R.S.K., and M.G.), PCTAS AI083019-02S1 and T32-AI007172 (H.M.L.), R01 AI074973 (M.S.D. and M.G.), and R01 NS052632 (R.S.K.). B.P.D. was supported by NSF (DGE-1143954) and NIH (F31-NS07866-01) Fellowships.
Footnotes
Author contributions: Study concept and design: H.M.L., B.P.D., R.S.K., and M.S.D. Data acquisition: H.M.L. (qRT-PCR, viral tissue titers, primary cell infections, serum antibody ELISA, BBB permeability measurements, and in vivo treatment with IFN-λ), B.P.D. (endothelial cell culture, TEER measurements, BBB permeability measurements, and confocal microscopy), A.K.P. (immunophenotyping), A.C.H. (RNA-seq), and S.C.V. (viral titers and cytokine assays). Analysis and interpretation of data: H.M.L., B.P.D., A.K.P., A.C.H., M.G., R.S.K., and M.S.D. Provided critical reagents: S.E.D. Initial drafting of the manuscript: H.M.L. and M.S.D. Critical revision of the manuscript: H.M.L., B.P.D., M.G., R.S.K., and M.S.D.
Competing interests: S.E.D. is an employee of ZymoGenetics.
Data and materials availability: RNA-seq data are deposited in the GEO (Gene Expression Omnibus) archive, accession number GSE64735. Ifnlr1−/− mice and pegylated IFN-λ proteins can be obtained from Bristol-Myers Squibb with a material transfer agreement.
References and Notes
- 1.Donnelly RP, Kotenko SV. Interferon-lambda: A new addition to an old family. J Interferon Cytokine Res. 2010;30:555–564. doi: 10.1089/jir.2010.0078. [DOI] [PMC free article] [PubMed] [Google Scholar]
- 2.Ank N, Iversen MB, Bartholdy C, Staeheli P, Hartmann R, Jensen UB, Dagnaes-Hansen F, Thomsen AR, Chen Z, Haugen H, Klucher K, Paludan SR. An important role for type III interferon (IFN-λ/IL-28) in TLR-induced antiviral activity. J Immunol. 2008;180:2474–2485. doi: 10.4049/jimmunol.180.4.2474. [DOI] [PubMed] [Google Scholar]
- 3.Sommereyns C, Paul S, Staeheli P, Michiels T. IFN-lambda (IFN-λ) is expressed in a tissue-dependent fashion and primarily acts on epithelial cells in vivo. PLOS Pathog. 2008;4:e1000017. doi: 10.1371/journal.ppat.1000017. [DOI] [PMC free article] [PubMed] [Google Scholar]
- 4.Mordstein M, Neugebauer E, Ditt V, Jessen B, Rieger T, Falcone V, Sorgeloos F, Ehl S, Mayer D, Kochs G, Schwemmle M, Günther S, Drosten C, Michiels T, Staeheli P. Lambda interferon renders epithelial cells of the respiratory and gastrointestinal tracts resistant to viral infections. J Virol. 2010;84:5670–5677. doi: 10.1128/JVI.00272-10. [DOI] [PMC free article] [PubMed] [Google Scholar]
- 5.Pott J, Mahlakõiv T, Mordstein M, Duerr CU, Michiels T, Stockinger S, Staeheli P, Hornef MW. IFN-λ determines the intestinal epithelial antiviral host defense. Proc Natl Acad Sci USA. 2011;108:7944–7949. doi: 10.1073/pnas.1100552108. [DOI] [PMC free article] [PubMed] [Google Scholar]
- 6.Ank N, West H, Bartholdy C, Eriksson K, Thomsen AR, Paludan SR. Lambda interferon (IFN-λ), a type III IFN, is induced by viruses and IFNs and displays potent antiviral activity against select virus infections in vivo. J Virol. 2006;80:4501–4509. doi: 10.1128/JVI.80.9.4501-4509.2006. [DOI] [PMC free article] [PubMed] [Google Scholar]
- 7.Mordstein M, Kochs G, Dumoutier L, Renauld JC, Paludan SR, Klucher K, Staeheli P. Interferon-λ contributes to innate immunity of mice against influenza A virus but not against hepatotropic viruses. PLOS Pathog. 2008;4:e1000151. doi: 10.1371/journal.ppat.1000151. [DOI] [PMC free article] [PubMed] [Google Scholar]
- 8.Nice TJ, Baldridge MT, McCune BT, Norman JM, Lazear HM, Artyomov M, Diamond MS, Virgin HW. Interferon-λ cures persistent murine norovirus infection in the absence of adaptive immunity. Science. 2015;347:269–273. doi: 10.1126/science.1258100. [DOI] [PMC free article] [PubMed] [Google Scholar]
- 9.Ma D, Jiang D, Qing M, Weidner JM, Qu X, Guo H, Chang J, Gu B, Shi PY, Block TM, Guo JT. Antiviral effect of interferon lambda against West Nile virus. Antiviral Res. 2009;83:53–60. doi: 10.1016/j.antiviral.2009.03.006. [DOI] [PMC free article] [PubMed] [Google Scholar]
- 10.Sejvar JJ. Clinical manifestations and outcomes of West Nile virus infection. Viruses. 2014;6:606–623. doi: 10.3390/v6020606. [DOI] [PMC free article] [PubMed] [Google Scholar]
- 11.Suen WW, Prow NA, Hall RA, Bielefeldt-Ohmann H. Mechanism of West Nile virus neuroinvasion: A critical appraisal. Viruses. 2014;6:2796–2825. doi: 10.3390/v6072796. [DOI] [PMC free article] [PubMed] [Google Scholar]
- 12.Koyuncu OO, Hogue IB, Enquist LW. Virus infections in the nervous system. Cell Host Microbe. 2013;13:379–393. doi: 10.1016/j.chom.2013.03.010. [DOI] [PMC free article] [PubMed] [Google Scholar]
- 13.Lustig S, Danenberg HD, Kafri Y, Kobiler D, Ben-Nathan D. Viral neuroinvasion and encephalitis induced by lipopolysaccharide and its mediators. J Exp Med. 1992;176:707–712. doi: 10.1084/jem.176.3.707. [DOI] [PMC free article] [PubMed] [Google Scholar]
- 14.Daniels BP, Holman DW, Cruz-Orengo L, Jujjavarapu H, Durrant DM, Klein RS. Viral pathogen-associated molecular patterns regulate blood brain barrier integrity via competing innate cytokine signals. mBio. 2014;5:e01476–14. doi: 10.1128/mBio.01476-14. [DOI] [PMC free article] [PubMed] [Google Scholar]
- 15.Kraus J, Voigt K, Schuller AM, Scholz M, Kim KS, Schilling M, Schäbitz WR, Oschmann P, Engelhardt B. Interferon-β stabilizes barrier characteristics of the blood–brain barrier in four different species in vitro. Mult Scler. 2008;14:843–852. doi: 10.1177/1352458508088940. [DOI] [PubMed] [Google Scholar]
- 16.Markowitz CE. Interferon-beta: Mechanism of action and dosing issues. Neurology. 2007;68:S8–S11. doi: 10.1212/01.wnl.0000277703.74115.d2. [DOI] [PubMed] [Google Scholar]
- 17.Doyle SE, Schreckhise H, Khuu-Duong K, Henderson K, Rosler R, Storey H, Yao L, Liu H, Barahmand-pour F, Sivakumar P, Chan C, Birks C, Foster D, Clegg CH, Wietzke-Braun P, Mihm S, Klucher KM. Interleukin-29 uses a type 1 interferon-like program to promote antiviral responses in human hepatocytes. Hepatology. 2006;44:896–906. doi: 10.1002/hep.21312. [DOI] [PubMed] [Google Scholar]
- 18.Zhou Z, Hamming OJ, Ank N, Paludan SR, Nielsen AL, Hartmann R. Type III interferon (IFN) induces a type I IFN-like response in a restricted subset of cells through signaling pathways involving both the Jak-STAT pathway and the mitogen-activated protein kinases. J Virol. 2007;81:7749–7758. doi: 10.1128/JVI.02438-06. [DOI] [PMC free article] [PubMed] [Google Scholar]
- 19.Marcello T, Grakoui A, Barba-Spaeth G, Machlin ES, Kotenko SV, MacDonald MR, Rice CM. Interferons α and λ inhibit hepatitis C virus replication with distinct signal transduction and gene regulation kinetics. Gastroenterology. 2006;131:1887–1898. doi: 10.1053/j.gastro.2006.09.052. [DOI] [PubMed] [Google Scholar]
- 20.Lim PY, Behr MJ, Chadwick CM, Shi PY, Bernard KA. Keratinocytes are cell targets of West Nile virus in vivo. J Virol. 2011;85:5197–5201. doi: 10.1128/JVI.02692-10. [DOI] [PMC free article] [PubMed] [Google Scholar]
- 21.Suthar MS, Diamond MS, Gale M., Jr West Nile virus infection and immunity. Nat Rev Microbiol. 2013;11:115–128. doi: 10.1038/nrmicro2950. [DOI] [PubMed] [Google Scholar]
- 22.Wang T, Town T, Alexopoulou L, Anderson JF, Fikrig E, Flavell RA. Toll-like receptor 3 mediates West Nile virus entry into the brain causing lethal encephalitis. Nat Med. 2004;10:1366–1373. doi: 10.1038/nm1140. [DOI] [PubMed] [Google Scholar]
- 23.Daniels BP, Cruz-Orengo L, Pasieka TJ, Couraud PO, Romero IA, Weksler B, Cooper JA, Doering TL, Klein RS. Immortalized human cerebral microvascular endothelial cells maintain the properties of primary cells in an in vitro model of immune migration across the blood brain barrier. J Neurosci Methods. 2013;212:173–179. doi: 10.1016/j.jneumeth.2012.10.001. [DOI] [PMC free article] [PubMed] [Google Scholar]
- 24.Brinton MA. Replication cycle and molecular biology of the West Nile virus. Viruses. 2014;6:13–53. doi: 10.3390/v6010013. [DOI] [PMC free article] [PubMed] [Google Scholar]
- 25.Sheehan KC, Lai KS, Dunn GP, Bruce AT, Diamond MS, Heutel JD, Dungo-Arthur C, Carrero JA, White JM, Hertzog PJ, Schreiber RD. Blocking monoclonal antibodies specific for mouse IFN-α/β receptor subunit 1 (IFNAR-1) from mice immunized by in vivo hydrodynamic transfection. J Interferon Cytokine Res. 2006;26:804–819. doi: 10.1089/jir.2006.26.804. [DOI] [PubMed] [Google Scholar]
- 26.Hermant P, Michiels T. Interferon-λ in the context of viral infections: Production, response and therapeutic implications. J Innate Immun. 2014;6:563–574. doi: 10.1159/000360084. [DOI] [PMC free article] [PubMed] [Google Scholar]
- 27.Schoggins JW. Interferon-stimulated genes: Roles in viral pathogenesis. Curr Opin Virol. 2014;6:40–46. doi: 10.1016/j.coviro.2014.03.006. [DOI] [PMC free article] [PubMed] [Google Scholar]
- 28.Shindo H, Maekawa S, Komase K, Miura M, Kadokura M, Sueki R, Komatsu N, Shindo K, Amemiya F, Nakayama Y, Inoue T, Sakamoto M, Yamashita A, Moriishi K, Enomoto N. IL-28B (IFN-λ3) and IFN-α synergistically inhibit HCV replication. J Viral Hepat. 2013;20:281–289. doi: 10.1111/j.1365-2893.2012.01649.x. [DOI] [PubMed] [Google Scholar]
- 29.Muir AJ, Arora S, Everson G, Flisiak R, George J, Ghalib R, Gordon SC, Gray T, Greenbloom S, Hassanein T, Hillson J, Horga MA, Jacobson IM, Jeffers L, Kowdley KV, Lawitz E, Lueth S, Rodriguez-Torres M, Rustgi V, Shemanski L, Shiffman ML, Srinivasan S, Vargas HE, Vierling JM, Xu D, Lopez-Talavera JC, Zeuzem S EMERGE Study Group. A randomized phase 2b study of peginterferon lambda-1a for the treatment of chronic HCV infection. J Hepatol. 2014;61:1238–1246. doi: 10.1016/j.jhep.2014.07.022. [DOI] [PubMed] [Google Scholar]
- 30.Grove J, Marsh M. The cell biology of receptor-mediated virus entry. J Cell Biol. 2011;195:1071–1082. doi: 10.1083/jcb.201108131. [DOI] [PMC free article] [PubMed] [Google Scholar]
- 31.O'Brien TR, Prokunina-Olsson L, Donnelly RP. IFN-λ4: The paradoxical new member of the interferon lambda family. J Interferon Cytokine Res. 2014;34:829–838. doi: 10.1089/jir.2013.0136. [DOI] [PMC free article] [PubMed] [Google Scholar]
- 32.Griffiths SJ, Koegl M, Boutell C, Zenner HL, Crump CM, Pica F, Gonzalez O, Friedel CC, Barry G, Martin K, Craigon MH, Chen R, Kaza LN, Fossum E, Fazakerley JK, Efstathiou S, Volpi A, Zimmer R, Ghazal P, Haas J. A systematic analysis of host factors reveals a Med23-Interferon-λ regulatory axis against herpes simplex virus type 1 replication. PLOS Pathog. 2013;9:e1003514. doi: 10.1371/journal.ppat.1003514. [DOI] [PMC free article] [PubMed] [Google Scholar]
- 33.Egli A, Levin A, Santer DM, Joyce M, O'Shea D, Thomas B, Lisboa LF, Barakat K, Bhat R, Fischer KP, Houghton M, Tyrrell DL, Kumar D, Humar A. Immunomodulatory function of interleukin 28B during primary infection with cytomegalovirus. J Infect Dis. 2014;210:717–727. doi: 10.1093/infdis/jiu144. [DOI] [PubMed] [Google Scholar]
- 34.Brien JD, Lazear HM, Diamond MS. Propagation, quantification, detection, and storage of West Nile virus. Curr Protoc Microbiol. 2013;31:15D.3.1–15D.3.18. doi: 10.1002/9780471729259.mc15d03s31. [DOI] [PubMed] [Google Scholar]
- 35.Durbin JE, Hackenmiller R, Simon MC, Levy DE. Targeted disruption of the mouse Stat1 gene results in compromised innate immunity to viral disease. Cell. 1996;84:443–450. doi: 10.1016/s0092-8674(00)81289-1. [DOI] [PubMed] [Google Scholar]
- 36.Samuel MA, Whitby K, Keller BC, Marri A, Barchet W, Williams BR, Silverman RH, Gale M, Jr, Diamond MS. PKR and RNase L contribute to protection against lethal West Nile virus infection by controlling early viral spread in the periphery and replication in neurons. J Virol. 2006;80:7009–7019. doi: 10.1128/JVI.00489-06. [DOI] [PMC free article] [PubMed] [Google Scholar]
- 37.Mehlhop E, Diamond MS. Protective immune responses against West Nile virus are primed by distinct complement activation pathways. J Exp Med. 2006;203:1371–1381. doi: 10.1084/jem.20052388. [DOI] [PMC free article] [PubMed] [Google Scholar]
- 38.Daffis S, Samuel MA, Keller BC, Gale M, Jr, Diamond MS. Cell-specific IRF-3 responses protect against West Nile virus infection by interferon-dependent and -independent mechanisms. PLOS Pathog. 2007;3:e106. doi: 10.1371/journal.ppat.0030106. [DOI] [PMC free article] [PubMed] [Google Scholar]
- 39.Lazear HM, Pinto AK, Ramos HJ, Vick SC, Shrestha B, Suthar MS, Gale M, Jr, Diamond MS. Pattern recognition receptor MDA5 modulates CD8+ T cell-dependent clearance of West Nile virus from the central nervous system. J Virol. 2013;87:11401–11415. doi: 10.1128/JVI.01403-13. [DOI] [PMC free article] [PubMed] [Google Scholar]
Associated Data
This section collects any data citations, data availability statements, or supplementary materials included in this article.
Supplementary Materials
Fig. S1. Serum antibody responses in wild-type and Ifnlr1−/− mice.
Fig. S2. Serum type I IFN activity in wild-type and Ifnlr1−/− mice.
Fig. S3. ISG induction in BMECs.
Table S1. Transcriptional profiling of DCs treated with IFN-β or IFN-λ.
Table S2. Serum cytokines after WNV infection.
Table S3. Primer and probe sequences used for qRT-PCR.
Primary data tables. (Excel)