
Fig 3.
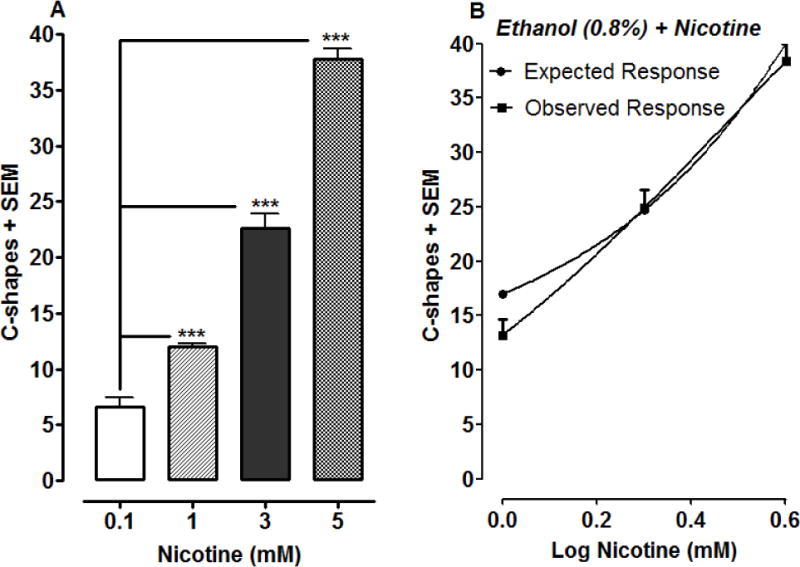
A combination of ethanol and nicotine displays simple additivity against C-shape movements. 3A) Effects of nicotine on C-shape movements over a 5-min exposure interval. ***P < 0.001 compared to lowest concentration (0.1 mM) of nicotine. N=8 planarians/group. 3B) A fixed concentration (0.8%) of ethanol was administered with increasing concentrations of nicotine (1, 2, 4 mM). C-shape movements were quantified over a 5-min exposure interval and data were presented as mean C-shapes + SEM versus log nicotine dose. N=8 planarians/group. A Student’s t-test comparing the expected and observed responses revealed simple additivity for the interaction (P > 0.05).