

Abstract
Head and neck squamous cell carcinoma persists as one of the most common and deadly malignancies, with early detection and effective treatment still posing formidable challenges. To expand our currently sparse knowledge of the noncoding alterations involved in the disease and identify potential biomarkers and therapeutic targets, we globally profiled the dysregulation of small nucleolar and long noncoding RNAs in head and neck tumors. Using next-generation RNA-sequencing data from 40 pairs of tumor and matched normal tissues, we found 2808 long noncoding RNA (lncRNA) transcripts significantly differentially expressed by a fold change magnitude ≥2. Meanwhile, RNA-sequencing analysis of 31 tumor-normal pairs yielded 33 significantly dysregulated small nucleolar RNAs (snoRNA). In particular, we identified two dramatically down-regulated lncRNAs and one down-regulated snoRNA whose expression levels correlated significantly with overall patient survival, suggesting their functional significance and clinical relevance in head and neck cancer pathogenesis. We confirmed the dysregulation of these noncoding RNAs in head and neck cancer cell lines derived from different anatomic sites, and determined that ectopic expression of the two lncRNAs inhibited key EMT and stem cell genes and reduced cellular proliferation and migration. As a whole, noncoding RNAs are pervasively dysregulated in head and squamous cell carcinoma. The precise molecular roles of the three transcripts identified warrants further characterization, but our data suggest that they are likely to play substantial roles in head and neck cancer pathogenesis and are significantly associated with patient survival.
Keywords: HNSCC, long noncoding RNAs, RNA-sequencing, small nucleolar RNAs
INTRODUCTION
Head and neck squamous cell carcinoma (HNSCC) is the sixth leading cancer by incidence worldwide (Ferlay et al. 2010). Despite advances in treatment and increased knowledge about underlying genetic and environmental risk factors behind the disease, the 5-yr survival rate for HNSCC has persisted at 50% for more than three decades, with most cases remaining undiagnosed until metastasis (Nemunaitis and O'Brien 2002). A deeper understanding of the drivers and mechanisms behind HNSCC pathogenesis, as well as continued identification of candidate biomarkers and prognostic factors, is necessary to inform better diagnostic and therapeutic strategies.
While a number of gene mutations and their impacts on signaling pathways have been implicated in HNSCC onset and progression, there still remains much to be elucidated about the role that perturbations in the noncoding genome may play in these processes. Noncoding RNAs (ncRNAs) have been increasingly viewed as key players in human disease, with recent studies establishing their involvement in gene regulation, cell differentiation, self-renewal, and cell proliferation, among other pivotal functions, as well as their dysregulation in many cancers (Esteller 2011). Existing studies of their roles in HNSCC, however, have primarily focused on profiling microRNAs (Avissar et al. 2009; Childs et al. 2009; Ramdas et al. 2009; Hui et al. 2010), a class of small (∼22 nt) and relatively well-documented ncRNAs that comprise but a fraction of the noncoding transcriptome (Esteller 2011).
In contrast, long noncoding RNAs (lncRNAs), transcripts exceeding 200 nt in length, are encoded by a large proportion of the so-called “dark matter” of the human genome (Mercer et al. 2009; Kapranov et al. 2010). While a vast majority of lncRNAs remain functionally uncharacterized, the few that have been linked to a range of biological processes, including chromatin modification, regulation of transcription factors, mRNA processing and degradation, and even cell–cell signaling (Geisler and Coller 2013). Furthermore, studies suggest that their expression patterns are even more tissue-specific than those of protein-coding genes (Cabili et al. 2011) and that they are involved in pivotal tumor suppressive and oncogenic pathways. Increased expression of the lncRNA HOTAIR in primary breast tumors, for instance, was shown to strongly correlate with metastasis and death (Gupta et al. 2010), with similar up-regulation and prognostic significance observed in a number of other cancers, including nonsmall cell lung cancer and pancreatic cancer (Zhang et al. 2014). Similarly, overexpression of the lncRNA MALAT-1 has been linked to hepatocellular carcinoma and metastasis in small-cell lung cancer (Lin et al. 2007). Several studies of these well-characterized lncRNAs in HNSCC have revealed promising associations as well, with HOTAIR, MEG-3, MALAT-1, and NEAT-1 each exhibiting dysregulation and/or prognostic significance in several subtypes of HNSCC (Feng et al. 2012; Li et al. 2013; Tang et al. 2013; Fang et al. 2014; Yang and Deng 2014). Additionally, GAS5 (growth arrest specific transcript 5) has been linked to low expression and poor prognosis in HNSCC (Gee et al. 2011), and most recently, Shen et al. (2014) reported the dysregulation of two relatively uncharacterized transcripts, AC026166.2 and RP11-169D4.1, in LSCCs using microarray and qRT-PCR expression profiling. However, aside from these investigations involving mostly known, cancer-associated lncRNAs, the dysregulation and functional significance of lncRNAs in HNSCC has remained largely uncharacterized.
Similarly, small nucleolar RNAs (snoRNAs), which are components of small nucleolar ribonucleoproteins (snoRNPs) and intermediate in length (60–300 nt) (Esteller 2011; Williams and Farzaneh 2012), are also emerging as potential players in the development of cancer. As facilitators of the methylation and pseudouridylation of rRNA and other post-transcriptional modifications involved in ribosome production (Esteller 2011), snoRNAs were long considered to be merely housekeeping RNAs. Studies, however, have increasingly implicated snoRNA dysregulation as a potential determinant of cell fate and a driver of oncogenesis. Drastic down-regulation of human S5 snoRNA genes was observed between meningiomas and normal brain tissue (Chang et al. 2002), while a panel of six snoRNAs was found to be overexpressed in nonsmall cell lung cancer (Liao et al. 2010). More recent studies have revealed that a germline homozygous deletion of 2 bp in the snoRNA U50 gene was significantly linked to prostate cancer development, and that a heterozygous genotype for the same deletion, both somatically and in germline, was frequently observed in breast cancers (Dong et al. 2009). The identification of dysregulated snoRNAs in multiple cancer types thus far suggests that promising associations between snoRNAs and HNSCC pathogenesis may exist as well.
In our study, we aimed to profile the global expression patterns and dysregulation of lncRNAs and snoRNAs in HNSCC by utilizing RNA-sequencing (RNA-seq), a next-generation deep sequencing technology that captures the transcriptional landscape of the human genome through reverse transcription of isolated RNA and high-throughput sequencing of the resulting cDNA. By comparing the RNA-seq profiles of lncRNA and snoRNA expression levels in 40 primary HNSCC tumors with those of their matched normal counterparts, we generated a panel of differentially expressed ncRNAs and further characterized selected candidates to gauge the extent of their dysregulation and their functional relevance in HNSCC.
RESULTS
Analysis of primary tumor and matched normal RNA-seq data sets uncovers widespread dysregulation of lncRNAs and snoRNAs in HNSCC
To identify HNSCC-associated lncRNAs, we searched for alterations in their expression using RNA-seq data from 40 patients in The Cancer Genome Atlas (TCGA) repository (Table 1A; Supplemental Table S6a). For each of these patients, raw sequence data of both the primary HNSCC tumor and matched adjacent normal tissue were available. To profile lncRNA expression levels, we mapped each RNA-seq library to a reference annotation of 32,108 human lncRNAs. Using the R/Bioconductor package edgeR, we filtered and normalized the read count data and compared lncRNA expression, in the form of counts per million (cpm), between HNSCC and normal samples. From the 12,407 consistently detected lncRNA transcripts and isoforms, a total of 7120 differentially expressed lncRNAs (FDR <0.05) were identified between the HNSCC and adjacent normal tissues (Supplemental Fig. S1). Among these, 2808 transcripts were differentially expressed by at least ±twofold (FDR <0.05), ranging from lnc-LCE5A-1, with predicted down-regulation of ∼112-fold in HNSCC, to lnc-BCHE with predicted up-regulation of ∼58-fold in HNSCC. Further filtering yielded 222 lncRNA transcripts differentially expressed by at least ±eightfold (FDR <0.0001) (Fig. 1A,B; Supplemental Table S1).
TABLE 1.
Summary of patient demographics and clinicopathological characteristics; (A) clinical data for patients used in the lncRNA expression profiling and analysis, (B) clinical data for patients used in the snoRNA differential expression analysis
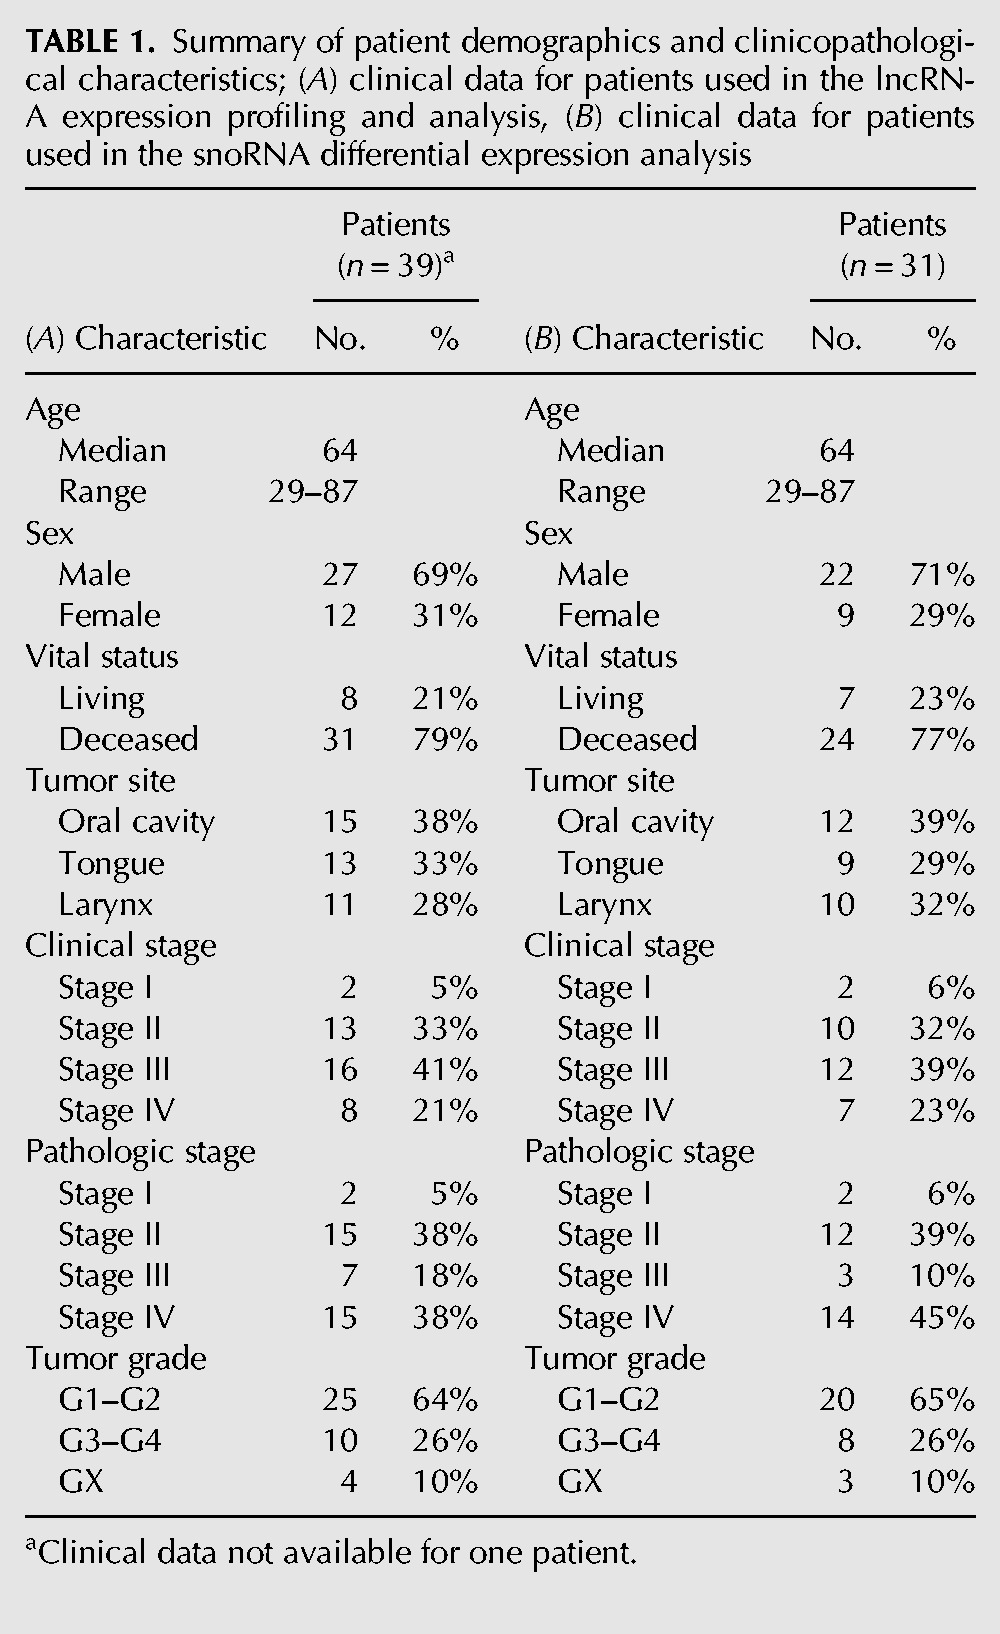
FIGURE 1.
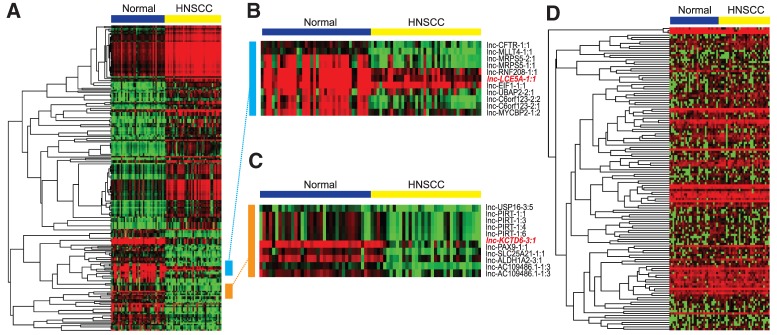
Heatmaps of differentially expressed lncRNAs and snoRNAs in HNSCC. (A) Heatmap depicting normalized lncRNA expression levels (in the form of cpm) across normal and HNSCC tissues in our 40-patient cohort. Only the 222 lncRNAs differentially expressed by a magnitude of at least eightfold in HNSCC with FDRs <0.0001 are shown (Supplemental Table S1). (B,C) Higher resolution images of blue- and orange-labeled regions show, among other lncRNAs, marked down-regulation of lnc-LCE5A-1 and lnc-KCTD6-3 in HNSCC tumors. (D) Heatmap depicting all 135 snoRNAs consistently detected in our cohort of 31 HNSCC and normal tissue pairs. 33 of these snoRNAs were determined to be significantly dysregulated in HNSCC (Supplemental Table S2).
To explore the dysregulation of snoRNAs in HNSCC, we obtained the expression profiles of 325 snoRNAs in 31 HNSCC samples and their matched adjacent normal tissues from The Cancer Genome Atlas (TCGA) (Table 1B; Supplemental Table S6b). We normalized the snoRNA read count data in edgeR and compared snoRNA expression, in the form of cpm, between the HNSCC and normal samples. In total, 33 differentially expressed snoRNAs (FDR <0.05) were identified between the HNSCC and matched normal tissues, ranging from SNORD116-20 with predicted down-regulation of more than fourfold in HNSCC to SNORD60 with predicted up-regulation of about threefold in HNSCC (Fig. 1C; Supplemental Table S2).
Known, cancer-associated lncRNAs in HNSCC and stratification of lncRNA dysregulation by HNSCC anatomic site
GAS5 (growth arrest specific transcript 5), a lncRNA down-regulated in breast cancers and shown to induce apoptosis (Mourtada-Maarabouni et al. 2009), was recently implicated in HNSCCs as well (Gee et al. 2011). While we found GAS5 down-regulation in HNSCC to be statistically significant, with 29 splice isoforms of the lncRNA appearing in our original panel of 7120 differentially expressed lncRNA transcripts, the difference in GAS5 expression levels between HNSCC and normal tissues was determined to be less than twofold with P > 0.0001, so we did not identify GAS5 as a candidate for further study (Supplemental Table S3). MEG-3 (maternally expressed gene 3), a tumor suppressor lncRNA implicated in p53 activation (Zhang et al. 2010), was also down-regulated in HNSCCs by less than twofold, P > 0.0001 (Supplemental Table S3). We observed no significant dysregulation of many other lncRNAs previously linked to cancers, including HOTAIR, MALAT-1, ANRIL, NEAT-1, and UCA-1, in our overall cohort.
To investigate possible heterogeneity in lncRNA expression among different HNSCC tumor sites, we stratified our patients by anatomic subdivision (Table 1A) and performed tumor versus paired normal differential expression analysis on each subcohort using edgeR. Among our 15 patients presenting oral squamous cell carcinoma, 777 lncRNA transcripts were differentially expressed by at least ±fourfold (P < 0.0001). Notably, we found that HOTAIR was significantly up-regulated and numerous splice isoforms of MEG-3 and GAS5 were down-regulated in primary tumors (Supplemental Table S4a). Meanwhile, analysis of the 13 tongue squamous cell carcinoma pairs yielded 1020 lncRNA transcripts dysregulated by greater than or equal to fourfold in magnitude (P < 0.0001), with down-regulation observed in GAS5 (Supplemental Table S4b). Finally, in our 11 tumor-normal laryngeal squamous cell carcinoma (LSCC) paired samples, we found 657 lncRNA transcripts deregulated by at least ±fourfold. While none of the aforementioned well-documented lncRNAs were determined to be dysregulated in LSCC, we did observe slight down-regulation of RP11-169D4.1 (Supplemental Table S4c), a lncRNA recently associated with survival in LSCC patients (Shen et al. 2014).
Univariate and multivariate analyses reveal 2 lncRNAs and 1 snoRNA significantly associated with HNSCC patient outcome
We next examined the relationship between the expression levels of selected ncRNAs in HNSCC patients and overall survival in order to determine which lncRNAs and snoRNAs could potentially be of functional significance in HNSCC pathogenesis. We measured the expression levels of the 30 most significantly dysregulated lncRNAs in an additional 45 randomly selected HNSCC RNA-seq data sets from TCGA, doubling the size of our cohort (n = 85), and modeled lncRNA expression level as a binary variable, with the “low” group corresponding to the 50% of HNSCC patients with relative low expression of the lncRNA, and “high” corresponding to the 50% of HNSCC patients exhibiting relative high expression of the lncRNA. Low expression of 2 lncRNAs that RNA-seq analysis identified as dramatically down-regulated in HNSCC, lnc-LCE5A-1 and lnc-KCTD6-3 (Table 2), correlated with poor survival under univariate Kaplan–Meier analysis, with a Cox regression model also yielding significant results (lnc-LCE5A-1: P = 0.048, hazard ratio [HR] = 1.65; lnc-KCTD6-3: P = 0.032, HR = 1.73) (Fig. 2A,B). We obtained snoRNA expression profiles from an additional 99 randomly selected HNSCC tumors from TCGA, resulting in a cohort of size n = 130. Univariate analysis revealed that lower expression of SNORD35B (U35B), a snoRNA down-regulated in HNSCC, served as an adverse prognostic factor for survival, with Cox regression analysis also finding significant correlation (P = 0.009, HR = 1.94) (Fig. 2C).
TABLE 2.
Genomic coordinates and aliases for survival-associated ncRNAs
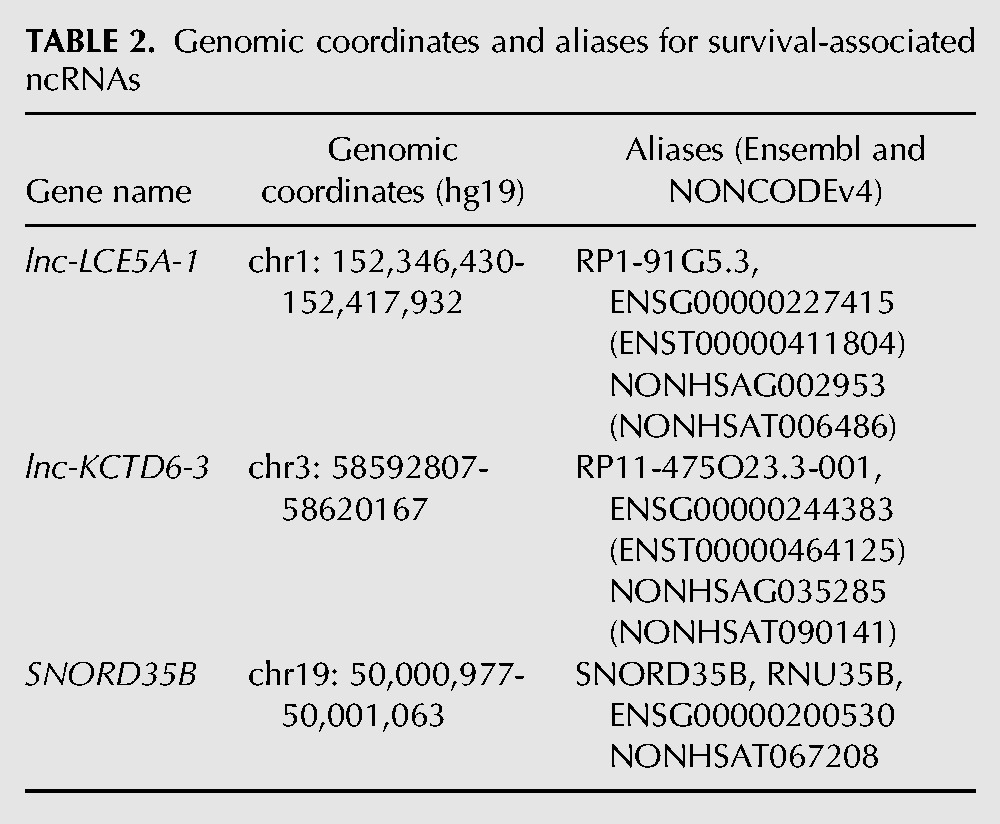
FIGURE 2.
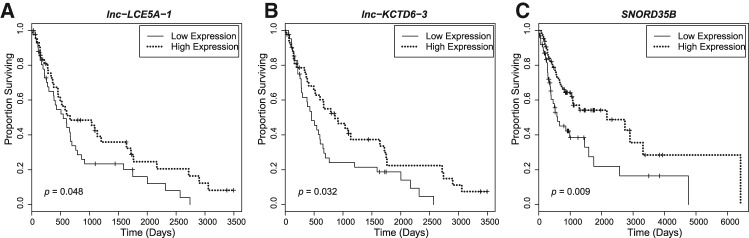
Kaplan–Meier curves show correlation between expression of three ncRNAs in HNSCC tumors and overall survival. Patients were divided into high and low expression groups depending on whether their expression of the given ncRNA fell above or below the median. Low expression of (A) lnc-LCE5A-1, (B) lnc-KCTD6-3, and (C) snoRNA SNORD35B was significantly associated with poorer survival in univariate analyses.
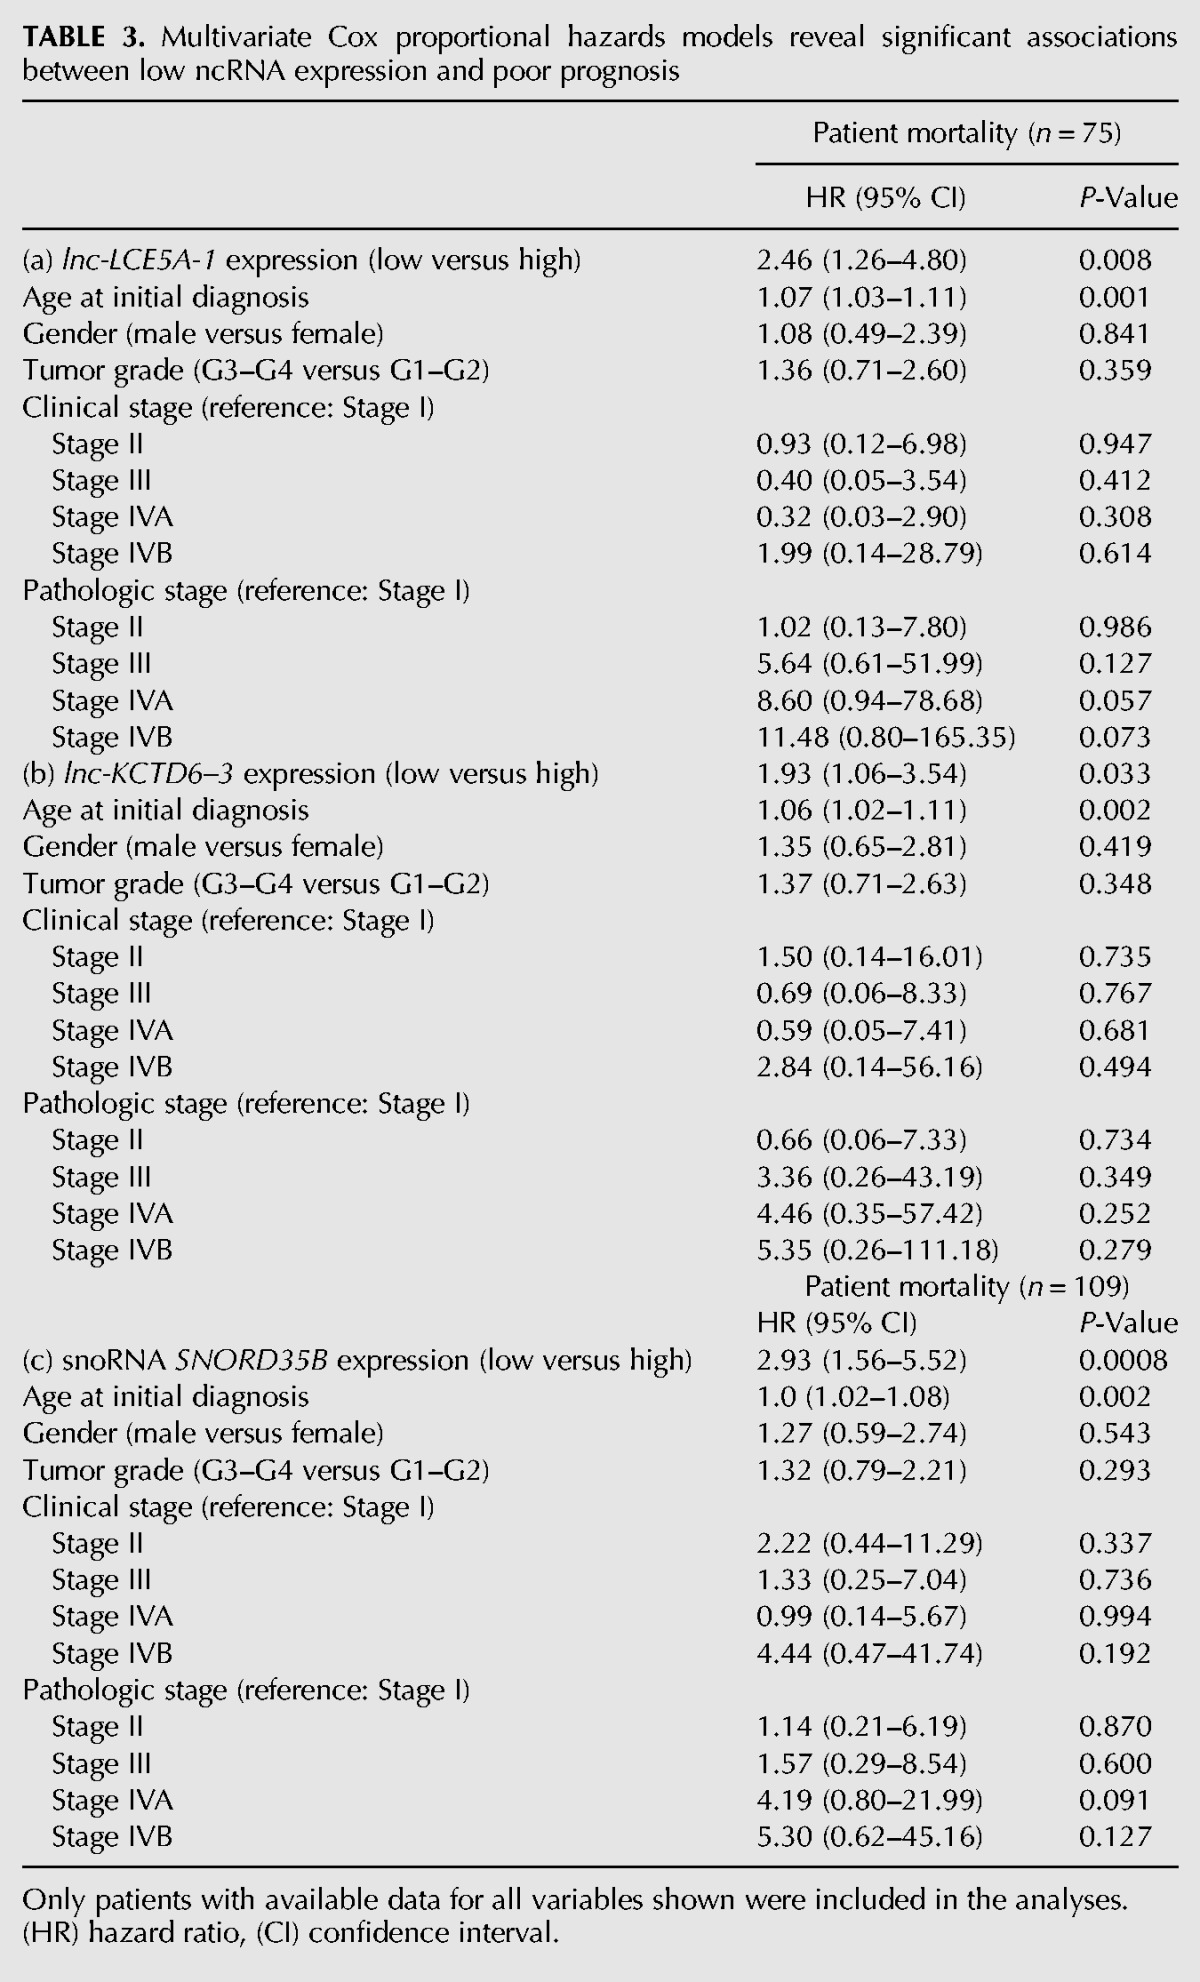
We then performed multivariate analysis for lnc-LCE5A-1, lnc-KCTD6-3, and SNORD35B and found that expression of these three noncoding RNAs operated as prognostic factors independent of established clinical risk factors, including pathologic stage and tumor grade, among other patient characteristics (Table 3). To eliminate age as a confounding variable in patient survival and ncRNA expression level, we conducted a secondary analysis excluding patients >85 yr of age. Additionally, we modeled patient age as both a continuous and binary covariate (< or > = 75 yr) in order to capture nonlinear associations between patient age and survival. Under this analysis, we found that high versus low expression of all three ncRNAs remained a significant independent predictor of patient outcomes (Supplemental Table S5).
TABLE 3.
Multivariate Cox proportional hazards models reveal significant associations between low ncRNA expression and poor prognosis
Transcript characterization and coverage mapping of survival-associated ncRNAs
Visualization of both lncRNAs in the Ensembl genome browser revealed their antisense overlap with protein-coding regions, while SNORD35B was found to be encoded in an intron of RPS11 (Fig. 3). To confirm that the mapped reads spanned the entirety of our identified lncRNAs, we plotted the average per-base coverage of each exon in the lncRNAs (Supplemental Fig. S2a,b). We also compared the sequences and locations of SNORD35B and its paralog, SNORD35A (Supplemental Fig. S2c).
FIGURE 3.

BLAT visualization of survival-associated ncRNAs via the Ensembl Genome Browser. (A) BLAT search of lnc-LCE5A-1 reveals its antisense overlap with gene CRNN. (B) BLAT search of lnc-KCTD6-3 reveals its antisense overlap with gene FAM107A and exonic antisense overlap with FAM3D. (C) BLAT search of snoRNA SNORD35B shows its location in an intron of RPS11 (40S ribosomal protein S11).
In vitro verification of survival-associated ncRNAs
To verify the dysregulation of lnc-LCE5A-1, lnc-KCTD6-3, and SNORD35B, we examined their relative expression in two normal oral epithelial cell lines (OKF4 and OKF6) compared with five established HNSCC cell lines (UMSCC-10B, UMSCC-22B, HN-1, HN-12, and HN-30) using real-time qRT-PCR (quantitative reverse transcriptase PCR). We found that the three ncRNAs were nearly exclusively down-regulated in the HNSCC cell lines, although lnc-LCE5A-1 and lnc-KCTD6-3 were both down-regulated to a lesser extent than predicted by RNA-seq analysis of the patient sequence data (Fig. 4).
FIGURE 4.
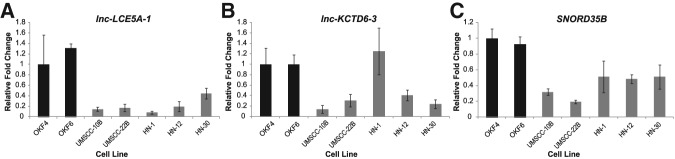
qRT-PCRs demonstrate that the three ncRNAs of interest are down-regulated in vitro. Expression levels of lnc-LCE5A-1, lnc-KCTD6-3, and SNORD35B were compared between two normal oral epithelial cell lines (OKF4 and OKF6), shown in black, and five HNSCC cell lines (UMSCC-10B, UMSCC-22B, HN-1, HN-12, and HN-30), shown in gray, with expression in OKF4 serving as the reference. (A,C) lnc-LCE5A-1 and SNORD35B exhibited significant down-regulation across all cancerous cell lines, while (B) lnc-KCTD6-3 showed down-regulation in four of the five cell lines.
Overexpression of lnc-LCE5A-1 and lnc-KCTD6-3 in HNSCC cell lines decreases stem cell and EMT gene expression and reduces migration and proliferation
To explore the functional significance of our two HNSCC-dysregulated lncRNAs, we first examined their relationship with established epithelial–mesenchymal transition (EMT) and cancer stem cell (CSC) genes. We transfected lnc-LCE5A-1 and lnc-KCTD6-3 expression plasmids into HNSCC cell lines and measured their overexpression using qRT-PCR (Supplemental Fig. S3). Ectopic expression of lnc-LCE5A-1 increased the expression of CDH-1 (E-cadherin) in HNSCC cells, while decreasing the expression of OCT-4, NANOG, and VIM (Vimentin) (Fig. 5A). Meanwhile, overexpression of lnc-KCTD6-3 reduced the expression of NANOG, BMI, TWIST, and VIM in HNSCC cell lines (Fig. 5B).
FIGURE 5.
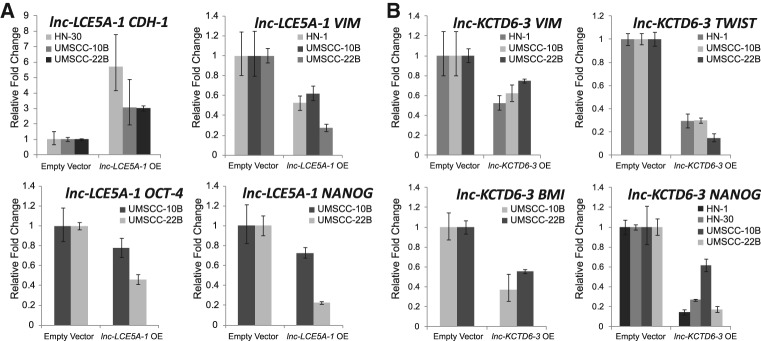
Ectopic expression of lnc-LCE5A-1 and lnc-KCTD6-3 inhibits cancer stem cell and EMT-inducing genes. (A) lnc-LCE5A-1-transfected HNSCC cell lines exhibited induction of CDH-1 (E-cadherin) and reduction in VIM, NANOG, and OCT-4 expression levels, while (B) lnc-KCTD6-3-transfected cell lines exhibited down-regulation of VIM, TWIST, BMI-1, and NANOG.
Because the expression of EMT-related genes was consistently altered in lncRNA-transfected cells, we examined whether these lncRNAs could inhibit cell migration, a key component of the EMT phenotype, using wound healing migration assays. Over a 24-h period, we observed markedly reduced migration of lnc-LCE5A-1 and lnc-KCTD6-3-transfected HNSCC cells as compared with vector-transfected controls (Fig. 6).
FIGURE 6.

Overexpression of lnc-LCE5A-1 and lnc-KCTD6-3 dramatically reduces HNSCC cell migration. Wound healing migration assays in (A) UMSCC-10B and (B) UMSCC-22B HNSCC cell lines show decreased cell motility in lnc-LCE5A-1 and lnc-KCTD6-3-transfected cell lines. Graphs plot average scratch wound width at each 12-h timepoint.
Additionally, to investigate the effects of both lncRNAs on cell proliferation, we performed an MTS assay on lnc-LCE5A-1 and lnc-KCTD6-3-transfected HNSCC cell lines. Both lncRNAs led to a reduction in proliferation of at least 25% over 3 d (Fig. 7).
FIGURE 7.
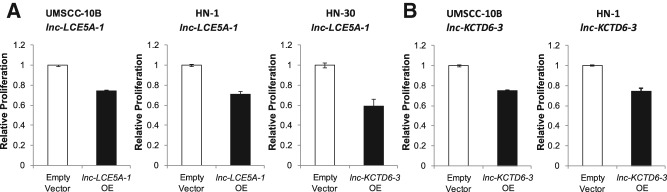
Overexpression of lnc-LCE5A-1 and lnc-KCTD6-3 reduces HNSCC cell proliferation. Three-day MTS proliferation assays demonstrate at least 25% reduction in growth in (A) lnc-LCE5A-1-transfected cell lines and (B) lnc-KCTD6-3-transfected cell lines as compared to vector-transfected cells.
DISCUSSION
The molecular basis of HNSCC has largely been studied in the context of environmental risk factors and predispositions in the protein-coding genome. Despite extensive research and advances in HNSCC treatment, there exists a paucity of biomarkers for early detection and few targetable gene mutations, and survival rates for the disease have shown little improvement (Agrawal et al. 2011). Meanwhile, much remains to be characterized regarding the epigenetic and transcriptomic landscapes of HNSCC; their alterations and functional roles may help shape a new generation of HNSCC diagnostic and therapeutic strategies.
To our knowledge, this is the first study utilizing next-generation sequencing to globally profile the dysregulation of lncRNAs and snoRNAs in HNSCC. We first compiled and compared the expression patterns of 32,108 lncRNA transcripts in HNSCC and adjacent normal tissues. Among the 12,407 lncRNA transcripts consistently detected in these samples, nearly one-fourth (2808) were significantly differentially expressed in HNSCC by a fold change of ≥2, with 222 transcripts differentially expressed by eightfold or more. We also compared the expression profiles of 325 snoRNAs in 31 HNSCC and matched normal tissues, and of the 135 snoRNAs expressed, about one-fifth (33) were significantly dysregulated in HNSCC. Such a sizeable volume and magnitude of dysregulation in both lncRNAs and snoRNAs, coupled with existing findings regarding the differential expression of various microRNAs (Avissar et al. 2009; Childs et al. 2009; Ramdas et al. 2009; Hui et al. 2010) and well-documented lncRNAs (Yang and Deng 2014), suggests that aberrations associated with the noncoding transcriptome are pervasive in HNSCC and if functionally characterized, may substantially expand our knowledge about the epigenetic mechanisms and regulatory alterations involved in HNSCC pathogenesis.
Previous studies on lncRNAs in HNSCC have primarily taken place in the context of known cancer-associated transcripts. Multiple isoforms of GAS5 and MEG-3, lncRNAs previously implicated in HNSCCs (Gee et al. 2011; Tang et al. 2013), were found to be differentially expressed in our cohort, but with small fold change magnitudes. Several other known cancer-associated lncRNAs have also been implicated in HNSCCs, but most are only limited to tumors arising in certain anatomic sites. HOTAIR, for instance, showed elevated expression in nasopharyngeal, laryngeal, and oral squamous cell carcinomas, but did not exhibit significant up-regulation in tongue squamous cell carcinomas; similarly, NEAT-1, MALAT-1, and UCA-1 were inconsistently dysregulated among laryngeal, oral, and tongue squamous cell carcinomas (Yang and Deng 2014). Our primary study profiled ncRNA dysregulation independently of HNSCC anatomic subdivision, with samples originating from multiple tumor sites. We failed to identify HOTAIR, NEAT-1, UCA-1, or MALAT-1, among several other cancer-associated lncRNAs, as differentially expressed across our cohort, suggesting a degree of consistency with previous findings.
A number of studies have identified molecular distinctions among HNSCCs of varying anatomic origin (Rodrigo et al. 2001; Belbin et al. 2008; Kokko et al. 2011; Lleras et al. 2013). CD44 expression, for instance, was found to be predictive of 5-yr survival in primary pharyngeal and laryngeal tumors, but not in tumors arising in the oral cavity (Kokko et al. 2011). Meanwhile, genome-wide methylation profiling revealed unique DNA methylation signatures associated with different HNSCC anatomic sites (Lleras et al. 2013). Given the tissue specificity of lncRNAs and their prolific involvement in many aspects of genomic and transcriptional regulation (Cabili et al. 2011), changes in lncRNA expression may contribute to the emergence of site-specific characteristics in HNSCC.
To further study anatomic site-specific lncRNA expression and dysregulation, we stratified our patients by primary tumor site (oral, tongue, and laryngeal) and performed differential expression analysis on each subcohort. We found significant dysregulation of HOTAIR and MEG-3 in oral squamous cell carcinomas, consistent with a prior study by Tang et al. (2013); however, in contrast to their report, we observed no significant dysregulation of NEAT-1 or UCA-1. We also found no significant overexpression of UCA-1 in our 13 patients with tongue squamous cell carcinoma (TSCC), although its dysregulation was previously reported by Fang et al. (2014). In accordance with Fang et al., however, we failed to implicate HOTAIR, NEAT-1, MALAT-1, MEG-3, or HULC as differentially expressed in TSCC. Finally, in our 11 laryngeal squamous cell carcinomas (LSCC), we observed moderate down-regulation of RP11-169D4.1, a transcript recently associated with LSCC patient survival (Shen et al. 2014), yet found no significant dysregulation of HOTAIR, MALAT-1, or AC026166.2, although all three lncRNAs were previously implicated in LSCCs (Shen et al. 2014; Yang and Deng 2014). These discrepancies regarding the dysregulation of lncRNAs in various HNSCC anatomic sites merit further investigation; larger patient cohorts or multicenter studies, as well as more uniform, next-generation expression profiling approaches, may play important roles in resolving such differences. The two lncRNAs we identify here, however, consistently appear among the most down-regulated transcripts in all three anatomic sites (Supplemental Table S4). Taken together, these preliminary analyses suggest that there is a high likelihood of heterogeneity among the noncoding pathways altered in HNSCCs arising from different anatomic sites, but that the dysregulation of certain lncRNAs may still persist as unifying features in HNSCC development and progression.
We also conducted our study independently of patients’ HPV status and tobacco and/or alcohol consumption, even though these factors have been shown to produce distinctions in HNSCC gene and microRNA signatures and prompt different modes of clinical management (Hui et al. 2010; Agrawal et al. 2011; Stransky et al. 2011). The fact that most existing and well-characterized genes, microRNAs, and lncRNAs are of limited applicability in explaining the pathogenesis of HNSCC as a whole further underscores the importance of identifying alternative dysregulated ncRNAs as biomarkers or prognostic indicators in HNSCC, and determining, in turn, their molecular roles in HNSCC pathogenesis.
Using RNA-seq, we were able to quantify the expression levels of not only known, cancer-associated lncRNAs, but also those of previously uncharacterized lncRNA transcripts. Despite evidence of key variations at the molecular level distinguishing certain HNSCC subtypes, we were able to identify universal alterations in the transcriptomic landscape of HNSCC that occurred regardless of the roles of environmental factors or anatomic sites in HNSCC etiology. To identify lncRNAs and snoRNAs with the greatest potential functional significance, we examined the correlation between the expression levels of our candidate transcripts in HNSCC patients and these patients’ overall survival using univariate and multivariate Cox regression analyses, identifying two lncRNAs, lnc-LCE5A-1 and lnc-KCTD6-3, and 1 snoRNA, SNORD35B, whose low expression in HNSCC tumors was significantly associated with poor survival. We are the first to associate these two lncRNAs with disease, as well as the first to implicate snoRNAs as both widely dysregulated and prognostically significant in HNSCC.
We verified the dysregulation of these three transcripts in vitro by comparing their expression levels in normal oral epithelial cell lines with those in HNSCC cell lines. We did find that the fold changes of these ncRNAs between HNSCC and normal cell lines were inconsistent with those predicted by the RNA-seq patient data analysis, with lnc-LCE5A-1 and lnc-KCTD6-3 exhibiting a significantly more moderate degree of dysregulation than indicated by the clinical data. Such a disparity may be attributed to the fact that the cell lines were not matched samples; furthermore, dramatically reduced differences in endogenous lncRNA expression between normal and cancerous cell lines appears to be a feature in other lncRNA studies as well (Gupta et al. 2010).
We next investigated the functional significance of lnc-LCE5A-1 and lnc-KCTD6-3 in terms of their effects on EMT and cancer stem cell (CSC) characteristics. Enforced expression of the lncRNAs in HNSCC cell lines led to down-regulation of CSC- and EMT-inducing genes, with lnc-LCE5A-1 promoting the up-regulation of key EMT-inhibitor CDH-1 (E-cadherin) as well. lnc-LCE5A-1 and lnc-KCTD6-3-transfected cells also exhibited notably reduced rates of cellular migration and proliferation, further indicating that these lncRNAs may play significant roles in inhibiting EMT and stem cell-like phenotypes.
The association of both lncRNAs with EMT and CSC signatures underscores the importance and potential clinical significance of the EMT-CSC model of tumorigenesis and disease progression in HNSCC. Because EMT induction leads to the acquisition of invasive and migratory capabilities in cancer cells and promotes the formation of tumor-initiating, self-renewing CSCs (Singh and Settleman 2010), its potential regulation by lnc-LCE5A-1 and lnc-KCTD6-3 may account for the reduced survival observed among patients expressing low levels of these lncRNAs. Further characterization of the nature and mechanism behind lnc-LCE5A-1 and lnc-KCTD6-3 modulation of EMT and CSC characteristics may establish these lncRNAs as promising targets of HNSCC therapies intending to diminishing risks of recurrence and metastasis.
While we assessed the roles of these lncRNAs in terms of their impact on well-established tumorigenic pathways, the cis-antisense orientation of both lncRNAs with protein-coding genes is intriguing and may contribute to the functional scope of these lncRNAs as well. CRNN (also known as C1orf10) overlaps the intron of lnc-LCE5A-1 (Fig. 5A) and encodes the protein cornulin, which is expressed in the upper cell layers of differentiated squamous tissues and linked to epithelial differentiation (Contzler et al. 2005). Low expression of CRNN has been observed in esophageal and oral squamous cell carcinomas and implicated in cell proliferation (Imai et al. 2005; Luthra et al. 2007). Because antisense intersections of lncRNAs and mRNAs may influence expression of the latter (Guil and Esteller 2012), further studies on the association in expression between lnc-LCE5A-1 and CRNN, as well as characterization of the possible molecular mechanisms behind such a relationship, may be valuable.
Similarly, lnc-KCTD6-3 exhibits an antisense overlap with introns of FAM107A (Fig. 5B), a gene found to exhibit low or complete loss of expression in a number of cancers, including renal cell, nonsmall cell lung, and prostate cancers, as well as astrocytomas, while studies of enforced expression of FAM107A show that it inhibits cell proliferation and promotes apoptosis (Yamato et al. 1999). Additionally, lnc-KCTD6-3 overlaps FAM3D, a gene observed to be up-regulated in the bloodstream of colon cancer patients that has been proposed as a potential biomarker for early detection (Solmi et al. 2004). Investigation of the cis-regulatory potential of lnc-KCTD6-3 with respect to FAM107A and FAM3D may prove fruitful as well.
Meanwhile, SNORD35B, a box C/D snoRNA thought to mediate the 2′-O-methylation of 28S ribosomal RNA (residue C4506) (Nicoloso et al. 1996; Lestrade and Weber 2006), is located in an intronic region and cotranscribed with host gene RPS11 (Fig. 3C). While the role of the RPS11 in cancer is unknown, Nadano et al. (2000) reported aberrant expression of the ribosomal protein S11 in a panel of cancer cell lines. Intriguingly, these differences in S11 expression were not shown to affect ribosomal biogenesis or protein composition, prompting speculation of a nonribosomal function for S11, and in turn, RPS11 and its intronic snoRNA. Many snoRNAs, including previously disease-associated snoRNAs, are intronically oriented; nine box C/D snoRNAs, for instance, are encoded in the introns of lncRNA GAS5 and were implicated as possible factors in oncogenesis as well due to their low expression and correlation with survival in breast carcinomas (Gee et al. 2011). Additionally, four box C/D snoRNAs, SNORD32A, SNORD33, SNORD34, and SNORD35A , are located in the introns of RPL13A, a component of the 60s ribosomal subunit protein (Michel et al. 2011). Interestingly, a cell line with reduced expression of these snoRNAs did not result in differential methylation of ribosomal RNAs as predicted, but linked down-regulation of the snoRNAs to increased resistance to lipotoxicity and regulation of metabolic stress pathways (Michel et al. 2011).
Like SNORD35B, SNORD35A was also predicted to facilitate methylation of 28S rRNA in terms of canonical snoRNA function, and we found it to be significantly down-regulated in HNSCCs as well (Supplemental File 2). These parallels suggest that SNORD35B, as a trans-duplicated paralog of SNORD35A with sequence and structural similarity (Supplemental Fig. S2), may similarly assume a repertoire of nonnucleolar or nonribosomal functions. Functional analysis of both paralogs in the context of cancer would therefore be valuable, and could further cement snoRNAs as a novel and potentially fruitful source of insight into HNSCC pathogenesis.
CONCLUSIONS
Our findings suggest that dysregulation of the noncoding transcriptome in HNSCC is both extensive and enormously complex. In particular, we have identified three transcripts whose expression levels correlate significantly to patient survival, including two novel lncRNAs that confer a tumor suppressive phenotype. Although further characterization of their molecular mechanisms remains necessary, these ncRNAs may play functionally vital roles in HNSCC pathogenesis. Taken as a whole, our findings demonstrate that RNA-seq transcriptome profiling on matched tumor and normal pairs generates novel insights into cancer biology, resulting in the implication of many previously uncharacterized elements in HNSCC pathogenesis and also yielding findings that may be applicable to other malignancies.
MATERIALS AND METHODS
lncRNA expression profiling
RNA-seq libraries were obtained from The Cancer Genome Atlas (TCGA) (https://tcga-data.nci.nih.gov/tcga/), which contained 40 patients with either RNA-seq or RNASeqv2 data for HNSCCs (arising in the oral cavity, tongue, or larynx) and their adjacent normal tissue samples (TCGA IDs in Supplemental File 8). For each of these data sets, sequence reads had been aligned using the BWA algorithm (http://bio-bwa.sourceforge.net/, default parameters) to a reference transcript database derived from hg19 (UCSC).
A BED annotation file containing 32,108 human lncRNA transcripts and splice isoforms was downloaded from LNCipedia (Volders et al. 2013), a database curating lncRNA structures and sequences from multiple sources, including the lncRNAdb, Broad Institute, Ensembl, Gencode, and NONCODE. The BEDtools utility coverageBed (Quinlan and Hall 2010) was used to generate lncRNA expression values in the form of integer read counts for each data set by computing the number of alignments from each library that overlapped each lncRNA feature given by the annotation file.
snoRNA expression profiling
RNAseqv2-generated expression profiles of known snoRNAs were available in TCGA for 31 HNSCCs (arising in the oral cavity, tongue, or larynx) and their adjacent normal tissues (TCGA IDs in Supplemental Table S6). snoRNA expression values in the form of integer read counts were obtained for each data set.
lncRNA and snoRNA differential expression analysis
Using the R/Bioconductor software package edgeR (http://www.bioconductor.org/packages/release/bioc/html/edgeR.html), differential expression analysis was performed on the lncRNA and snoRNA read count data produced for the HNSCC and normal sample pairs. lncRNAs and snoRNAs with very low expression (counts per million <1 for more than one-half of the samples) were excluded from the analysis. Recalculation and accounting for differences between sample library sizes was accomplished by using trimmed mean of M-values (TMM) to compute normalization factors.
To accommodate the paired nature of the experimental designs, the negative binomial generalized linear model (GLM) functionality in edgeR, along with Cox–Reid dispersion estimates, was used. These methods have demonstrated success in assessing differential expression in multifactor experiments while appropriately accounting for biological and technical variation (McCarthy et al. 2012). lncRNAs and snoRNAs whose fold changes were found to vary between HNSCC and paired normal samples by a fold change magnitude greater than 1 and whose false discovery rates (FDR) fell below 0.05 were identified by edgeR to be differentially expressed. To form a more selective panel of lncRNAs for further analysis, filtering of the edgeR lncRNAs was performed based on the following criteria: |HNSCC/Normal| greater than or equal to eightfold change and FDR <0.0001, yielding 222 lncRNAs of interest. All 33 snoRNAs determined by edgeR to be differentially expressed were retained as candidates.
lncRNA and snoRNA survival analysis
lncRNA expression was profiled (according to the procedure above) for an additional 45 randomly selected HNSCC TCGA data sets, doubling the size of our cohort (n = 85), while 100 additional randomly selected RNA-seq-generated snoRNA expression profiles were obtained from TCGA, resulting in a cohort size of 130. All data regarding patient survival, demographics, and clinicopathological characteristics was obtained from TCGA. For both univariate and multivariate analyses, we modeled lncRNA and snoRNA expression level as a binary variable, with the “low” group corresponding to the one-half of HNSCC patients exhibiting relative low expression of the ncRNA, and “high” corresponding to the other half of the HNSCC patients with relative high expression of the ncRNA. For multivariate Cox analysis, patient age was modeled as a continuous variable, and clinical stage and pathologic stage were treated as categorical variables (with Stage I set as the reference). Gender (male versus female) and tumor grade (G3–G4 versus G1–G2) were modeled as binary variables. Patients with incomplete or unavailable data in any of these categories were excluded from the multivariate analysis, resulting in cohort sizes of 75 for the lncRNA analyses and 109 for the snoRNA analysis (TCGA IDs used listed in Supplemental Table S7). The Statsoft software STATISTICA was used for survival models.
Cell lines and cell culture
The two noncancerous oral epithelial cell lines used in the qRT-PCR experiments, OKF4 and OKF6, were gifts from the Rheinwald Lab at Harvard Medical School. Both were cultured in Keratinocyte-SFM(1X) with L-glutamine, supplemented with 0.2 ng/mL human recombinant epidermal growth factor (EGF) 1-53, 25 µg/mL bovine pituitary extract (BPE), 0.3 mM calcium chloride, and penicillin streptomycin. Once they attained 30% confluency, they were cultured in equal parts supplemented Keratinocyte-SFM medium and DFK medium. DFK was made with equal parts DMEM and F-12 and supplemented with 0.2 ng/mL EGF 1-53, 25 µg/mL BPE, 2mM L-glutamine, and penicillin streptomycin.
Five established HNSCC cell lines, UMSCC-10B (base of tongue), UMSCC-22B (larynx), HN-1 (pharynx), HN-12 (tongue), and HN-30 (pharynx), were used in the in vitro portion of this study. UMSCC-10B and UMSCC-22B were gifts from Dr. Tom Carey (University of Michigan) and HN-1, HN-12, and HN-30 were gifts from Dr. J.S. Gutkind (National Institute for Dental and Craniofacial Research). Cell lines were cultured in DMEM supplemented with 10% fetal bovine serum (FBS), 2% streptomycin sulfate (Invitrogen), and 2% L-glutamine (Invitrogen), and incubated at 37°C in 5% CO2 and 21% O2.
Validation of differential expression by qRT-PCR
Total RNA was isolated using the RNeasy mini kit (QIAGEN). After polyadenylation (Ambion) and annealing of 1.0 μg total RNA, cDNA was synthesized using M-MLV reverse transcriptase (Promega), according to the manufacturer's instructions. Real-time PCR reaction mixes were created using FastStart Universal SYBR Green Master Mix (Roche Diagnostics) and run on a StepOnePlusTM Real-Time PCR System (Applied Biosystems) using the following program: 95°C for 10 min, 95°C for 30 sec, and 60°C for 1 min, for 50 cycles. Results were analyzed using the ▵▵Ct method, and experiments were performed in technical triplicates with GAPDH gene expression measured as endogenous control. Strand-specific primers were custom designed by the authors and created by Eurofins Genomics. The following sequences were used: GAPDH forward: 5′-CTTCGCTCTCTGCTCCTCC-3′, reverse: 5′-CAATACGACCAAATCCGTTG-3′, lnc-LCE5A-1 forward: 5′-GGGCACCTCAAGAAAAGCAT-3′, reverse: 5′-GAGCACAGCCACACACTAAA-3′, lnc-KCTD6-3 forward: 5′-AGCCACAGCCACCCTAAAAT-3′, reverse: 5′-ACAGCCTCACTCACTGCCTA-3′, snoRNA SNORD35B forward: 5′-GCAGATGATGTTTGTTTTCACG-3′, reverse: 5′-CGGCATCAGTTTTACCAAGTG-3′.
lncRNA expression plasmid transfection
Expression plasmids for lnc-LCE5A-1 and lnc-KCTD6-3 were custom-designed (Life Technologies) by cloning the respective lncRNA sequences into the pUC19 vector. Plasmids were transiently transfected using Lipofectamine 2000 (Invitrogen), following the manufacturer's specifications. The pUC19 empty vector was used as a control and transfection efficiency for all three plasmids was monitored using GFP as a reporter.
Quantitative real-time PCR for stem cell and EMT gene expression
Total RNA was collected 48 h after transfection with the lncRNA expression plasmids using the RNeasy mini kit (QIAGEN). cDNA was synthesized using the Superscript III RT-PCR kit (Invitrogen) per the manufacturer's instructions. Real-time PCR reaction mixes were created using FastStart Universal SYBR Green Master Mix (Roche Diagnostics), and run on a StepOnePlusTM Real-Time PCR System (Applied Biosystems) using the following program: 95°C for 10 min, 95°C for 30 sec, and 60°C for 1 min, for 40 cycles. Results were analyzed using the ▵▵Ct method, and experiments were performed in technical triplicates with GAPDH gene expression measured as endogenous control. Primers were custom ordered (Eurofins MWG Operon) using the following sequences: GAPDH forward: 5′-CTTCGCTCTCTGCTCCTCC-3′, reverse: 5′-CAATACGACCAAATCCGTTG-3′. OCT-4 forward: 5′-GCAAAGCAGAAACCCTCGTGC-3′, reverse: 5′-ACCACACTCGGACCACATCCT-3′. NANOG forward: 5′-GATTTGTGGGCCTGAAGAAA-3′, reverse: 5′-TTGGGACTGGTGGAAGAATC-3′. BMI-1 forward: 5′-TCCACAAAGCACACACATCA-3′, reverse: 5′-CTTTCATTGTCTTTTCCGCC-3′. VIM forward: 5′-GGAAATGGCTCGTCACCTTCGT-3′, reverse: 5′-AGAAATCCTGCTCTCCTCGCCT-3′. TWIST forward: 5′-GGGCCGGAGACCTAGATGTCATTG-3′, reverse: 5′-GAATGCAGAGGTGTGAGGATGGTG-3′. CDH-1 forward: 5′-CTGATGTGAATGACAACGCC-3′, reverse: 5′-TAGATTCTTGGGTTGGGTCG-3′.
MTS cell proliferation assay
UMSCC-10B, UMSCC-22B, HN-1, and HN-30 cells were plated into a 96-well flat-bottom tissue culture plate (Falcon) at a density of 5000 cells per well. After a 24-h plating period, cells were transfected with the lncRNA expression plasmids. Following a 48- to 72-h incubation period, cellular proliferation was analyzed using the CellTiter 96 AQueous nonradioactive proliferation assay (Promega) in accordance with the manufacturer's protocol. All assays were performed in triplicate wells and experiments were individually performed twice.
Wound healing migration assay
UMSCC-10B and UMSCC-22B cells were cultured in 6-well plates until confluent and were transiently transfected with the lncRNA expression plasmids. Forty-eight hours after transfection, a line in the plate was scored using a P200 pipette tip. The cells were incubated in growth medium, and at each 12-h interval, the scratched wound was photographed using a light microscope (Nikon Eclipse TE2000-U).
SUPPLEMENTAL MATERIAL
Supplemental material is available for this article.
Supplementary Material
ACKNOWLEDGMENTS
This work was supported by funding from the Office of Extramural Research, National Institutes of Health, grant number DE023242 to W.M.O.; by funding from the Center for Integrated Healthcare, US Department of Veterans Affairs, Veterans Health Administration, BLR&D IO1BX002284 to J.H.L.; and by a grant from the Larry L. Hillblom Foundation to A.H.
Footnotes
Article published online ahead of print. Article and publication date are at http://www.rnajournal.org/cgi/doi/10.1261/rna.049262.114.
REFERENCES
- Agrawal N, Frederick MJ, Pickering CR, Bettegowda C, Chang K, Li RJ, Fakhry C, Xie TX, Zhang J, Wang J, et al. 2011. Exome sequencing of head and neck squamous cell carcinoma reveals inactivating mutations in NOTCH1. Science 333: 1154–1157. [DOI] [PMC free article] [PubMed] [Google Scholar]
- Avissar M, Christensen BC, Kelsey KT, Marsit CJ 2009. MicroRNA expression ratio is predictive of head and neck squamous cell carcinoma. Clin Cancer Res 15: 2850–2855. [DOI] [PMC free article] [PubMed] [Google Scholar]
- Belbin TJ, Schlecht NF, Smith RV, Adrien LR, Kawachi N, Brandwein-Gensler M, Prystowsky MB 2008. Site-specific molecular signatures predict aggressive disease in HNSCC. Head Neck Pathol 2: 243–256. [DOI] [PMC free article] [PubMed] [Google Scholar]
- Cabili MN, Trapnell C, Goff L, Koziol M, Tazon-Vega B, Regev A, Rinn JL 2011. Integrative annotation of human large intergenic noncoding RNAs reveals global properties and specific subclasses. Genes Dev 25: 1915–1927. [DOI] [PMC free article] [PubMed] [Google Scholar]
- Chang LS, Lin SY, Lieu AS, Wu TL 2002. Differential expression of human 5S snoRNA genes. Biochem Biophys Res Commun 299: 196–200. [DOI] [PubMed] [Google Scholar]
- Childs G, Fazzari M, Kung G, Kawachi N, Brandwein-Gensler M, McLemore M, Chen Q, Burk RD, Smith RV, Prystowsky MB, et al. 2009. Low-level expression of microRNAs let-7d and miR-205 are prognostic markers of head and neck squamous cell carcinoma. Am J Pathol 174: 736–745. [DOI] [PMC free article] [PubMed] [Google Scholar]
- Contzler R, Favre B, Huber M, Hohl D 2005. Cornulin, a new member of the “fused gene” family, is expressed during epidermal differentiation. J Invest Dermatol 124: 990–997. [DOI] [PubMed] [Google Scholar]
- Dong XY, Guo P, Boyd J, Sun X, Li Q, Zhou W, Dong JT 2009. Implication of snoRNA U50 in human breast cancer. J Genet Genomics 36: 447–454. [DOI] [PMC free article] [PubMed] [Google Scholar]
- Esteller M 2011. Non-coding RNAs in human disease. Nat Rev Genet 12: 861–874. [DOI] [PubMed] [Google Scholar]
- Fang Z, Wu L, Wang L, Yang Y, Meng Y, Yang H 2014. Increased expression of the long non-coding RNA UCA1 in tongue squamous cell carcinomas: a possible correlation with cancer metastasis. Oral Surg Oral Med Oral Pathol Oral Radiol 117: 89–95. [DOI] [PubMed] [Google Scholar]
- Feng J, Tian L, Sun Y, Li D, Wu T, Wang Y, Liu M 2012. Expression of long non-coding RNA MALAT-1 is correlated with progress and apoptosis of laryngeal squamous cell carcinoma. Head Neck Oncol 4: 46. [Google Scholar]
- Ferlay J, Shin HR, Bray F, Forman D, Mathers C, Parkin DM 2010. Estimates of worldwide burden of cancer in 2008: GLOBOCAN 2008. Int J Cancer 127: 2893–2917. [DOI] [PubMed] [Google Scholar]
- Gee HE, Buffa FM, Camps C, Ramachandran A, Leek R, Taylor M, Patil M, Sheldon H, Betts G, Homer J, et al. 2011. The small-nucleolar RNAs commonly used for microRNA normalisation correlate with tumour pathology and prognosis. Br J Cancer 104: 1168–1177. [DOI] [PMC free article] [PubMed] [Google Scholar]
- Geisler S, Coller J 2013. RNA in unexpected places: long non-coding RNA functions in diverse cellular contexts. Nat Rev Mol Cell Biol 14: 699–712. [DOI] [PMC free article] [PubMed] [Google Scholar]
- Guil S, Esteller M 2012. Cis-acting noncoding RNAs: friends and foes. Nat Struct Mol Biol 19: 1068–1075. [DOI] [PubMed] [Google Scholar]
- Gupta RA, Shah N, Wang KC, Kim J, Horlings HM, Wong DJ, Tsai MC, Hung T, Argani P, Rinn JL, et al. 2010. Long non-coding RNA HOTAIR reprograms chromatin state to promote cancer metastasis. Nature 464: 1071–1076. [DOI] [PMC free article] [PubMed] [Google Scholar]
- Hui AB, Lenarduzzi M, Krushel T, Waldron L, Pintilie M, Shi W, Perez-Ordonez B, Jurisica I, O'Sullivan B, Waldron J, et al. 2010. Comprehensive microRNA profiling for head and neck squamous cell carcinomas. Clin Cancer Res 16: 1129–1139. [DOI] [PubMed] [Google Scholar]
- Imai FL, Uzawa K, Nimura Y, Moriya T, Imai MA, Shiiba M, Bukawa H, Yokoe H, Tanzawa H 2005. Chromosome 1 open reading frame 10 (C1orf10) gene is frequently down-regulated and inhibits cell proliferation in oral squamous cell carcinoma. Int J Biochem Cell Biol 37: 1641–1655. [DOI] [PubMed] [Google Scholar]
- Kapranov P, St Laurent G, Raz T, Ozsolak F, Reynolds CP, Sorensen PH, Reaman G, Milos P, Arceci RJ, Thompson JF, et al. 2010. The majority of total nuclear-encoded non-ribosomal RNA in a human cell is ‘dark matter’ un-annotated RNA. BMC Biol 8: 149. [DOI] [PMC free article] [PubMed] [Google Scholar]
- Kokko LL, Hurme S, Maula SM, Alanen K, Grénman R, Kinnunen I, Ventelä S 2011. Significance of site-specific prognosis of cancer stem cell marker CD44 in head and neck squamous-cell carcinoma. Oral Oncol 47: 510–516. [DOI] [PubMed] [Google Scholar]
- Lestrade L, Weber MJ 2006. snoRNA-LBME-db, a comprehensive database of human H/ACA and C/D box snoRNAs. Nucleic Acids Res 34(Database issue): D158–D162. [DOI] [PMC free article] [PubMed] [Google Scholar]
- Li DD, Feng JP, Wu TY, Wang YD, Sun YN, Ren JY, Liu M 2013. Long intergenic noncoding RNA HOTAIR is overexpressed and regulates PTEN methylation in laryngeal squamous cell carcinoma. Am J Pathol 182: 64–70. [DOI] [PubMed] [Google Scholar]
- Liao J, Yu L, Mei Y, Guarnera M, Shen J, Li R, Liu Z, Jiang F 2010. Small nucleolar RNA signatures as biomarkers for non-small-cell lung cancer. Mol Cancer 9: 198. [DOI] [PMC free article] [PubMed] [Google Scholar]
- Lin R, Maeda S, Liu C, Karin M, Edgington TS 2007. A large noncoding RNA is a marker for murine hepatocellular carcinomas and a spectrum of human carcinomas. Oncogene 26: 851–858. [DOI] [PubMed] [Google Scholar]
- Lleras R, Smith RV, Adrien LR, Schlecht NF, Burk RD, Harris TM, Childs G, Prystowsky MB, Belbin TJ 2013. Unique DNA methylation loci distinguish anatomic site and HPV status in head and neck squamous cell carcinoma. Clin Cancer Res 19: 5444–5455. [DOI] [PMC free article] [PubMed] [Google Scholar]
- Luthra MG, Ajani JA, Izzo J, Ensor J, Wu TT, Rashid A, Zhang L, Phan A, Fukami N, Luthra R 2007. Decreased expression of gene cluster at chromosome 1q21 defines molecular subgroups of chemoradiotherapy response in esophageal cancers. Clin Cancer Res 13: 912–919. [DOI] [PubMed] [Google Scholar]
- McCarthy DJ, Chen Y, Smyth GK 2012. Differential expression analysis of multifactor RNA-Seq experiments with respect to biological variation. Nucleic Acids Res 40: 4288–4297. [DOI] [PMC free article] [PubMed] [Google Scholar]
- Mercer TR, Dinger ME, Mattick JS 2009. Long non-coding RNAs: insights into functions. Nat Rev Genet 10: 155–159. [DOI] [PubMed] [Google Scholar]
- Michel CI, Holley CL, Scruggs BS, Sidhu R, Brookheart RT, Listenberger LL, Behlke MA, Ory DS, Schaffer JE 2011. Small nucleolar RNAs U32a, U33, and U35a are critical mediators of metabolic stress. Cell Metab 14: 33–44. [DOI] [PMC free article] [PubMed] [Google Scholar]
- Mourtada-Maarabouni M, Pickard MR, Hedge VL, Farzaneh F, Williams GT 2009. GAS5, a non-protein-coding RNA, controls apoptosis and is downregulated in breast cancer. Oncogene 28: 195–208. [DOI] [PubMed] [Google Scholar]
- Nadano D, Ishihara G, Aoki C, Yoshinaka T, Irie S, Sato TA 2000. Preparation and characterization of antibodies against human ribosomal proteins: heterogeneous expression of S11 and S30 in a panel of human cancer cell lines. Jpn J Cancer Res 91: 802–810. [DOI] [PMC free article] [PubMed] [Google Scholar]
- Nemunaitis J, O'Brien J 2002. Head and neck cancer: gene therapy approaches. Part 1: adenoviral vectors. Expert Opin Biol Ther 2: 177–185. [DOI] [PubMed] [Google Scholar]
- Nicoloso M, Qu LH, Michot B, Bachellerie JP 1996. Intron-encoded, antisense small nucleolar RNAs: the characterization of nine novel species points to their direct role as guides for the 2′-O-ribose methylation of rRNAs. J Mol Biol 260: 178–195. [DOI] [PubMed] [Google Scholar]
- Quinlan AR, Hall IM 2010. BEDTools: a flexible suite of utilities for comparing genomic features. Bioinformatics 26: 841–842. [DOI] [PMC free article] [PubMed] [Google Scholar]
- Ramdas L, Giri U, Ashorn CL, Coombes KR, El-Naggar A, Ang KK, Story MD 2009. miRNA expression profiles in head and neck squamous cell carcinoma and adjacent normal tissue. Head Neck 31: 642–654. [DOI] [PMC free article] [PubMed] [Google Scholar]
- Rodrigo JP, Suárez C, González MV, Lazo PS, Ramos S, Coto E, Alvarez I, Garcia LA, Martinez JA 2001. Variability of genetic alterations in different sites of head and neck cancer. Laryngoscope 111: 1297–1301. [DOI] [PubMed] [Google Scholar]
- Shen Z, Li Q, Deng H, Lu D, Song H, Guo J 2014. Long non-coding RNA profiling in laryngeal squamous cell carcinoma and its clinical significance: potential biomarkers for LSCC. PLoS One 9: e108237. [DOI] [PMC free article] [PubMed] [Google Scholar]
- Singh A, Settleman J 2010. EMT, cancer stem cells and drug resistance: an emerging axis of evil in the war on cancer. Oncogene 29: 4741–4751. [DOI] [PMC free article] [PubMed] [Google Scholar]
- Solmi R, De Sanctis P, Zucchini C, Ugolini G, Rosati G, Del Governatore M, Coppola D, Yeatman TJ, Lenzi L, Caira A, et al. 2004. Search for epithelial-specific mRNAs in peripheral blood of patients with colon cancer by RT-PCR. Int J Oncol 25: 1049–1056. [PubMed] [Google Scholar]
- Stransky N, Egloff AM, Tward AD, Kostic AD, Cibulskis K, Sivachenko A, Kryukov GV, Lawrence MS, Sougnez C, McKenna A, et al. 2011. The mutational landscape of head and neck squamous cell carcinoma. Science 333: 1157–1160. [DOI] [PMC free article] [PubMed] [Google Scholar]
- Tang H, Wu Z, Zhang J, Su B 2013. Salivary lncRNA as a potential marker for oral squamous cell carcinoma diagnosis. Mol Med Rep 7: 761–766. [DOI] [PubMed] [Google Scholar]
- Volders PJ, Helsens K, Wang X, Menten B, Martens L, Gevaert K, Vandesompele J, Mestdagh P 2013. LNCipedia: a database for annotated human lncRNA transcript sequences and structures. Nucleic Acids Res 41(Database issue): D246–D251. [DOI] [PMC free article] [PubMed] [Google Scholar]
- Williams GT, Farzaneh F 2012. Are snoRNAs and snoRNA host genes new players in cancer? Nat Rev Cancer 12: 84–88. [DOI] [PubMed] [Google Scholar]
- Yamato T, Orikasa K, Fukushige S, Orikasa S, Horii A 1999. Isolation and characterization of the novel gene, TU3A, in a commonly deleted region on 3p14.3-->p14.2 in renal cell carcinoma. Cytogenet Cell Genet 87: 291–295. [DOI] [PubMed] [Google Scholar]
- Yang QQ, Deng YF 2014. Long non-coding RNAs as novel biomarkers and therapeutic targets in head and neck cancers. Int J Clin Exp Pathol 7: 1286–1292. [PMC free article] [PubMed] [Google Scholar]
- Zhang X, Rice K, Wang Y, Chen W, Zhong Y, Nakayama Y, Klibanski A 2010. Maternally expressed gene 3 (MEG3) noncoding ribonucleic acid: isoform structure, expression, and functions. Endocrinology 151: 939–947. [DOI] [PMC free article] [PubMed] [Google Scholar]
- Zhang J, Zhang P, Wang L, Piao HL, Ma L 2014. Long non-coding RNA HOTAIR in carcinogenesis and metastasis. Acta Biochim Biophys Sin (Shanghai) 46: 1–5. [DOI] [PMC free article] [PubMed] [Google Scholar]
Associated Data
This section collects any data citations, data availability statements, or supplementary materials included in this article.