

Abstract
Catastrophic ascending aorta aneurysm (AsAA) dissection and rupture can be prevented by elective surgical repair, but identifying individuals at risk remains a challenge. Typically the decision to operate is based primarily on the overall aneurysm size, which may not be a reliable indicator of risk. In this study, AsAA inflation and rupture was simulated in 27 patient-specific finite element models constructed from clinical CT imaging data and tissue mechanical testing data from matching patients. These patients included n = 8 with concomitant bicuspid aortic valve (BAV), n = 10 with bovine aortic arch (BAA), and n = 10 with neither BAV nor BAA. AsAA rupture risk was found to increase with elevated systolic wall stress and tissue stiffness. The aortic size index was sufficient for identifying the patients with the lowest risk of rupture, but unsuitable for delineating between patients at moderate and high risk. There was no correlation between BAV or BAA and AsAA rupture risk; however, the AsAA morphology was different among these patients. These results support the use of mechanical parameters such as vessel wall stress and tissue stiffness for AsAA presurgical evaluation.
Keywords: ascending aorta aneurysm, aortic rupture, finite element, bicuspid aortic valve, bovine aortic arch
aortic aneurysms present significant clinical risk as 50% of untreated aortic aneurysms in high-risk patients will rupture within 1 year (16). Ascending aorta aneurysm (AsAA) rupture is a catastrophic event with an estimated mortality rate of up to 90% (41). AsAA rupture is preventable by elective surgical repair, which is typically recommended for patients with an AsAA dilated to 55 mm or greater (9, 20). However, the overall AsAA diameter may not accurately reflect a patient's risk (3, 9, 11): small aneurysms (<45 mm) have been known to rupture (9). Ultimately, AsAA rupture is a mechanical event occurring when the vessel wall stress exceeds the strength of the tissue. For this reason, attention has turned towards biomechanical analyses to better understand the underlying mechanisms governing AsAA pathogenesis (1, 4, 23–25, 29, 36, 39).
Several groups have used computational methods to study thoracic aorta biomechanics (1, 4, 24, 25, 29, 36, 39). Through finite element (FE) and fluid-structure interaction (FSI) analyses, it has been shown that the locations of peak wall stress correspond to common dissection initiation points just above the sinotubular junction (STJ) (24, 29) and distal to the left subclavian ostium (24). The peak wall stress in aneurysms of the aortic arch is correlated to the overall aneurysm size as expected, but also the eccentricity, which may be a factor in the rupture of small aneurysms (4). Aortic root motion and hypertension have also been shown to significantly increase the wall stress (1). The main limitations of these studies are the use of simplified, isotropic tissue properties, which are not patient-specific (1, 4, 24, 25, 29, 36, 39), idealized geometries (36, 39), and lack of tissue failure criteria (1, 4, 24, 25, 29, 36, 39). In these studies, the peak vessel wall stress was the biomechanical index of interest; however, the accurate AsAA tissue properties and geometries, which can vary greatly among individuals, are necessary for accurate stress prediction. Furthermore, rupture is dependent not only on the vessel wall stress, but also the vessel wall failure strength, which may become compromised in particular patients by underlying microstructural changes brought on by aging (13, 26), disease progression (40), or other factors (12, 35). Therefore, the patient-specific tissue strength and the aortic wall stress are both critical for assessing AsAA rupture potential.
In a previous study from our group (30), the tissue elastic and failure strength properties were characterized for AsAA tissues resected from patients undergoing elective AsAA repair. Patients with concomitant bicuspid aortic valve (BAV) and bovine aortic arch (BAA) were studied specifically to gain a better understanding of why these patients may be more susceptible to AsAA and dissection (10, 14, 42). BAV and BAA are common congenital malformations of the aortic anatomy. In BAV, the aortic valve is formed with only two leaflets rather than the typical three, and in BAA the innominate and left carotid arteries originate from a common stem off the aortic arch rather than distinct branches as in most patients. The mechanical testing data were used to analytically predict the AsAA wall stresses and rupture criteria (23), i.e., AsAA diameter and blood pressure to induce rupture for each patient. Through this analysis, decreased AsAA tissue compliance in addition to increased wall tension was identified as a potential marker for rupture risk. The main limitation of the analytical method (23) was that an idealized cylindrical AsAA geometry was assumed and thus the effect of the patient's specific AsAA geometry on the vessel wall stress was not taken into account. To address this limitation, in the present study, patient-specific AsAA FE models were constructed for a total of 27 patients studied previously (23, 30), for whom cardiac computed tomography (CT) scans were obtained. Utilizing this unique matching dataset of individual patient imaging data, and AsAA tissue elastic and failure properties (30), AsAA rupture risk was assessed on a truly patient-specific level using FE.
MATERIALS AND METHODS
Patient Data
Deidentified clinical cardiac CT scans and resected AsAA tissues were obtained for a total of 27 patients who underwent elective AsAA repair at Yale-New Haven Hospital between the years of 2008 and 2010, following an IRB-approved protocol. All subjects provided written, informed consent. These patients included n = 8 with concomitant BAV (AsAA-BAV), n = 10 with concomitant BAA (AsAA-BAA), and n = 10 with neither BAV nor BAA (AsAA-only). One patient had both BAV and BAA. A set of approximately 100–150 axial CT images with a resolution of 0.7 mm × 0.7 mm × 2.5 mm containing the thoracic and abdominal aorta were obtained for each patient. All patients underwent cardiac CT scans because of suspected AsAA prior to elective repair. The AsAA tissue elastic and failure properties for the same patients were characterized in a previous study (30). Briefly, the tissues were subjected to planar biaxial mechanical testing (33), to determine the tissue stress-strain response for the following circumferential to axial First Piola-Kirchhoff tension, τ, ratios: τc:τa = 0.75:1, 0.5:1, 0.3:1, 1:1, 1:0.75, 1:0.5, 1:0.3. Two strips of tissue were then prepared from the biaxial test specimens: one in the circumferential direction and one in the axial direction. Each strip of tissue was uniaxially stretched to failure to determine the tissue uniaxial stress-strain response in each direction. The following clinical data were also obtained for each patient: the systolic/diastolic blood pressure, age, sex, height, weight, and aneurysm diameter.
Reconstruction of Patient-Specific Systolic AsAA Geometry
The three-dimensional AsAA surface geometry was reconstructed from the clinical CT data for each patient using Avizo 6.3 software (Burlington, MA). The aorta was segmented semiautomatically in Avizo by adjusting the pixel intensity thresholds to isolate the AA geometry from the neighboring tissues (Fig. 1A). The surface geometry was exported from Avizo and imported into Altair HyperMesh 12.0 (Altair Engineering) to create shell-element AsAA FE models containing the ascending aorta (AA) just distal to the sinotubular junction (STJ) to the descending aorta (DA) (Fig. 1B). The AsAA FE models were constructed with 4-node quadrilateral shell elements (S4) approximately 1 mm × 1 mm in size in Abaqus 6.13 FE software (Simulia, RI). Mesh convergence analysis demonstrated that this element size was adequate for accurate stress predictions.
Fig. 1.
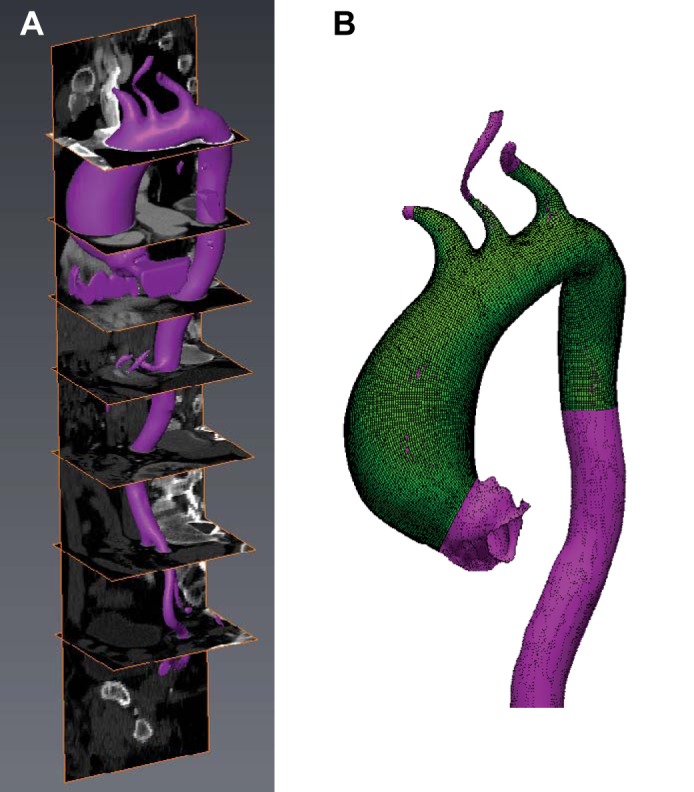
A: segmented ascending aorta aneurysm (AsAA) surface geometry overlaid with 3D CT data in Avizo software. B: AsAA patient-specific finite element (FE) mesh (green) overlaid with original segmented surface geometry (purple).
AsAA FE Modeling
Determine the systolic stretches.
The AsAA FE mesh generated from CT data is in the pressurized condition. The AsAA pressure at that time was assumed to be equivalent to the systolic cuff pressure obtained for that particular patient. For FE analysis, the initial, undeformed AsAA models should be constructed with the AsAA geometries at the zero-stress, unpressurized state. Using the AsAA mesh generated directly from the CT data (i.e., at the pressurized state) for FE analysis would result in unrealistic AsAA dilation. Thus, in this study, the systolic AsAA meshes were transformed to obtain the unpressurized geometry using the following approach. Treating the AsAA as a thin-walled cylindrical pressure vessel as often done (8, 12, 18, 20, 23), the systolic wall tension in the circumferential (systolic hoop tension), tcsys, and axial directions, tasys, are given by the Law of Laplace:
| (1) |
| (2) |
where Psys and Dsys are the systolic AsAA pressure and diameter, respectively. Since the wall tension in the circumferential direction is twice of that in the axial direction, the 1:0.5 circumferential to axial biaxial tension protocol data, collected from the dissected AsAA samples (30), mimics the in vivo loading condition. Following the method presented previously (23), the AsAA tissue stress-stretch response for the 1:0.5 biaxial tension protocol was then extrapolated to the physiological tension level. The circumferential and axial tissue stretches at the systolic condition, λcsys and λasys, respectively, were then inversely determined (Fig. 2).
Fig. 2.
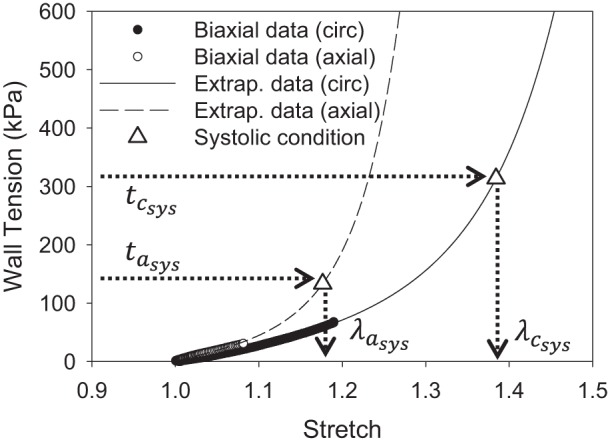
Determination of the systolic stretches in the circumferential and axial directions from the extrapolated biaxial response. tcsys and tasys, systolic wall tension in the circumferential and axial directions, respectively; λcsys and λasys, circumferential and axial tissue stretches at the systolic condition, respectively.
Determine the vessel centerline.
The vessel centerline of each AsAA FE mesh was calculated using a custom Matlab (Mathworks, MA) script. Using the script, each AsAA mesh was graphically divided into approximately 10 roughly cylindrical segments along the length of the aorta (Fig. 3A). For more tortuous vessels, more segments were used. The center point in each segment was determined using the Matlab built-in unconstrained nonlinear optimization function, “fminunc,” to minimize the variance of the array of distances from each node of the mesh within the segment to the center point of the segment. The AsAA centerline was then obtained by fitting the center points for all of the segments with a 3D spline curve (Fig. 3A).
Fig. 3.
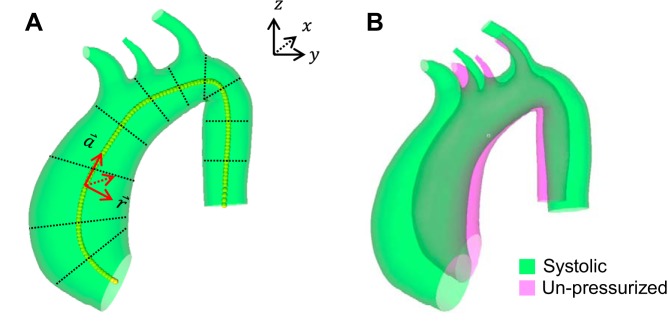
A: schematic of the local cylindrical coordinate system definition based on the AsAA centerline (yellow dots). The black dotted lines illustrate how the aortic geometry was divided into segments to determine the centerline. B: the final unpressurized AsAA mesh overlaid with the original systolic mesh for a representative patient.
The AsAA centerline was used to define a local cylindrical coordinate system for every point (node) in the systolic AsAA mesh. The maximum AsAA diameter at each point along the centerline was calculated in the script by determining the maximum distance between two nodes within the local r − θ plane. The aortic size index (ASI) (5) was calculated along the centerline by dividing the diameter at each location by the patient's body surface area (6).
Transform the systolic AsAA mesh.
The coordinates for each node in the systolic AsAA mesh were transformed to obtain the corresponding nodal coordinates in the unpressurized geometry. To achieve this, each node in the systolic mesh was scaled by 1/λcsys and 1/λasys in the circumferential and axial directions, respectively, as defined by the local cylindrical coordinate system. The resulting shell-element unpressurized AsAA mesh was assigned a uniform thickness equivalent to the patient-specific stress-free tissue thickness (Table 1) measured during the mechanical test protocol (30).
Table 1.
AsAA tissue elastic and failure parameters for each patient
| FUNG Parameters |
|||||||||
|---|---|---|---|---|---|---|---|---|---|
| Patient | C (kPa) | A1 | A2 | A3 | A4 | A5 | A6 | Failure EqStrain, kPa1/2 | Tissue Thickness, mm |
| AsAA1 | 28.987 | 3.358 | 2.906 | 0.482 | 1.000 | −0.277 | 0.046 | 20.882 | 2.028 |
| AsAA3 | 111.111 | 0.968 | 0.808 | 0.359 | 0.120 | −0.033 | −0.008 | 17.957 | 2.412 |
| AsAA6 | 6.464 | 18.950 | 4.549 | 0.814 | 15.481 | 3.814 | 0.295 | 18.309 | 2.348 |
| AsAA9 | 92.424 | 1.057 | 0.727 | 0.284 | 0.015 | −0.020 | −0.009 | 16.445 | 2.128 |
| AsAA10 | 4.431 | 39.536 | 20.198 | −1.033 | 5.000 | 1.590 | −2.036 | 13.629 | 1.914 |
| AsAA11 | 278.315 | 0.775 | 0.495 | 0.166 | 0.029 | −0.028 | 0.001 | 22.178 | 2.460 |
| AsAA13 | 7.554 | 41.120 | 44.886 | 18.289 | 24.680 | 4.061 | −5.829 | 12.736 | 1.900 |
| AsAA14 | 50.309 | 2.878 | 1.828 | 0.690 | 2.543 | −0.369 | −0.237 | 13.874 | 1.850 |
| AsAA15 | 34.244 | 5.145 | 3.646 | 0.535 | 6.473 | −0.873 | 0.247 | 21.477 | 1.960 |
| AAD17 | 41.950 | 2.025 | 1.412 | 0.533 | 1.578 | −0.073 | −0.154 | 13.088 | 2.270 |
| BAV3 | 173.605 | 0.672 | 0.543 | 0.190 | 0.426 | −0.028 | 0.057 | 18.601 | 2.090 |
| BAV6 | 155.608 | 0.717 | 0.595 | 0.232 | 0.671 | 0.106 | −0.012 | 19.941 | 1.896 |
| BAV9 | 30.794 | 4.023 | 1.266 | 0.687 | 1.648 | −0.677 | 0.150 | 16.609 | 1.940 |
| BAV16 | 84.256 | 1.315 | 1.494 | 0.532 | 0.912 | 0.003 | 0.401 | 18.650 | 2.126 |
| BAV17 | 59.449 | 1.628 | 2.280 | 0.605 | 2.165 | 0.030 | 0.108 | 14.702 | 2.202 |
| BAV18 | 52.651 | 1.189 | 1.178 | 0.238 | 1.000 | −0.034 | 0.100 | 11.856 | 1.962 |
| BAV19 | 52.679 | 3.078 | 4.378 | 0.627 | 3.454 | −0.143 | 0.131 | 23.275 | 1.650 |
| BAV20 | 210.227 | 0.352 | 0.457 | 0.086 | 0.038 | −0.001 | −0.014 | 15.102 | 2.138 |
| BAA5 | 113.990 | 1.068 | 1.333 | 0.335 | 0.847 | 0.156 | −0.254 | 20.321 | 1.700 |
| BAA6 | 213.748 | 0.684 | 0.507 | 0.210 | 0.457 | 0.021 | 0.014 | 27.487 | 1.800 |
| BAA7 | 161.095 | 0.915 | 0.569 | 0.253 | 0.327 | −0.003 | 0.024 | 12.564 | 1.812 |
| BAA10 | 21.297 | 18.665 | 12.339 | 5.044 | 10.000 | 7.073 | 4.304 | 14.895 | 1.830 |
| BAA12 | 37.801 | 2.744 | 2.476 | 0.537 | 2.484 | 0.142 | −0.350 | 31.436 | 1.900 |
| BAA14 | 253.512 | 0.516 | 0.381 | 0.143 | 0.247 | 0.022 | −0.004 | 21.782 | 1.812 |
| BAA17 | 159.052 | 1.482 | 1.893 | 0.234 | 0.065 | −0.001 | 0.055 | 26.977 | 2.190 |
| BAA18 | 7.444 | 5.913 | 10.047 | −1.008 | 7.613 | 0.173 | 0.179 | 14.543 | 3.570 |
| BAA19 | 7.482 | 5.892 | 3.530 | −0.457 | 4.985 | −1.315 | 0.142 | 15.954 | 2.868 |
AsAA, ascending aorta aneurysm.
Constitutive Modeling of AsAA Tissue
Tissue elastic properties.
The AsAA tissue elastic properties were modeled with the Fung-type strain energy function given by
| (3) |
| (4) |
where c and A1–6 are material constants and E is the Green strain. The material parameters were obtained by simultaneously fitting the experimental data from stress-controlled biaxial test protocols using the Marquardt-Levenberg nonlinear regression algorithm with SYSTAT 13 software (Systat Software, Chicago, IL). The Fung model parameters for each patient are given in Table 1. Each set of Fung model parameters was checked for convexity and condition number per Sun and Sacks (37), to facilitate FE implementation.
Tissue failure properties.
The equivalent strain (34) from continuum tissue damage theory was used as the tissue failure criteria. The equivalent strain, Ξ, is defined as
| (5) |
Tissue failure was considered when Ξ ≥ Ξf, where Ξf is the failure equivalent strain calculated for each patient by
| (6) |
The failure energy, Wf, was calculated from the uniaxial failure strength test data collected previously (30) by the Simpson's Trapezoid Rule for numerical integration:
| (7) |
where S is the Second Piola Kirchhoff stress, Ef is the Green strain corresponding to the ultimate tensile stress, and N is the number of subintervals within [0,Ef].
The tissue failure criterion was implemented in Abaqus FE software for this study via a user-material subroutine for the Fung-type constitutive model (Eqs. 3 and 4) (37). Elements meeting the failure criteria were deleted from the model via the element deletion utility in Abaqus. The rupture criterion was only applied to the region surrounding the maximum diameter of each model to avoid premature failure due to potential boundary effects. For most patients, uniaxial failure data were obtained for AsAA tissue samples in both the circumferential and axial directions (30), in which case the lower of the two calculated Ξf values was used as the failure criterion. The Ξf values used in each simulation are given in Table 1.
Simulation and Analysis of AsAA Inflation and Rupture
AsAA inflation was simulated in two steps. In step 1, systolic inflation was simulated by applying a peak uniform pressure equal to the specific patient's systolic blood pressure to the luminal surface of the entire vessel model. In step 2, the luminal pressure was slowly increased from the systolic pressure until the vessel ruptured. The AsAA models were left open at the proximal end to mimic the systolic condition in which the aortic valve is open, and closed off at the distal end of the DA, and at the branching arteries along the arch. It is assumed that these boundary conditions had minimal impact on the FE results for the AsAA portion of the models, which was the region of interest. The AsAA model deformation was constrained by two boundary conditions. The nodes along the vessel circumference at the proximal end were only allowed to deform in the radial direction, as defined by the local cylindrical coordinate system. The nodes along the closed portion of the distal end were fixed in all directions. No other constraints were imposed on the model.
The step 1 simulation results were used to measure the AsAA diameter at diastole, Ddias, and systole, Dsys, from the deformed AsAA FE mesh at the corresponding diastolic, Pdias, and systolic, Psys, pressure levels. Each diameter measurement represented the distance between the same 2 nodes in the mesh at the maximum diameter level determined from the centerline analysis. These values were used to calculate the pressure-strain modulus, PSmod, which was shown previously to be an indicator of AsAA rupture risk (23), the tension-strain modulus, TSmod, and the distensibility (20) at Psys, distsys, by
| (8) |
| (9) |
| (10) |
The peak AsAA wall maximum principal stress at systole, MaxSsys, was also extracted from the simulation results at the completion of each simulation step at the maximum diameter level.
The FE predicted Dsys was compared with the maximum diameter of the AsAA mesh reconstructed directly from the CT imaging data representing the “ground truth” systolic diameter. In some cases the simulated and ground-truth AsAA geometries at the systolic condition did not match; thus λcsys was adjusted, the unpressurized AsAA geometry was regenerated, and the simulation was rerun until there was good agreement (within ∼1% error) between the two.
The step 2 simulation results were used to assess the rupture criteria. The failure diameter, Df, was measured on the deformed mesh at the time increment immediately preceding rupture. The diameter risk ratio proposed previously (23), Dsys/Df, was used to indicate rupture risk. As the diameter risk ratio approaches 1, the AsAA reaches its elastic capacity. A diameter risk ratio <0.9 indicates that the AsAA can still dilate over 10% beyond the systolic level before rupturing (low rupture risk), a diameter risk ratio between 0.9 and 0.95 indicates that rupture will occur at 5–10% dilation beyond the systolic level (moderate risk), and a diameter risk ratio >0.95 indicates that rupture will occur at <5% dilation beyond the systolic level (high risk). Considering a 50 mm AsAA and a 1 mm per year growth rate (9) a patient with a Dsys/Df > 0.95 could experience rupture within 2.5 years.
The failure pressure, Pf, was considered to be the applied pressure at the time increment of rupture. The failure diameter, failure pressure, and rupture risk were also analytically predicted using the published method (23) for comparison.
The Pearson product nonparametric test was used to determine correlation between the following patient characteristics and the predicted rupture risk: systolic/diastolic blood pressure, age, sex, ASI, PSmod, TSmod, distsys, MaxSsys, presence of a BAV, and presence of a BAA. For the binary parameter categories, patients received a value of 1 for the presence of BAV, BAA, or male sex and a 0 for an absence of these characteristics. The patients were grouped by AsAA morphology (AsAA-only, AsAA-BAV, and AsAA-BAA) as well as risk level (low, moderate, and high) for comparison. The Student's t-test and nonparametric Mann-Whitney rank sum test were used to compare the means between two groups. Paired Student's t-tests were used to determine differences in analytically and FE predicted values. In all cases a P value ≤ 0.05 was considered to signify a statistically significant event.
RESULTS
The analytical and FE results are presented in Table 2. All values presented in the subsequent sections are given as means ± SD unless specified otherwise.
Table 2.
Summary of results
| Patient Clinical Characteristics |
Analytical Results |
Simulation Results |
Simulation vs. Analytical |
|||||||||||||||||
|---|---|---|---|---|---|---|---|---|---|---|---|---|---|---|---|---|---|---|---|---|
| Patient | Dsys-recorded, mm | Psys-recorded, mmHg | Age | Sex (M = 1) | Peak ASI, cm/m2 | Dsys-measured, mm | Systolic hoop tension, kPa | Df-predicted, mm | Pf-predicted, mmHg | Dsys-predicted, mm | Df-predicted, mm | Pf-predicted, mmHg | PSmod-predicted, kPa | TSmod-predicted, MPa | Distensibility, mmHg−1 × 0.001 | Max Ssys, kPa | Diameter ratio (Dsys/Df) | Dsys, simulation vs. measured, % error | Df simulation vs. analytical, % difference | Pf simulation vs. analytical, % difference |
| AsAA1 | 47 | 130 | 76 | 1 | n/a | 46 | 402 | 50 | 472 | 46 | 51 | 554 | 151 | 3.74 | 1.91 | 450 | 0.91 | 0.55 | 1.20 | 17.38 |
| AsAA3 | 48 | 101 | 52 | 1 | 2.3 | 46 | 310 | 56 | 448 | 46 | 52 | 283 | 80 | 2.03 | 3.32 | 264 | 0.88 | 0.30 | 7.92 | 36.74 |
| AsAA6 | 49 | 150 | 69 | 0 | 2.7 | 48 | 478 | 48 | 157 | 48 | 48 | 154 | 420 | 10.28 | 0.60 | 574 | 1.00 | 0.02 | 0.14 | 2.08 |
| AsAA9 | 47 | 131 | 66 | 1 | n/a | 47 | 406 | 53 | 498 | 47 | 49 | 222 | 85 | 2.19 | 2.54 | 525 | 0.95 | 0.24 | 7.79 | 55.46 |
| AsAA10 | 52 | 147 | 73 | 1 | 1.8 | 39 | 386 | 41 | 848 | 39 | 40 | 411 | 646 | 12.85 | 0.66 | 494 | 0.98 | 0.75 | 2.21 | 51.53 |
| AsAA11 | 50 | 178 | 73 | 1 | n/a | 46 | 543 | 54 | 547 | 46 | 51 | 439 | 110 | 2.78 | 2.26 | 516 | 0.90 | 0.45 | 5.82 | 19.80 |
| AsAA13 | 46 | 138 | 69 | 0 | 3.5 | 48 | 437 | 49 | 382 | 48 | 49 | 459 | 434 | 10.57 | 0.56 | 518 | 0.97 | 0.09 | 0.27 | 20.30 |
| AsAA14 | 44 | 128 | 59 | 1 | 2.1 | 45 | 381 | 49 | 423 | 45 | 47 | 248 | 126 | 2.99 | 1.94 | 517 | 0.95 | 0.15 | 4.03 | 41.35 |
| AsAA15 | 59 | 128 | 60 | 1 | 1.8 | 41 | 350 | 47 | 1067 | 41 | 45 | 748 | 173 | 3.71 | 1.71 | 402 | 0.91 | 0.86 | 3.62 | 29.85 |
| AsAA17 | 53 | 119 | 59 | 1 | 2.1 | 45 | 354 | 51 | 625 | 44 | 46 | 207 | 128 | 3.05 | 2.04 | 447 | 0.96 | 0.54 | 8.42 | 66.81 |
| BAV3 | 62 | 144 | 45 | 1 | 2.8 | 53 | 512 | 63 | 653 | 53 | 56 | 245 | 102 | 2.99 | 2.35 | 642 | 0.95 | 0.32 | 9.92 | 62.47 |
| BAV6 | 43.5 | 119 | 48 | 1 | 2.3 | 50 | 399 | 59 | 454 | 50 | 54 | 246 | 80 | 2.19 | 3.28 | 541 | 0.93 | 0.95 | 7.90 | 45.83 |
| BAV9 | 52 | 105 | 48 | 1 | 2.5 | 52 | 366 | 58 | 886 | 52 | 55 | 216 | 160 | 4.43 | 1.56 | 631 | 0.96 | 0.05 | 6.53 | 75.62 |
| BAV16* | 52 | 131 | 59 | 1 | 2.7 | 52 | 455 | 60 | 667 | 52 | 57 | 409 | 117 | 3.28 | 2.38 | 421 | 0.91 | 0.50 | 4.26 | 38.65 |
| BAV17 | 49 | 104 | 64 | 0 | 2.7 | 50 | 349 | 56 | 341 | 50 | 55 | 278 | 109 | 2.97 | 2.54 | 332 | 0.92 | 0.41 | 2.98 | 18.56 |
| BAV18 | 46 | 75 | 62 | 0 | 2.5 | 49 | 246 | 56 | 270 | 49 | 51 | 117 | 67 | 1.78 | 4.43 | 361 | 0.96 | 0.77 | 8.36 | 56.51 |
| BAV19 | 53 | 134 | 66 | 1 | 3.3 | 54 | 485 | 60 | 606 | 54 | 60 | 852 | 156 | 4.50 | 1.65 | 493 | 0.91 | 0.38 | 0.75 | 40.47 |
| BAV20 | 51 | 133 | 52 | 1 | 2.4 | 47 | 419 | 53 | 290 | 47 | 49 | 174 | 77 | 2.04 | 3.44 | 456 | 0.97 | 0.63 | 8.61 | 40.08 |
| BAA5 | 50 | 128 | 56 | 1 | 2.3 | 50 | 428 | 58 | 705 | 50 | 54 | 315 | 90 | 2.49 | 2.87 | 710 | 0.92 | 0.99 | 6.98 | 55.36 |
| BAA6 | 49 | 97 | 47 | 1 | 2.3 | 48 | 309 | 58 | 336 | 47 | 51 | 170 | 65 | 1.72 | 4.42 | 371 | 0.94 | 0.84 | 11.61 | 49.54 |
| BAA7 | 52 | 139 | 56 | 1 | 2.3 | 46 | 424 | 49 | 289 | 46 | 46 | 139 | 97 | 2.50 | 2.25 | 492 | 1.00 | 0.47 | 6.72 | 51.79 |
| BAA10 | 47 | 136 | 57 | 1 | n/a | 51 | 466 | 54 | 456 | 51 | 52 | 227 | 303 | 7.97 | 1.14 | 967 | 0.99 | 1.06 | 3.73 | 50.26 |
| BAA12 | 51 | 105 | 71 | 1 | 2.1 | 45 | 312 | 53 | 1623 | 45 | 52 | 1515 | 121 | 2.90 | 2.04 | 354 | 0.82 | 0.08 | 1.11 | 6.63 |
| BAA14 | 40 | 136 | 33 | 1 | 1.9 | 39 | 355 | 47 | 505 | 39 | 44 | 374 | 69 | 1.48 | 3.36 | 423 | 0.88 | 0.53 | 5.64 | 25.87 |
| BAA17 | 50 | 155 | 44 | 1 | 1.6 | 34 | 351 | 41 | 741 | 34 | 41 | 1151 | 104 | 1.93 | 2.37 | 329 | 0.82 | 0.37 | 0.91 | 55.48 |
| BAA18 | 56 | 117 | 56 | 0 | 3.0 | 58 | 454 | 64 | 684 | 58 | 61 | 412 | 179 | 5.39 | 1.52 | 400 | 0.95 | 0.27 | 3.91 | 39.79 |
| BAA19 | 55 | 123 | 68 | 1 | 2.8 | 50 | 413 | 54 | 699 | 50 | 54 | 471 | 203 | 5.32 | 1.18 | 488 | 0.94 | 0.11 | 1.49 | 32.60 |
| Mean | 50 | 127 | 59 | 22/27 | 2.43 | 47 | 400 | 53 | 580 | 47 | 51 | 409 | 165 | 4.08 | 2.23 | 486 | 0.93 | 0.47 | 4.92 | 40.25 |
| SD | 5 | 21 | 10 | 19/48 | 0.48 | 5 | 68 | 6 | 296 | 5 | 5 | 323 | 136 | 2.96 | 1.03 | 140 | 0.05 | 0.31 | 3.28 | 18.26 |
BAV, bicuspid aortic valve; BAA, bovine aortic arch; Dsys, diameter at systole; Psys, systolic pressure; Df, diameter at failure; Pf, failure pressure; PSmod, pressure-strain modulus; TSmod, tension-strain modulus; D.
Patient with both BAV and BAA.
AsAA Systolic Inflation Simulation
Each unpressurized AsAA model was inflated with a uniform systolic pressure. The FE deformed meshes at systole were compared with the original meshes generated from the surface geometries segmented from the CT data. The inaccurate boundary conditions (closed vessel) and loading conditions at the branching vessels and DA resulted in discrepancies between the FE deformed geometry and the original CT systolic geometry surrounding these locations; however, the AA portion of the deformed FE mesh matched the ground truth. Figure 4 shows the AA portion of the FE deformed geometry at systole for patient BAV19 overlaid with the initial CT surface geometry. The FE predicted systolic AsAA diameter for patient BAV19 was 54.1 mm compared with the ground truth diameter of 54.3 mm, giving a percent error of 0.38%. The percent error in the FE predicted systolic diameter for all the patients studied was only 0.47 ± 0.31%. Therefore, the FE simulations resulted in realistic AsAA deformation under uniform pressurization. Representative systolic inflation simulation results are shown in Fig. 5, top panel. The wall stress distribution was highly dependent on the unique AsAA geometry, but the peak wall stress was typically located along the inner curvature of the vessel at the maximum diameter level. There was no difference in the mean peak systolic wall stress between the patient groups. The mean maximum principal stress at systole was 471 ± 88 kPa for AsAA-only patients, 484 ± 115 kPa for AsAA-BAV patients, and 496 ± 198 kPa for AsAA-BAA patients.
Fig. 4.
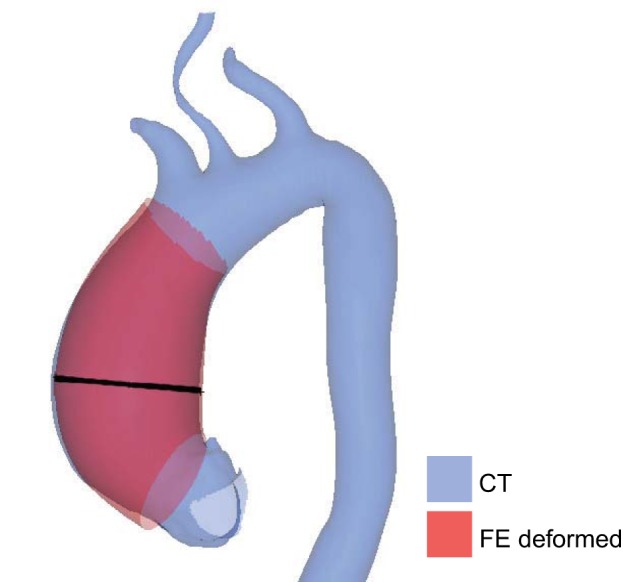
Overlay of the FE deformed AsAA geometry under systolic pressurization and the original systolic AsAA surface geometry segmented from the CT data showing good correspondence. The black line indicates the location of the maximum AsAA diameter measurement.
Fig. 5.

Representative patient-specific FE results. A: patient BAA12 results, representing essentially no risk, showing rupture on the outer curvature at a pressure of 14 × Psys. B: patient BAV19 results, representing low risk, showing rupture on the anterior side at a pressure of 6 × Psys. C: patient AsAA3 results, representing moderate risk, showing rupture on the inner curvature at a pressure of 3 × Psys. D: patient BAA7 results, representing high risk, showing rupture on the inner curvature at a pressure of 1 × Psys. The black arrows indicate the rupture location.
AsAA Rupture Simulation
AsAA rupture in the maximum diameter region was simulated in each FE model by incrementally increasing the luminal pressure from the patient-specific systolic pressure until rupture was achieved. The mean predicted rupture diameter and pressure was 51 ± 5 mm and 409 ± 323 mmHg, respectively. The analytically predicted AsAA failure diameters were 1 mm larger than the FE predicted failure diameters on average (P = 0.029) corresponding to a 5% difference. The differences between the FE and analytically predicted rupture pressures were much larger on average, approximately 40%, although they were not significantly different (P = 0.147). Typically the analytically predicted rupture criteria were slightly larger than the FE predicted values; thus rupture risk could be underestimated in the analytical predictions.
Representative simulation results at rupture are shown in Fig. 5, bottom panel. The predicted failure diameters for patient BAA12 (Fig. 5A), BAV19 (Fig. 5B), AsAA3 (Fig. 5C), and BAA7 (Fig. 5D) were 52, 60, 52, and 46 mm, respectively. The predicted failure pressures for these patients were 1,515, 842, 283, and 139 mmHg, respectively. Rupture was typically initiated along the inner curvature (n = 12) (Fig. 5, C and D) or the anterior quadrant (n = 13) (Fig. 5B), and less frequently along the outer curvature (n = 1) (Fig. 5A) and posterior quadrant (n = 1). The rupture location generally correlated with the peak systolic stress location. Rupture propagated circumferentially in 3 of 10 AsAA-only models, 4 of 8 AsAA-BAV models, for instance the one shown in Fig. 5B, and 6 of 10 AsAA-BAA models. Rupture propagated axially in the remaining models, as in Fig. 5C. All of the results are presented in Table 2.
Fig. 6.
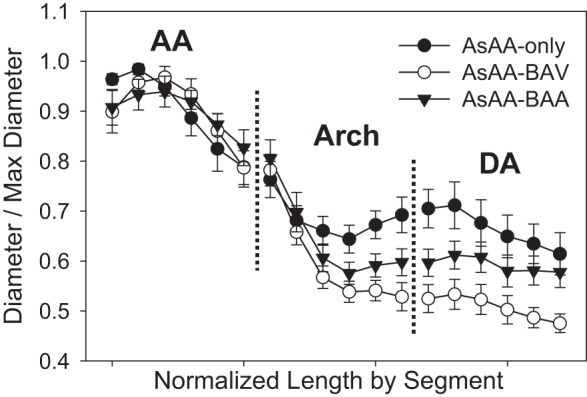
The mean normalized aortic diameter along the length of the vessel centerline for the AA, arch, and DA segments starting at the STJ and moving distally. (Plots shown as mean ± SE for clarity.) BAV, bicuspid aortic valve; BAA, bovine aortic arch.
Analysis of AsAA Morphology
There were AsAA morphological differences between the patient groups. The AsAA-BAV patients had larger systolic diameters than the AsAA-only patients (51 ± 2 vs. 45 ± 3 mm, P = 0.010). There was no significant difference in the mean systolic diameters between the AsAA-BAA (47 ± 7 mm) and the other groups. In all cases, the peak vessel diameter was located along the ascending portion of the aorta. However, as shown in Fig. 6, the AsAA-only patients typically presented with a peak diameter in the proximal AA and more dilation in the arch and DA, particularly at the isthmus, compared with the other groups. The AsAA-BAV patients presented with pronounced dilation in the middle of the AA and nearly no dilation in the DA, and the AsAA-BAA patients presented with more uniform dilation throughout the AA with some dilation in the arch and DA (Fig. 6).
The mean peak ASI for patients with a diameter risk ratio <0.9 was significantly less than that for patients with a diameter risk ratio >0.9 (2.0 ± 0.3 vs. 2.5 ± 0.4, P = 0.024). Figure 7 shows a trend for patients with a high diameter risk ratio to have increased ASI values in the AA. The ASI in the descending portion of the aorta was similar for all groups, but slightly larger for patients with a diameter ratio >0.95 at the isthmus. Patients with a small diameter risk ratio tended to have more uniform dilation along the length of the aorta, particularly in the AA.
Fig. 7.
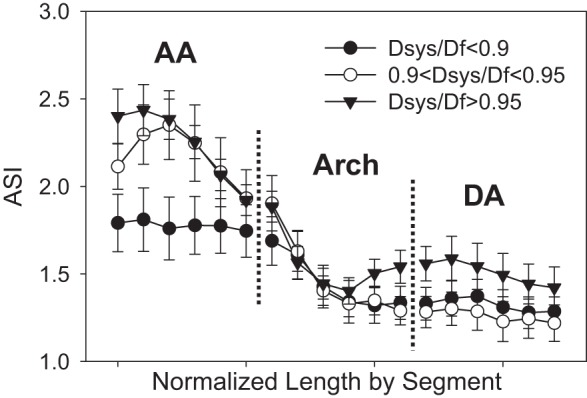
The mean aortic size index (ASI) along the length of the vessel centerline for the AA, arch, and DA segments. (Plots shown as mean ± SE for clarity).
Analysis of AsAA Rupture Risk
AsAA-BAV patients had larger predicted failure diameters compared with AsAA-only patients (55 ± 4 vs. 48 ± 3 mm, P = 0.014) (Fig. 8), but similar to AsAA-BAA patients (51 ± 6 mm). However, there were no significant differences in the predicted rupture pressures between the groups. AsAA-only, AsAA-BAV, and AsAA-BAA patients had mean rupture pressures of 373 ± 185, 317 ± 232, and 518 ± 451 mmHg, respectively (Fig. 8).
Fig. 8.
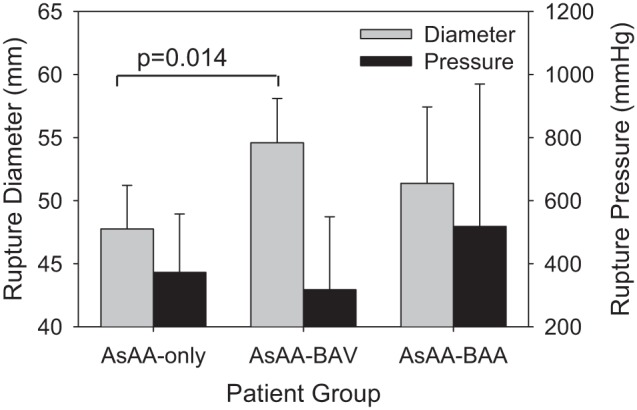
The predicted AsAA diameter and blood pressure at rupture for each patient group.
The predicted rupture pressure decreased dramatically with increasing diameter risk ratio. The mean predicted rupture pressure for patients with a diameter risk ratio <0.9 was 753 ± 548 mmHg compared with 427 ± 217 mmHg for patients with a diameter risk ratio between 0.9 and 0.95, and 234 ± 108 mmHg for patients with a diameter risk ratio >0.95 (Fig. 9A). The diameter risk ratio was also positively correlated with the peak systolic wall stress (ρ = 0.497, P = 0.008), the pressure-strain modulus (ρ = 0.413, P = 0.0322), and the tension-strain modulus (ρ = 0.466, P = 0.014). Figure 9, B and C, shows increasing wall stress and tension-strain modulus with increasing diameter risk ratio. Interestingly, there was not a clear trend between the maximum systolic diameter and the diameter risk ratio. The mean predicted systolic diameter was significantly smaller for patients with a diameter risk ratio <0.9 (42 ± 5 mm) compared with those with a diameter risk ratio between 0.9 and 0.95 (P = 0.002), and greater than 0.95 (P = 0.033); however, the mean systolic diameter was actually highest in the patients with a diameter risk ratio between 0.9 and 0.95 (Fig. 9D).
Fig. 9.

The FE predicted mean rupture pressure (A) and peak systolic maximum principal stress (B), and the clinically measurable maximum tension-strain modulus (C) and systolic diameter (D) for patients of each diameter risk ratio level.
Other trends observed were positive correlation between the tension-strain modulus and patient age (ρ = 0.476, P = 0.012), as well as between the female sex and ASI (ρ = 0.528, P = 0.010) due to the smaller body surface areas (ρ = 0.547, P = 0.007) and similar aortic diameters (ρ = −0.308, P = 0.119) of female patients. Trends approaching statistical significance were positive correlation between the diameter risk ratio and the systolic hoop tension (ρ = 0.369, P = 0.058), the tension-strain modulus and peak systolic wall stress (ρ = 0.360, P = 0.065), as well as the tension-strain modulus and the female gender (ρ = 0.349, P = 0.075).
DISCUSSION
AsAA Biomechanics at Systole
The predicted AsAA wall stresses at systole were consistent with thoracic aorta FE results in the literature. The peak vessel wall stress was typically located along the inner curvature of the AsAA at the maximum diameter level, consistent with published FE results for the nondilated (24) and dilated thoracic aorta (25). The peak wall stress was typically higher in larger AsAAs, as seen in aortic arch aneurysm FE models (4), although the correlation between peak systolic stress and diameter was not significant (ρ = 0.324, P = 0.099). The peak wall stress also tended to increase with blood pressure as in thoracic aorta FE models (1), but this trend was also not significant (ρ = 0.340, P = 0.083). The systolic inflation simulation results were also consistent with in vivo measurements of AsAA biomechanics. Koullias et al. (20) quantified the in vivo AsAA distensibility in 33 patients using epiaortic echocardiography and found that the dilated AA has a distensibility of 2.498 ± 0.35 mmHg−1 × 0.001, which is very similar to the mean AsAA distensibility calculated in this study (2.23 ± 1.03 mmHg−1 × 0.001).
AsAA Rupture Characteristics
The mean predicted AsAA failure diameter of 51 ± 5 mm is consistent with the clinical finding that most dissections occur in AsAAs that are between 50 and 54 mm in diameter (9). The analytically predicted failure diameter of 53 ± 6 mm also falls within this range. The discrepancies in the analytical and FE predicted values arise because the analytical predictions were made based on the wall stresses calculated by the Laplace law, i.e., a thin-walled idealized cylindrical geometry was assumed, while the FE predictions were made based on the wall stresses in the true patient-specific geometry. The hoop stress calculated by the law of Laplace represents the approximate average circumferential wall stress experienced in the true vessel at the maximum diameter level, but the peak wall stress was often higher due to local curvature and eccentricity. Differences in the local loading conditions also contributed to the discrepancies in the results. While in the analytical cases a perfectly cylindrical geometry and ratio of circumferential to axial wall stresses of 1:0.5 was assumed, in regions of pronounced dilation the vessel becomes less cylindrical and more spherical, and thus the ratio of circumferential to axial wall stresses may be closer to 1:1. The differences in the analytical and FE predicted rupture pressures were much larger than those for the rupture diameter due to the nature of the nonlinear pressure-diameter response where small changes in diameter result in large changes in pressure at high (rupture level) pressures. This effect contributed to the large range of predicted rupture pressures (117-1,515 mmHg).
Each patient's risk of rupture was quantified by the diameter risk ratio. The predicted rupture pressures dropped off dramatically with increasing diameter risk ratio. Note that the predicted rupture pressure for the high risk group (Dsys/Df > 0.95) was 234 ± 108 mmHg, which is in the range of blood pressures observed during intense physical or emotional exertion (9). The diameter risk ratio was most closely correlated with the peak vessel wall stress and the tension-strain modulus. This finding is consistent with clinical observations that wall stress increases (20) and distensibility decreases as the aorta enlarges (20, 21), and also in vitro mechanical testing data of AA tissues showing increased stiffness in dilated samples compared with nondilated controls (17, 40). While it is well accepted that vessel rupture risk is related to the peak vessel wall stress, the association between rupture risk and tissue stiffness is a relatively new finding (23). Increased tissue stiffness may be associated with detrimental microstructural changes such as elastin fragmentation (17), that may weaken the tissue. In fact there was a trend for decreased failure equivalent strain with increased tension-strain modulus (ρ = −0.332, P = 0.091), similar to the decreased yield stress observed in abdominal aorta aneurysm samples with increased stiffness (19).
Interestingly, the systolic hoop tension was not significantly correlated with the diameter risk ratio, indicating that the patient-specific geometry and tissue properties are necessary to accurately predict the vessel wall stresses. Unfortunately, obtaining patient-specific AsAA material properties for preoperative evaluation is a challenge that remains to be addressed. Inverse FE methods to determine the in vivo tissue properties must be further explored before this can be achieved. The tension-strain modulus may be a more practical clinical metric of rupture risk because it is much simpler to calculate, and was able to better differentiate moderate- and high-risk patients than the AsAA diameter in this study. Pulse wave velocity measurements could also be beneficial in assessing AsAA wall stiffness in vivo (2, 22). The ASI can also be used to identify patients at low risk of rupture (ASI < 2).
Effect of BAV and BAA
One possible explanation for the differences in AsAA morphologies between the disease groups is likely differences in aortic hemodynamics. The AsAA-only patients exhibited less bulging of the AA than the AsAA-BAV and AsAA-BAA patients, which may be due to more homogeneous AA flow. The increased DA dilation in AsAA-only patients may have been an aging effect. The AsAA-only patients were older than the AsAA-BAV (P = 0.017) and AsAA-BAA patients (P = 0.021) by 10 and 11 years, respectively, and even the nonaneurysmal aorta will dilate with aging. The pronounced AA dilation in AsAA-BAV patients may have been a result of elevated AA wall stresses of BAV patients due to eccentric aortic flow near the valve (29). There has been little study on BAA-associated hemodynamics, but clinically thoracic aortic dissections more commonly initiate in the aortic arch in patients with BAA as opposed to the AA in patients without BAA (7), which suggests that BAA patients have altered arch hemodynamics and may explain the distal AA dilation in the AsAA-BAA patients studied.
The overall peak systolic wall stress was similar for all of the patient groups. This finding is in contrast to the results from Nathan et al. (25). Nathan et al. (25) used patient-specific FE models of the thoracic aorta to predict the AA wall stresses in diameter-matched BAV and tricuspid aortic valve patients and found that peak wall stresses were higher and oriented differently in BAV patients (540 ± 60 vs. 500 ± 90 kPa). While the peak wall stresses predicted in the present study are within the same range (484 ± 115 vs. 471 ± 88 kPa), there was no difference between the groups. The discrepancy in the results compared with Nathan et al. (25) may be due to differences in the material properties used. In Nathan et al. (25), BAV and tricuspid aortic valve patients were assumed to have the same AsAA material properties, which were modeled as linear and isotropic. In the present study, the FE models were assigned the patient-specific material properties defined by the nonlinear and anisotropic Fung-type constitutive model.
There was, however, a significant difference in the predicted failure diameters between the patient groups, with AsAA-BAV patients having the largest predicted failure diameters. This is in agreement with the International Registry of Acute Aortic Dissections report that the proportion of dissections occurring at smaller sizes (<55 mm) was actually higher among patients without BAV or Marfan syndrome (27, 38). It is suggested that patients with BAV have a ninefold increased risk of AsAA dissection compared with those with tricuspid aortic valve (21, 31). Of the patients studied, 75% of the AsAA-BAV patients had predicted rupture pressures within the physiological range (<300 mmHg), while only 50% of the AsAA-only and 30% of the AsAA-BAA patients had predicted rupture pressures within this range, which suggests that patients with concomitant BAV may be at higher risk of rupture; however, there was no statistically significant difference in the mean rupture pressures predicted for the three groups. The elevated dissection risk in BAV patients observed clinically may also be due to the reduced delamination strength of these tissues (28), which was not considered in this study.
Limitations
The sample size was small for statistical analysis. For this reason, AsAA-BAV and AsAA-BAA patients were grouped together regardless of specific morphology, i.e., leaflet fusion types in BAV and artery branching in BAA, which may play a role in AsAA mechanics. Also, the AsAA-BAV and AsAA-BAA patients were not age- and size-matched with the AsAA-only patients, which made it difficult to compare these groups.
Several simplifications were also made in the FE models. The CT data used in this study were not gated and there could be some error in the reconstructed AsAA models and presented diameter measurements due to the resolution of the images. Vessel residual stress was ignored in this analysis, because the dissected aneurysm samples obtained were already cut into small square specimens and in the stress-free state; thus, it was not possible to measure the residual stresses. Therefore, 2D shell elements were utilized to represent the neutral axis wall response. The AsAA tissue properties were assumed to be homogeneous throughout the FE models, because only one small AsAA sample from the maximum diameter region was tested for each patient (30); however, AsAA tissues may exhibit local weakening and thinning (32). In the future, growth and remodeling constitutive modeling frameworks, such as that proposed by Humphrey and Rajagopal (15), may be incorporated into the AsAA FE models, to investigate local tissue property changes, global AsAA growth, and rupture potential over time with the progression of disease. Also, the AsAA tissue failure properties used in models were based on uniaxial failure experiments (30), while in vivo AsAA rupture occurs under multiaxial loading conditions. Vessel inflation was simulated by applying a uniform pressure to the luminal surface, and hence fluid flow was ignored. The luminal pressure was assumed to be equivalent to the patient's cuff pressure. Therefore, peak wall stresses may have been underestimated, particularly in BAV patients, in which the AA blood flow is highly eccentric (29). Also, AsAA dissection was not modeled because it is assumed to be related to wall shear stress induced by the blood flow. Finally, because all of the patients studied received elective AsAA repair prior to dissection or rupture, validation of the rupture predictions is not feasible.
Conclusions
In this study, 27 patient-specific AsAA FE models were constructed from clinical CT imaging data and tissue mechanical testing data from matching patients. AsAA inflation was simulated under systolic pressure to visualize the physiological wall stresses, and supraphysiological pressures to assess rupture potential. Patients at low risk of rupture tended to have ASI values less than 2. Vulnerable AsAAs tended to have elevated wall stresses and increased tissue stiffness. There was no association between the overall AsAA diameter and the rupture risk. These results support the use of mechanical parameters for AsAA presurgical evaluation. The presence of a BAV or BAA had an impact on the AsAA morphology, but not on the risk of AsAA rupture. However, by using a strictly structural approach, the vessel wall stresses may have been underestimated particularly in the BAV patients where the AA flow is highly eccentric. Future fluid-structure interaction analyses will be important for assessing the impact of the AsAA hemodynamics on rupture and dissection risk.
GRANTS
Research for this project was funded in part by National Heart, Lung, and Blood Institute (NHLBI) Grants HL-104080 and HL-108240. C. Martin is also supported by an NHLBI F31 HL-112632 predoctoral fellowship.
DISCLOSURES
No conflicts of interest, financial or otherwise, are declared by the author(s).
AUTHOR CONTRIBUTIONS
Author contributions: C.M., W.S., and J.E. conception and design of research; C.M. performed experiments; C.M. analyzed data; C.M. and W.S. interpreted results of experiments; C.M. prepared figures; C.M. drafted manuscript; C.M. and W.S. edited and revised manuscript; C.M., W.S., and J.E. approved final version of manuscript.
ACKNOWLEDGMENTS
We thank L. Ondere, M. Zafar, and A. Sang for assistance in collecting the patient data, Dr. T. Pham for providing the tissue mechanical testing data, and J. Hair for constructing the FE models.
REFERENCES
- 1.Beller CJ, Labrosse MR, Thubrikar MJ, Robicsek F. Role of aortic root motion in the pathogenesis of aortic dissection. Circulation 109: 763–769, 2004. [DOI] [PubMed] [Google Scholar]
- 2.Blacher J, Asmar R, Djane S, London GM, Safar ME. Aortic pulse wave velocity as a marker of cardiovascular risk in hypertensive patients. Hypertension 33: 1111–1117, 1999. [DOI] [PubMed] [Google Scholar]
- 3.Bonow R, Carabello B, de Leon A, Edmunds LJ, Fedderly B, Freed M, Gaasch W, McKay C, Nishimura R, O'Gara P, O'Rourke R, Rahimtoola S, Ritchie J, Cheitlin M, Eagle K, Gardner T, Garson AJ, Gibbons R, Russel R, Ryan T, Smith SJ. ACC/AHA Guidelines for the Management of Patients with Valvular Heart Disease. Executive Summary A report of the American College of Cardiology/American Heart Association Task Force on Practice Guidelines (Committee on Management of Patients With Valvular Heart Disease). J Heart Valve Dis 7: 672–707, 1998. [PubMed] [Google Scholar]
- 4.Celi S, Berti S. Three-dimensional sensitivity assessment of thoracic aortic aneurysm wall stress: a probabilistic finite-element study. Eur J Cardiothorac Surg 45: 467–475, 2014. [DOI] [PubMed] [Google Scholar]
- 5.Davies RR, Gallo A, Coady MA, Tellides G, Botta DM, Burke B, Coe MP, Kopf GS, Elefteriades JA. Novel measurement of relative aortic size predicts rupture of thoracic aortic aneurysms. Ann Thorac Surg 81: 169–177, 2006. [DOI] [PubMed] [Google Scholar]
- 6.Du Bois D, Du Bois E. A formula to estimate the approximate surface area if height and weight be known. 1916. Nutrition 5: 303–311; discussion 312–303, 1989. [PubMed] [Google Scholar]
- 7.Dumfarth J, Plaikner M, Krapf C, Bonaros N, Semsroth S, Rizzo JA, Fang H, Grimm M, Elefteriades JA, Schachner T. Bovine aortic arch: predictor of entry site and risk factor for neurologic injury in acute type A dissection. Ann Thorac Surg 98: 1339–1346, 2014. [DOI] [PubMed] [Google Scholar]
- 8.Duprey A, Khanafer K, Schlicht M, Avril S, Williams D, Berguer R. In vitro characterisation of physiological and maximum elastic modulus of ascending thoracic aortic aneurysms using uniaxial tensile testing. Eur J Vasc Endovasc Surg 39: 700–707, 2010. [DOI] [PubMed] [Google Scholar]
- 9.Elefteriades JA, Farkas EA. Thoracic aortic aneurysm: clinically pertinent controversies and uncertainties. J Am Coll Cardiol 55: 841–857, 2010. [DOI] [PubMed] [Google Scholar]
- 10.Fedak PWM, Verma S, David TE, Leask RL, Weisel RD, Butany J. Clinical and pathophysiological implications of a bicuspid aortic valve. Circulation 106: 900–904, 2002. [DOI] [PubMed] [Google Scholar]
- 11.Fillinger MF, Racusin J, Baker RK, Cronenwett JL, Teutelink A, Schermerhorn ML, Zwolak RM, Powell RJ, Walsh DB, Rzucidlo EM. Anatomic characteristics of ruptured abdominal aortic aneurysm on conventional CT scans: implications for rupture risk. J Vasc Surg 39: 1243–1252, 2004. [DOI] [PubMed] [Google Scholar]
- 12.García-Herrera CM, Atienza JM, Rojo FJ, Claes E, Guinea GV, Celentano DJ, García-Montero C, Burgos RL. Mechanical behaviour and rupture of normal and pathological human ascending aortic wall. Med Biol Eng Comput 50: 559–566, 2012. [DOI] [PubMed] [Google Scholar]
- 13.Guinea GV, Atienza JM, Rojo FJ, Garcia-Herrera CM, Yiqun L, Claes E, Goicolea JM, Garcia-Montero C, Burgos RL, Goicolea FJ, Elices M. Factors influencing the mechanical behaviour of healthy human descending thoracic aorta. Physiol Measurement 31: 1553–1565, 2010. [DOI] [PubMed] [Google Scholar]
- 14.Hornick M, Mommiaie R, Mojibian H, Tranquilli M, Elefteriades JA. Bovine arch—a marker for thoracic aortic aneurysm. In: Proceedings of the 15th World Congress on Heart Disease. Vancouver, British Columbia, Canada: 2010. [Google Scholar]
- 15.Humphrey JD, Rajagopal KR. A constrained mixture model for growth and remodeling of soft tissues. Math Models Methods Appl Sci 12: 407–430, 2002. [Google Scholar]
- 16.Humphrey JD, Taylor CA. Intracranial and abdominal aortic aneurysms: similarities, differences, and need for a new class of computational models. Annu Rev Biomed Eng 10: 221–246, 2008. [DOI] [PMC free article] [PubMed] [Google Scholar]
- 17.Iliopoulos DC, Kritharis EP, Giagini AT, Papadodima SA, Sokolis DP. Ascending thoracic aortic aneurysms are associated with compositional remodeling and vessel stiffening but not weakening in age-matched subjects. J Thorac Cardiovasc Surg 137: 101–109, 2009. [DOI] [PubMed] [Google Scholar]
- 18.Khanafer K, Duprey A, Zainal M, Schlicht M, Williams D, Berguer R. Determination of the elastic modulus of ascending thoracic aortic aneurysm at different ranges of pressure using uniaxial tensile testing. J Thorac Cardiovasc Surg 142: 682–686, 2011. [DOI] [PubMed] [Google Scholar]
- 19.Kleinstreuer C, Li Z, Farber MA. Fluid-structure interaction analyses of stented abdominal aortic aneurysms. Annu Rev Biomed Eng 9: 169–204, 2007. [DOI] [PubMed] [Google Scholar]
- 20.Koullias G, Modak R, Tranquilli M, Korkolis DP, Barash P, Elefteriades JA. Mechanical deterioration underlies malignant behavior of aneurysmal human ascending aorta. J Thorac Cardiovasc Surg 130: 677, e671-677, e679, 2005. [DOI] [PubMed] [Google Scholar]
- 21.Lee JJ, D'Ancona G, Amaducci A, Follis F, Pilato M, Pasta S. Role of computational modeling in thoracic aortic pathology: a review. J Card Surg 29: 653–662, 2014. [DOI] [PubMed] [Google Scholar]
- 22.Li RX, Luo J, Balaram SK, Chaudhry FA, Shahmirzadi D, Konofagou EE. Pulse wave imaging in normal, hypertensive and aneurysmal human aortas in vivo: a feasibility study. Phys Med Biol 58: 4549–4562, 2013. [DOI] [PMC free article] [PubMed] [Google Scholar]
- 23.Martin C, Sun W, Pham T, Elefteriades J. Predictive biomechanical analysis of ascending aortic aneurysm rupture potential. Acta Biomaterialia 9: 9392–9400, 2013. [DOI] [PMC free article] [PubMed] [Google Scholar]
- 24.Nathan DP, Xu C, Gorman Iii JH, Fairman RM, Bavaria JE, Gorman RC, Chandran KB, Jackson BM. Pathogenesis of acute aortic dissection: a finite element stress analysis. Annals Thorac Surg 91: 458–463, 2011. [DOI] [PubMed] [Google Scholar]
- 25.Nathan DP, Xu C, Plappert T, Desjardins B, Gorman JH 3rd, Bavaria JE, Gorman RC, Chandran KB, Jackson BM. Increased ascending aortic wall stress in patients with bicuspid aortic valves. Annals Thorac Surg 92: 1384–1389, 2011. [DOI] [PMC free article] [PubMed] [Google Scholar]
- 26.Okamoto RJ, Wagenseil JE, DeLong WR, Peterson SJ, Kouchoukos NT, Sundt TM 3rd. Mechanical properties of dilated human ascending aorta. Ann Biomed Eng 30: 624–635, 2002. [DOI] [PubMed] [Google Scholar]
- 27.Pape LA, Tsai TT, Isselbacher EM, Oh JK, O'Gara PT, Evangelista A, Fattori R, Meinhardt G, Trimarchi S, Bossone E, Suzuki T, Cooper JV, Froehlich JB, Nienaber CA, Eagle KA; International Registry of Acute Aortic Dissection. Aortic diameter > or =5.5 cm is not a good predictor of type A aortic dissection. Circulation 116: 1120–1127, 2007. [DOI] [PubMed] [Google Scholar]
- 28.Pasta S, Phillippi JA, Gleason TG, Vorp DA. Effect of aneurysm on the mechanical dissection properties of the human ascending thoracic aorta. J Thorac Cardiovasc Surg 143: 460–467, 2012. [DOI] [PMC free article] [PubMed] [Google Scholar]
- 29.Pasta S, Rinaudo A, Luca A, Pilato M, Scardulla C, Gleason TG, Vorp DA. Difference in hemodynamic and wall stress of ascending thoracic aortic aneurysms with bicuspid and tricuspid aortic valve. J Biomech 46: 1729–1738, 2013. [DOI] [PMC free article] [PubMed] [Google Scholar]
- 30.Pham TM, Martin C, Elefteriades JA, Sun W. Biomechanical characterization of ascending aortic aneurysm with concomitant bicuspid aortic valve and bovine aortic arch. Acta Biomaterialia 9: 7927–7936, 2013. [DOI] [PMC free article] [PubMed] [Google Scholar]
- 31.Rampoldi V, Trimarchi S, Eagle KA, Nienaber CA, Oh JK, Bossone E, Myrmel T, Sangiorgi GM, De Vincentiis C, Cooper JV, Fang J, Smith D, Tsai T, Raghupathy A, Fattori R, Sechtem U, Deeb MG, Sundt TM 3rd, Isselbacher EM. Simple risk models to predict surgical mortality in acute type A aortic dissection: The International Registry of Acute Aortic Dissection Score. Ann Thorac Surg 83: 55–61, 2007. [DOI] [PubMed] [Google Scholar]
- 32.Romo A, Badel P, Duprey A, Favre JP, Avril S. In vitro analysis of localized aneurysm rupture. J Biomech 47: 607–616, 2014. [DOI] [PubMed] [Google Scholar]
- 33.Sacks MS, Sun W. Multiaxial mechanical behavior of biological materials. Annu Rev Biomed Eng 5: 251–284, 2003. [DOI] [PubMed] [Google Scholar]
- 34.Simo JC. On a fully three-dimensional finite-strain viscoelastic damage model: formulation and computational aspects. Comput Methods Appl Mechanics Eng 60: 153–173, 1987. [Google Scholar]
- 35.Sokolis DP, Lampropoulos KM, Iliopoulos DC. Gender variations in the mechanical properties of ascending aortic aneurysms. In: Proceedings of the 7th IASTED International Conference on Biomedical Engineering, BioMED 2010, p. 340–344.
- 36.Suito H, Takizawa K, Huynh VH, Sze D, Ueda T. FSI analysis of the blood flow and geometrical characteristics in the thoracic aorta. Comput Mech 54: 1035–1045, 2014. [Google Scholar]
- 37.Sun W, Sacks MS. Finite element implementation of a generalized Fung-elastic constitutive model for planar soft tissues. Biomech Modeling Mechanobiol 4: 190–199, 2005. [DOI] [PubMed] [Google Scholar]
- 38.Tadros TM, Klein MD, Shapira OM. Ascending aortic dilatation associated with bicuspid aortic valve. Circulation 119: 880–890, 2009. [DOI] [PubMed] [Google Scholar]
- 39.Thubrikar M, Agali P, Robicsek F. Wall stress as a possible mechanism for the development of transverse intimal tears in aortic dissections. J Med Eng Technol 23: 127–134, 1999. [DOI] [PubMed] [Google Scholar]
- 40.Vorp DA, Schiro BJ, Ehrlich MP, Juvonen TS, Ergin MA, Griffith BP. Effect of aneurysm on the tensile strength and biomechanical behavior of the ascending thoracic aorta. Ann Thorac Surg 75: 1210–1214, 2003. [DOI] [PubMed] [Google Scholar]
- 41.Vorp DA. Biomechanics of abdominal aortic aneurysm. J Biomech 40: 1887–1902, 2007. [DOI] [PMC free article] [PubMed] [Google Scholar]
- 42.Wanamaker KM, Amadi CC, Mueller JS, Moraca RJ. Incidence of aortic arch anomalies in patients with thoracic aortic dissections. J Card Surg 28: 151–154, 2013. [DOI] [PubMed] [Google Scholar]