

Abstract
Mathematical models of the proximal tubule (PT), loop of Henle (LOH), and distal nephron have been combined to simulate transport by rat renal tubules. The ensemble is composed of 24,000 superficial (SF) nephrons and 12,000 juxtamedullary (JM) nephrons in 5 classes (according to LOH length); all coalesce into 7,200 connecting tubules (CNT). Medullary interstitial solute concentrations are specified. The model equations require that each nephron glomerular filtration rate (GFR) satisfies a tubuloglomerular feedback (TGF) relationship, and each initial hydrostatic pressure yields a common CNT pressure; that common CNT pressure is determined from an overall distal hydraulic resistance to flow. By virtue of the greater GFR for JM nephrons, fluid delivery to SF and JM tubules is comparable. Glucose reabsorption is restricted to the PT, cotransported with one Na in the convoluted tubule (SGLT2), and two Na in the straight tubule (SGLT1). Increasing ambient glucose from 5 to 10 mM increases proximal Na reabsorption and decreases distal delivery. This is mitigated by a TGF-mediated increase in GFR, and may thus be an etiology for TGF-mediated glomerular hyperfiltration. With SGLT2 inhibition by 95%, the model predicts that under normoglycemic conditions about 60% of filtered glucose will still be reabsorbed, so that profound glycosuria is not to be expected. Compared with glucose-driven osmotic diuresis, SGLT2 inhibition provokes greater natriuresis. When hyperglycemia is superimposed on SGLT2 inhibition, the model suggests that natriuresis may be severe, reflecting synergy of a proximal diuretic and osmotic diuresis. In sum, the model captures TGF-mediated diabetic hyperfiltration and predicts glomerular protection with SGLT2 inhibition.
Keywords: tubuloglomerular feedback, diabetes, glomerular hyperfiltration, SGLT2 inhibition
a classic view of kidney function has been that of high-capacity proximal reabsorption of about two-thirds of glomerular filtrate, with regulated transport in distal segments. If one includes the loop of Henle (LOH) with the proximal bookkeeping, then distal regulation starts working with about 20% of filtrate and 10% of filtered Na+. Regulatory processes are in place to preserve constancy of distal delivery. These include proximal glomerulotubular balance (GTB), acting to match fractional changes in epithelial transport with changes in filtration, and tubuloglomerular feedback (TGF), modulating glomerular filtration so as to counter alterations in distal flow. Considerable experimental attention has been dedicated to both of these homeostatic processes, and they have each been the focus of a number of mathematical models. What has received less attention in the modeling literature is the efficacy of these signals to actually achieve appropriate proximal-to-distal balance, and to prevent gross distortions of fluid and electrolyte excretion. Prior mathematical models, which can represent the whole kidney, have focused largely on medullary function and regulation of water and urea, and to some extent Na+ excretion (15, 16, 27, 42). That work gave relatively little attention to cortical transport, either in proximal tubules or in cortical distal nephron. The most comprehensive modeling consideration of the regulation of renal sodium excretion has come with the recent work by Moss and Thomas (23). That work provides segmental representations of Na+ and urea fluxes and gives careful attention to cortical transport, including intrarenal regulation and hormonal signals. In all of the prior kidney simulations there has been little representation of electrolyte or acid/base transport.
Over the past 30 years, a complete library of renal tubular models, representing transport of Na+, K+, Cl−, and urea, as well as acid-base fluxes (phosphate, ammonia, and carbon dioxide species), has been developed. In prior work, the distal segments were concatenated to simulate the full ensemble of distal nephrons (DN) for a single rat kidney, from the distal convoluted tubule (DCT) through the inner medullary collecting duct (IMCD). That model was used to examine the impact of diuretics on renal acid-base handling (37), as well as distal nephron handling of K+ in hypovolemic states (38). Most recently, the superficial proximal convoluted tubule (PCT) model, capable of representing GTB (41), was extended by addition of a LOH; both superficial and juxtamedullary nephrons were fashioned (40). That work included proximal straight tubules (PST) and thin Henle limbs, concatenated with previously published models of medullary and cortical thick ascending Henle limbs (AHL); that model also included representation of TGF. In the present work, the PCT-LOH and DN models are fused into a simulation of the full ensemble of kidney tubules. There is a single population of superficial nephrons along with five classes of juxtamedullary nephrons of variable depth, each with its own DCT, and all coalescing at the start of the connecting segment (CNT). The focus of this model is on conditions of altered proximal tubule transport, as with hyperglycemia, inhibition of PCT glucose transport, and osmotic diuresis. The model provides predictions of the impact of altered proximal fluxes on distal nephron transport and whole kidney electrolyte excretion.
MODEL FORMULATION
The scope of the present model is shown in Fig. 1, depicting renal tubules from PCT through IMCD. The model is comprised of 24,000 superficial (SF) nephrons and 12,400 juxtamedullary (JM) nephrons of varying length. JM nephron number declines with inner medullary depth, and this is captured in the model by solving for 5 distinct classes of JM nephrons: 6,400 turn at 1 mm; 3,200 at 2 mm; 1,600 at 3 mm; 800 at 4 mm; and 400 span the full 5 mm of inner medulla. The total nephron number, as well as the SF-to-JM ratio are consistent with measurements from rat kidney made by Knepper et al. (14). Specifically, Fig. 7 from that work shows an approximate factor of 3 ratio in the number of AHL counted in the outer medulla, compared with AHL counted at the base of the inner medulla, implying JM loops are about a third of the total population. The nephron populations chosen here are virtually identical to those of Moss and Thomas (23). In the model formulation, nephrons within any class (1 SF and 5 JM) are identical, and may be referred to as a single nephron in a description of members of the class. Each of the six model nephrons (1 SF plus 5 JM) must have its own AHL and DCT, due to the different depths from which ascending flows reach the outer medulla. By virtue of distinct TGF signals, each of the JM nephrons must have its own PCT and descending segments. In all, each of the six nephrons must be solved from the initial PCT through the point of merger at the initial CNT. At that point, the six luminal fluid flows mix to define the composition of entering CNT fluid, and the six end-DCT hydrostatic pressures must all be equal to the initial CNT pressure.
Fig. 1.
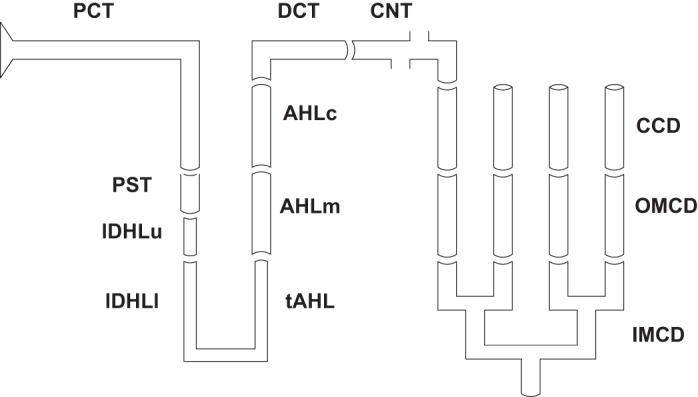
Schematic representation of a juxtamedullary nephron, with its 12 component segments. In the model, all superficial and juxtamedullary nephrons coalesce at the initial point of the connecting tubule (CNT), where there is mixing of the luminal fluid to define CNT concentrations. Model calculations ensure that end-distal convoluted tubule (DCT) hydrostatic pressures are all equal. See text for other definitions.
Fig. 7.

Segmental delivery and transport of HCO3− (top tier), NH4+ (middle tier), and NEA (bottom tier): hyperglycemia (ambient glucose = 10 mM). Data are plotted as in Fig. 4.
The mixing problem at the initial CNT requires conservation equations with multiple buffers. This begins with specifying an expression for the (steady-state) generation of volume and solute, sM(v) and sM(i), at the point of mixing, namely the CNT initial flow minus aggregate delivery from the six DCT:
| (1) |
| (2) |
in which FvM and FM(i) are axial flows of volume and solute i in the designated tubule. With these apparent source terms, mass conservation for the non-reacting species is
| (3) |
| (4) |
and conservation of the phosphate and ammonia buffer pairs is
| (5) |
| (6) |
For all acid-base pairs, a second equation expresses pH equilibrium
| (7) |
Corresponding to the rapid protonation of HCO3− and slower CO2 hydration/dehydration
it is assumed that at the point of mixing, there is no time for CO2 and water to react,
| (8) |
| (9) |
This is a departure from all other segmental intervals of finite length, for which there is a non-negligible transit time. To track conservation of protons, there must be an equation for charge conservation of all of the reacting buffer species
| (10) |
Once each nephron has been solved from PCT through DCT, Eqs. 1–10 (along with phosphate and ammonia equilibria) are solved once to supply the 12 entering solute concentrations for the distal nephron.
For each nephron, an initial proximal tubule hydrostatic pressure is assumed, and the downstream pressures through DCT are determined according to a Poiseuille flow equation. Where the six nephrons coalesce, at the start of CNT, the six end-DCT pressures must agree. In this model, initial CNT pressure has been assumed proportional to distal flow, according to a lumped distal resistance, ΩDN:
| (11) |
In the model calculations, ΩDN = 0.05 mmHg/(μl/min), so that for a baseline distal delivery of about 0.2 ml/min, initial CNT pressure is about 10 mmHg. For the CNT and CD segments, which follow, local Poiseuille flow equations determine further changes in luminal hydrostatic pressure. Beyond ensuring that tubule pressure will be sensitive to distal volume delivery, the choice of this formulation, rather than a prespecified end-IMCD pressure, is the ability to get the model equations to converge to a solution. IMCD flow is a tiny fraction of proximal flow, but perturbations of IMCD pressure are transmitted back to the proximal tubule where (by virtue of compliance) they can have a large (relative to IMCD flow) effect on proximal reabsorption, thus rendering the calculation unstable. The equality of end-DCT hydrostatic pressure at the initial CNT provides a weak coupling of all six nephrons: if one nephron changes its fluid flow, then distal delivery changes, and thus initial CNT pressure will change, thus changing PCT pressures in the other five nephrons. Thus the 13 global model variables are the initial pressures and flows for the 6 nephrons plus the initial CNT pressure. The 13 model equations are the 6 TGF relationships for each nephron (Eq. 22 in Ref. 40), the 6 identity conditions for end-DCT and initial CNT hydrostatic pressure, plus the distal flow condition expressed in Eq. 11. Starting with initial guesses, the model equations yield error terms; and then sequential perturbation of each guess (and reintegration of the full model) provides the derivative of the errors with respect to the initial guesses. In all, 13 additional model integrations are required to compute this derivative, which is used to update the guesses. The process is repeated to reduce the magnitude of the errors to the desired tolerance.
MODEL CALCULATIONS
Baseline Conditions
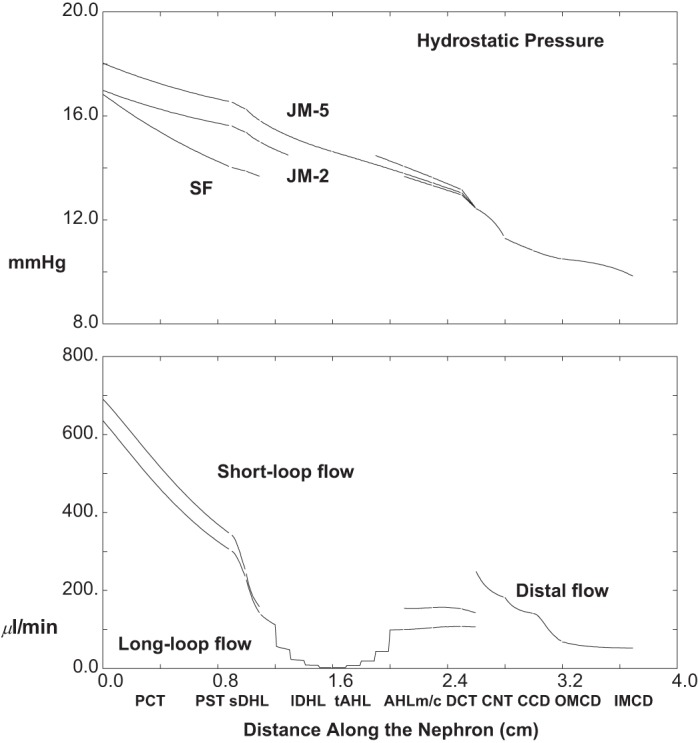
The baseline conditions for each of the model nephrons have been set out in the companion paper (40). For those parameters, interstitial concentrations, and entering flows, the model equations have been solved, and the results are displayed in Figs. 2, 3 and 4, and Table 1. Figure 2 shows pressures and volume flow. The abscissa is distance along the nephron, parameterized according to the longest of the JM tubules, and plotted so that all of the ascending segments meet at the CNT. Thus for each nephron, the outer medullary portion of the descending Henle limb ends at x = 1.1 cm, and the medullary AHL begins at x = 2.1 cm, so that CNT starts at x = 2.6 cm. In the top pane of Fig. 2, pressures are shown for the SF nephron, a short JM nephron, which descends 2 mm into IM, and the longest of the JM nephrons. All of the pressure drops are small, with end-IMCD at 8.3 mmHg and initial CNT pressure at 9.6 mmHg; proximal tubule pressures are between 11 and 15 mmHg, with a 3.4 mmHg drop along SFPCT and 1.8 and 2.0 mmHg along the two JMPCT. Volume flows appear in the bottom pane of Fig. 2, which shows one curve for SF nephron flows, and a second curve, which is the sum of all JM flows at any given point. It is notable that the two nephron populations contribute approximately equally to total GFR (1.54 ml/min), and that just under two-thirds of the filtrate is reabsorbed in each PCT (62 and 64%, respectively). The step-ladder pattern to the inner medullary JM flows reflects the five IM levels at which nephrons are turning. At the junction between DCT and CNT, the two flows for SF and JM (112 and 81 μl/min. respectively) add to become 193 μl/min at the initial CNT; final urine flow is 17 μl/min, about 1.1% of GFR.
Fig. 2.
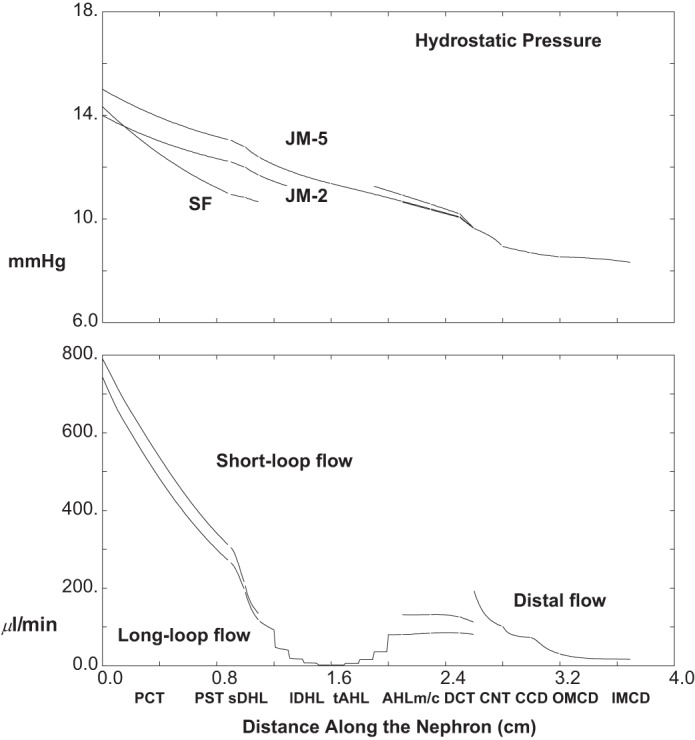
Pressure and volume flow as a function of distance along the nephron: baseline conditions. In the top pane, hydrostatic pressures are plotted for the superficial (SF) nephron and for 2 juxtamedullary (JM) nephrons which descend 2 and 5 mm into the inner medulla. Ascending segments are aligned so that all medullary ascending Henle limbs (AHLm) start at x = 2.1 cm. In the bottom pane, axial volume flow is plotted for the totality of SF and JM nephrons. Tubules coalesce at the start of the CNT (x = 2.6 cm), so at that point the 2 flows add, and from that point on there is a single hydrostatic pressure and volume flow for the totality of distal nephrons.
Fig. 3.

Segmental delivery and transport of Na+ (top tier), K+ (middle tier), and urea (bottom tier): baseline conditions. In each tier, the left panes display glomerular filtration (first pair of bars) and proximal convoluted tubule (PCT) reabsorption (second pair of bars); the 2 bars of each pair correspond to SF and JM nephrons. The middle panes display reabsorption (negative deflection) or secretion (positive deflection) along the remainder of each nephron through the DCT (note scale change from the left panes). The right panes show delivery and transport in the distal nephron, with urinary solute excretion as the terminal bar.
Fig. 4.

Segmental delivery and transport of HCO3− (top tier), NH4+ (middle tier), and net acid (NEA; bottom tier): baseline conditions. In each tier, the left panes display glomerular filtration (first pair of bars) and PCT reabsorption (second pair of bars); the 2 bars of each pair correspond to SF and JM nephrons. The middle panes display reabsorption (negative deflection) or secretion (positive deflection) along the remainder of each nephron through the DCT (note scale change from the left panes). The right panes show delivery and transport in the distal nephron, with urinary solute excretion as the terminal bar.
Table 1.
Segmental volume and solute delivery and reabsorption: baseline conditions
| Superficial Nephrons | ||||||
|---|---|---|---|---|---|---|
| SFPCT | SFPST | sDHL | AHLm | AHLc | DCT | |
| Delivery | ||||||
| Fv, μl/min | 791.4 | 304.4 | 205.4 | 131.4 | 132.2 | 125.7 |
| Na+, μmol/min | 113.94 | 44.35 | 38.84 | 37.18 | 21.94 | 9.68 |
| K+ | 3.96 | 1.68 | 1.44 | 1.34 | 0.56 | 0.24 |
| HCO3− | 19.78 | 4.81 | 4.33 | 4.20 | 1.90 | 0.68 |
| NH4+ | 0.16 | 0.10 | 0.36 | 0.38 | 0.34 | 0.05 |
| Net acid | −19.57 | −4.59 | −3.91 | −3.82 | −1.44 | −0.32 |
| Urea | 3.96 | 2.10 | 1.79 | 1.95 | 1.93 | 1.85 |
| Reabsorption | ||||||
| Fv, μl/min | 486.9 | 99.0 | 74.0 | −0.8 | 6.5 | 14.1 |
| Na+, μmol/min | 69.60 | 5.51 | 1.66 | 15.23 | 12.26 | 3.77 |
| K+ | 2.28 | 0.24 | 0.10 | 0.78 | 0.33 | −0.25 |
| HCO3− | 14.98 | 0.48 | 0.13 | 2.30 | 1.22 | 0.38 |
| NH4+ | 0.05 | −0.25 | −0.03 | 0.04 | 0.29 | −0.14 |
| Net acid | −14.97 | −0.69 | −0.09 | −2.38 | −1.12 | −0.68 |
| Urea | 1.86 | 0.30 | −0.16 | 0.02 | 0.09 | 0.07 |
| Juxtamedullary Nephrons | ||||||||
|---|---|---|---|---|---|---|---|---|
| JMPCT | JMPST | lDHLu | lDHLl | tAHL | AHLm | AHLc | DCT | |
| Delivery | ||||||||
| Fv, μl/min | 744.0 | 264.9 | 188.9 | 114.7 | 80.1 | 80.8 | 84.2 | 84.6 |
| Na+, μmol/min | 107.16 | 38.44 | 33.71 | 31.73 | 27.15 | 22.99 | 14.98 | 8.04 |
| K+ | 3.72 | 1.55 | 1.29 | 1.14 | 1.00 | 0.84 | 0.44 | 0.21 |
| HCO3− | 18.61 | 2.21 | 2.15 | 2.19 | 2.15 | 2.01 | 0.87 | 0.30 |
| NH4+ | 0.15 | 0.12 | 0.33 | 0.42 | 0.40 | 0.35 | 0.27 | 0.05 |
| Net acid | −18.40 | −1.93 | −1.70 | −1.73 | −1.74 | −1.64 | −0.50 | −0.05 |
| Urea | 3.72 | 1.99 | 1.76 | 1.75 | 6.94 | 5.28 | 5.04 | 4.79 |
| Reabsorption | ||||||||
| Fv, μl/min | 479.2 | 76.0 | 74.2 | 34.6 | −0.7 | −3.4 | −0.4 | 3.6 |
| Na+, μmol/min | 68.70 | 4.73 | 1.99 | 4.58 | 4.16 | 8.01 | 6.94 | 1.97 |
| K+ | 2.17 | 0.25 | 0.15 | 0.14 | 0.17 | 0.40 | 0.22 | −0.13 |
| HCO3− | 16.40 | 0.06 | −0.04 | 0.04 | 0.14 | 1.14 | 0.57 | 0.14 |
| NH4+ | 0.02 | −0.21 | −0.09 | 0.02 | 0.05 | 0.08 | 0.22 | −0.09 |
| Net acid | −16.47 | −0.23 | 0.02 | 0.01 | −0.10 | −1.14 | −0.45 | −0.29 |
| Urea | 1.73 | 0.23 | 0.01 | −5.19 | 1.67 | 0.24 | 0.25 | 0.20 |
| Distal Nephron | |||||
|---|---|---|---|---|---|
| CNT | CCD | OMCD | IMCD | Total | |
| Delivery | |||||
| Fv, μl/min | 192.5 | 101.0 | 72.2 | 30.3 | 16.6 |
| Na+, μmol/min | 11.98 | 3.08 | 2.46 | 2.83 | 1.49 |
| K+ | 0.82 | 5.51 | 5.23 | 4.03 | 2.75 |
| HCO3− | 0.46 | 0.36 | 0.29 | 0.20 | 0.07 |
| NH4+ | 0.33 | 0.33 | 0.36 | 0.55 | 0.63 |
| Net acid | 0.60 | 0.86 | 0.75 | 0.93 | 1.12 |
| Urea | 6.37 | 6.09 | 5.91 | 3.72 | 5.03 |
| Reabsorption | |||||
| Fv, μl/min | 91.6 | 28.8 | 41.8 | 13.7 | 1518.6 |
| Na+, μmol/min | 8.90 | 0.61 | −0.36 | 1.34 | 219.60 |
| K+ | −4.69 | 0.28 | 1.20 | 1.28 | 4.92 |
| HCO3− | 0.10 | 0.07 | 0.09 | 0.12 | 38.32 |
| NH4+ | 0.00 | −0.03 | −0.19 | −0.07 | −0.32 |
| Net acid | −0.26 | 0.10 | −0.18 | −0.18 | −39.08 |
| Urea | 0.28 | 0.18 | 2.19 | −1.30 | 2.65 |
See the text for definitions.
The baseline solute flows and fluxes are summarized in Table 1 and depicted in Figs. 3 and 4. Rather than showing axial flows, a bar graph depicts the segmental accounting for transport of Na+, K+, urea, HCO3−, NH4+, and net acid [NH4++titratable acid (TA) − HCO3−] The bar graph format is the same for each solute: in the left and middle panes, there are pairs of bars, representing fluxes for all SF nephrons and all JM nephrons. The first pair is initial PCT delivery (GFR to those nephrons), and subsequent pairs show segmental subtraction or addition (reabsorption or secretion) for the segments reaching to CNT; the final pair of bars is delivery to CNT. In the right pane, the first bar is the sum of the SF and JM contributions to the initial flow (the sum of the last two bars in the middle pane); the next four bars show segmental transport; and the last bar is solute excretion. With respect to Na+, the notable feature is that for both SF and JM nephrons, filtered loads are comparable, and at the entry to CNT the delivered loads are comparable. An important difference between the two is that the JM nephrons leave Na+ within the IM (reabsorption from lDHLl and tAHL), so that relatively less Na+ is reabsorbed in AHL. This diffusive flux of Na+ across IM thin limbs had been noted previously (40), and for the full ensemble of JM nephrons, the combined flux across long descending Henle limb (lDHLl) plus thin ascending Henle limb (tAHL) amounts to about 8% of the filtered load. Final Na+ excretion is 1.5 μmol/min, about 0.7% of filtered load.
K+ transport is shown in the middle tier of Fig. 3, which shows reabsorption in the proximal tubule and LOH, and delivery of relatively minor amounts to CNT (about 11% of filtered load). K+ secretion within CNT is about 61% of filtered load, while CCD K+ flux is relatively small. This reflects the fact that CCD K+ concentrations are from 60 to 70 mM, which exceed the ability of that epithelium to secrete K+ against an electrochemical gradient (35). Overall, about 50% of K+ delivered to the cortical collecting duct appears in the urine, which is comparable to micropuncture observations (22). From PCT through the descending nephron segments within OM [PST and short descending Henle limb (sDHL) or upper segment of the long descending Henle limb (lDHLu)], handling of urea in both SF and JM looks similar to K+ (Fig. 3, bottom tier). From sDHL to CNT, there is little change in SF urea flow. JM nephrons take up a large urea load in lDHLl, and give back about 30% of it in tAHL. With respect to the individual JM loops, there is increasing countercurrent exchange as the loops lengthen: for the shortest JM (1-mm loop), there is urea secretion into both lDHLl and tAHL; for the loops of depth 2, 3, 4, and 5 mm, tAHL urea reabsorption is 16, 55, 74, and 84% of the urea secreted into lDHLl. The relatively low aggregate JM urea recycling reflects the smaller number of deep loops. Urea delivery to the cortex is about 83% of the filtered load, and excreted urea is about 65% of the filtered load. The final urea concentration is 303 mM, reflecting the relatively high urine flow rate, and low urine osmolality (873 mosmol/kgH2O).
Acid-base handling under baseline conditions is shown in Fig. 4: top tier, (HCO3− transport); middle tier, (NH4+ transport); and bottom tier (net acid fluxes). In SF and JM nephrons, PCT HCO3− reabsorption is 76 and 88%, respectively; the remainder is largely reabsorbed in AHL, so that only about 1% of the filtered load is flowing at the start of CNT, at which lumen HCO3− is 2.4 mM, with pH = 6.18. From CNT through IMCD, there is continuing acidification, although reabsorption of water actually raises the final HCO3− to 4.3 mM and pH to 6.39; final HCO3− excretion is 0.07 μmol/min. NH4+ secretion is most prominent in PST, due to the high OM interstitial ammonia concentration, and for both SF and JM nephrons all of this secreted NH4+ is reabsorbed in the cortical AHL (AHLc). Compared with medullary AHL (AHLm), AHLc NH4+ reabsorption via NKCC is fostered by the lower peritubular NH4+ concentration, and by the lower luminal K+ concentration in AHLc. There is NH4+ addition along the entire CD, so that final urine NH4+ concentration is 38 mM and NH4+ excretion is 0.63 μmol/min. Net acid flow increases along all nephron segments, with the exception of the CCD, where β cell activity is dominant. SF and JM nephrons differ in the rate of luminal acidification in AHLm, due to lower HCO3− delivery from JMPCT to LOH, but net acid delivery to CNT from both nephron classes is nearly equal. Overall, baseline net acid excretion by this model kidney is 1.12 μmol/min. This implies a TA excretion rate of 0.56 μmol/min. These whole kidney excretion rates may be compared with experimental measurements, summarized in Table 4 of (36), where both TA and NH4+ excretion rates will be found similar to reports from DuBose and Caflisch (7), Jaeger et al. (12), Karlmark et al. (13), and Walls et al. (32).
Table 4.
Segmental volume and solute delivery and reabsorption: ambient glucose = 30 mM
| Superficial Nephrons | ||||||
|---|---|---|---|---|---|---|
| SFPCT | SFPST | sDHL | AHLm | AHLc | DCT | |
| Delivery | ||||||
| Fv, μl/min | 780.0 | 292.6 | 204.7 | 149.0 | 150.9 | 147.8 |
| Na+, μmol/min | 112.38 | 43.43 | 38.74 | 39.30 | 24.65 | 12.22 |
| K+ | 3.90 | 1.67 | 1.49 | 1.49 | 0.64 | 0.27 |
| HCO3− | 19.51 | 5.70 | 5.07 | 4.96 | 2.62 | 1.16 |
| NH4+ | 0.15 | 0.09 | 0.37 | 0.41 | 0.37 | 0.06 |
| Net acid | −19.30 | −5.53 | −4.67 | −4.56 | −2.15 | −0.84 |
| Urea | 3.90 | 2.03 | 1.75 | 1.99 | 1.98 | 1.91 |
| Glucose | 23.41 | 5.87 | 5.20 | 5.20 | 5.20 | 5.20 |
| Reabsorption | ||||||
| Fv, μl/min | 487.7 | 88.0 | 55.6 | −1.9 | 3.1 | 10.2 |
| Na+, μmol/min | 68.94 | 4.68 | −0.56 | 14.66 | 12.42 | 4.03 |
| K+ | 2.23 | 0.18 | 0.00 | 0.85 | 0.36 | −0.27 |
| HCO3− | 13.81 | 0.63 | 0.12 | 2.34 | 1.45 | 0.64 |
| NH4+ | 0.06 | −0.27 | −0.04 | 0.04 | 0.31 | −0.14 |
| Net acid | −13.76 | −0.86 | −0.10 | −2.41 | −1.31 | −1.06 |
| Urea | 1.87 | 0.28 | −0.23 | 0.01 | 0.07 | 0.06 |
| Glucose | 17.54 | 0.67 | 0.00 | 0.00 | 0.00 | 0.00 |
| Juxtamedullary Nephrons | ||||||||
|---|---|---|---|---|---|---|---|---|
| JMPCT | JMPST | lDHLu | lDHLl | tAHL | AHLm | AHLc | DCT | |
| Delivery | ||||||||
| Fv, μl/min | 699.0 | 239.6 | 170.9 | 117.7 | 88.4 | 90.2 | 95.5 | 98.2 |
| Na+, μmol/min | 100.68 | 36.49 | 31.75 | 31.22 | 28.68 | 25.78 | 17.74 | 10.49 |
| K+ | 3.50 | 1.44 | 1.24 | 1.14 | 1.10 | 0.94 | 0.51 | 0.25 |
| HCO3− | 17.48 | 3.42 | 3.12 | 3.09 | 2.96 | 2.25 | 1.12 | 0.45 |
| NH4+ | 0.14 | 0.08 | 0.32 | 0.37 | 0.38 | 0.37 | 0.30 | 0.05 |
| Net acid | −17.29 | −3.21 | −2.71 | −2.70 | −2.59 | −1.86 | −0.70 | −0.15 |
| Urea | 3.50 | 1.80 | 1.59 | 1.61 | 7.11 | 5.90 | 5.67 | 5.42 |
| Glucose | 20.97 | 3.52 | 2.87 | 2.87 | 2.87 | 2.87 | 2.87 | 2.87 |
| Reabsorption | ||||||||
| Fv, μl/min | 459.4 | 68.7 | 53.3 | 29.2 | −1.7 | −5.3 | −2.7 | 1.4 |
| Na+, μmol/min | 64.14 | 4.74 | 0.53 | 2.54 | 2.90 | 8.05 | 7.25 | 2.09 |
| K+ | 2.05 | 0.20 | 0.10 | 0.04 | 0.16 | 0.43 | 0.25 | −0.13 |
| HCO3− | 14.06 | 0.30 | 0.03 | 0.13 | 0.71 | 1.14 | 0.67 | 0.23 |
| NH4+ | 0.06 | −0.24 | −0.05 | −0.01 | 0.00 | 0.07 | 0.25 | −0.09 |
| Net acid | −14.08 | −0.50 | −0.01 | −0.11 | −0.73 | −1.16 | −0.55 | −0.45 |
| Urea | 1.69 | 0.21 | −0.02 | −5.50 | 1.21 | 0.24 | 0.25 | 0.19 |
| Glucose | 17.45 | 0.66 | 0.00 | 0.00 | 0.00 | 0.00 | 0.00 | 0.00 |
| Distal Nephron | |||||
|---|---|---|---|---|---|
| CNT | CCD | OMCD | IMCD | Total | |
| Delivery | |||||
| Fv, μl/min | 234.2 | 169.7 | 134.7 | 66.2 | 52.0 |
| Na+, μmol/min | 16.59 | 7.05 | 6.29 | 6.48 | 5.11 |
| K+ | 0.93 | 6.26 | 6.28 | 5.53 | 4.71 |
| HCO3− | 0.75 | 0.63 | 0.53 | 0.45 | 0.34 |
| NH4+ | 0.34 | 0.37 | 0.43 | 0.77 | 0.93 |
| Net acid | 0.52 | 0.88 | 0.78 | 1.03 | 1.28 |
| Urea | 7.08 | 6.88 | 6.77 | 5.50 | 10.44 |
| Glucose | 8.07 | 8.07 | 8.07 | 8.07 | 8.07 |
| Reabsorption | |||||
| Fv, μl/min | 64.6 | 34.9 | 68.6 | 14.2 | 1427.4 |
| Na+, μmol/min | 9.54 | 0.76 | −0.19 | 1.37 | 207.90 |
| K+ | −5.33 | −0.03 | 0.75 | 0.82 | 2.69 |
| HCO3− | 0.12 | 0.09 | 0.08 | 0.12 | 36.65 |
| NH4+ | −0.02 | −0.06 | −0.34 | −0.17 | −0.64 |
| Net acid | −0.35 | 0.09 | −0.24 | −0.25 | −37.85 |
| Urea | 0.21 | 0.10 | 1.27 | −4.94 | −3.04 |
Hyperglycemia
What this model adds to the calculations of its proximal tubule-LOH predecessor (40) is the ability to quantify the distal impact of changes in proximal function. Table 2 and Figs. 5, 6, and 7 display results from a simulation in which ambient glucose is increased to 10 mM, a concentration in which proximal glucose reabsorption is still complete. The top pane of Fig. 5 shows axial profiles of pressure in three nephrons (SF and a short and long JM); the bottom pane shows volume flow along SF and the aggregate JM nephron population. Compared with baseline conditions, whole kidney GFR is increased by about 8.5% to 1.7 ml/min, although distal delivery (CNT flow) is reduced by 13% to 168 μl/min, and final urine flow is <50% of baseline, 8 μl/min. The widening of the difference between proximal and distal flows reflects the increase in absolute PCT reabsorption with hyperglycemia, from 966 to 1,140 μl/min. This 18% increase in volume reabsorption with only a 5 mM increase in glucose concentration reflects the impact of greater axial flow velocity on transcellular Na+ flux, which is augmented by increased paracellular convective Na+ flux (34). Distal hydrostatic pressures with hyperglycemia are little changed from baseline, due to Eq. 11, in which distal pressures are computed according to CNT delivery, rather than final urine. Indeed, the relatively constant distal volume reabsorption (perhaps its lack of flow dependence) poses a problem for simulations of reduced distal delivery, in which tubule flow can become zero before the tubule end. In the model, hyperglycemic PCT hydrostatic pressures are no greater than in the baseline case, despite the increase in SNGFR, and this reflects the decrease in PCT pressure drop with the greater PCT fluid reabsorption.
Table 2.
Segmental volume and solute delivery and reabsorption: ambient glucose = 10 mM
| Superficial Nephrons | ||||||
|---|---|---|---|---|---|---|
| SFPCT | SFPST | sDHL | AHLm | AHLc | DCT | |
| Delivery | ||||||
| Fv, μl/min | 865.2 | 281.3 | 182.4 | 120.1 | 120.2 | 112.0 |
| Na+, μmol/min | 124.62 | 41.65 | 35.35 | 34.03 | 18.97 | 7.57 |
| K+ | 4.33 | 1.58 | 1.31 | 1.23 | 0.50 | 0.22 |
| HCO3− | 21.63 | 4.59 | 4.03 | 3.89 | 1.63 | 0.56 |
| NH4+ | 0.17 | 0.10 | 0.33 | 0.35 | 0.31 | 0.05 |
| Net acid | −21.39 | −4.39 | −3.65 | −3.55 | −1.19 | −0.18 |
| Urea | 4.33 | 2.06 | 1.70 | 1.84 | 1.82 | 1.72 |
| Reabsorption | ||||||
| Fv, μl/min | 583.9 | 98.9 | 62.3 | −0.1 | 8.2 | 15.7 |
| Na+, μmol/min | 82.92 | 6.30 | 1.33 | 15.05 | 11.40 | 3.57 |
| K+ | 2.75 | 0.26 | 0.08 | 0.73 | 0.28 | −0.23 |
| HCO3− | 17.04 | 0.56 | 0.14 | 2.27 | 1.07 | 0.28 |
| NH4+ | 0.08 | −0.24 | −0.02 | 0.04 | 0.26 | −0.12 |
| Net acid | −17.00 | −0.74 | −0.09 | −2.37 | −1.01 | −0.54 |
| Urea | 2.27 | 0.36 | −0.14 | 0.03 | 0.09 | 0.08 |
| Juxtamedullary Nephrons | ||||||||
|---|---|---|---|---|---|---|---|---|
| JMPCT | JMPST | lDHLu | lDHLl | tAHL | AHLm | AHLc | DCT | |
| Delivery | ||||||||
| Fv, μl/min | 801.6 | 244.3 | 167.9 | 104.5 | 73.1 | 73.8 | 76.9 | 76.3 |
| Na+, μmol/min | 115.38 | 36.04 | 30.71 | 28.98 | 24.65 | 21.02 | 13.08 | 6.48 |
| K+ | 4.01 | 1.46 | 1.18 | 1.04 | 0.91 | 0.76 | 0.39 | 0.19 |
| HCO3− | 20.03 | 2.01 | 1.95 | 1.99 | 1.96 | 1.83 | 0.72 | 0.24 |
| NH4+ | 0.16 | 0.11 | 0.31 | 0.39 | 0.37 | 0.32 | 0.25 | 0.05 |
| Net acid | −19.81 | −1.75 | −1.53 | −1.56 | −1.58 | −1.50 | −0.37 | 0.00 |
| Urea | 4.01 | 1.94 | 1.68 | 1.67 | 6.67 | 4.75 | 4.52 | 4.28 |
| Reabsorption | ||||||||
| Fv, μl/min | 557.1 | 76.3 | 63.5 | 31.3 | −0.7 | −3.0 | 0.5 | 4.6 |
| Na+, μmol/min | 79.38 | 5.32 | 1.74 | 4.32 | 3.64 | 7.94 | 6.60 | 1.90 |
| K+ | 2.55 | 0.28 | 0.13 | 0.13 | 0.15 | 0.38 | 0.20 | −0.12 |
| HCO3− | 18.02 | 0.07 | −0.04 | 0.03 | 0.12 | 1.12 | 0.47 | 0.10 |
| NH4+ | 0.04 | −0.19 | −0.08 | 0.02 | 0.05 | 0.07 | 0.20 | −0.08 |
| Net acid | −18.07 | −0.22 | 0.03 | 0.02 | −0.08 | −1.13 | −0.37 | −0.23 |
| Urea | 2.07 | 0.26 | 0.01 | −5.00 | 1.92 | 0.23 | 0.24 | 0.19 |
| Distal Nephron | |||||
|---|---|---|---|---|---|
| CNT | CCD | OMCD | IMCD | Total | |
| Delivery | |||||
| Fv, μl/min | 168.0 | 70.4 | 50.9 | 19.3 | 7.9 |
| Na+, μmol/min | 8.58 | 0.88 | 0.71 | 1.41 | 0.50 |
| K+ | 0.76 | 4.78 | 4.21 | 2.86 | 1.46 |
| HCO3− | 0.42 | 0.26 | 0.19 | 0.10 | 0.02 |
| NH4+ | 0.30 | 0.29 | 0.30 | 0.44 | 0.46 |
| Net acid | 0.58 | 0.88 | 0.77 | 0.91 | 1.03 |
| Urea | 5.73 | 5.40 | 5.18 | 2.54 | 2.88 |
| Reabsorption | |||||
| Fv, μl/min | 97.6 | 19.5 | 31.6 | 11.4 | 1658.4 |
| Na+, μmol/min | 7.70 | 0.16 | −0.70 | 0.91 | 239.46 |
| K+ | −4.02 | 0.57 | 1.35 | 1.40 | 6.87 |
| HCO3− | 0.16 | 0.07 | 0.09 | 0.09 | 41.65 |
| NH4+ | 0.02 | −0.01 | −0.14 | −0.02 | −0.13 |
| Net acid | −0.30 | 0.11 | −0.14 | −0.12 | −42.24 |
| Urea | 0.33 | 0.22 | 2.63 | −0.34 | 5.45 |
See the text for definitions.
Fig. 5.
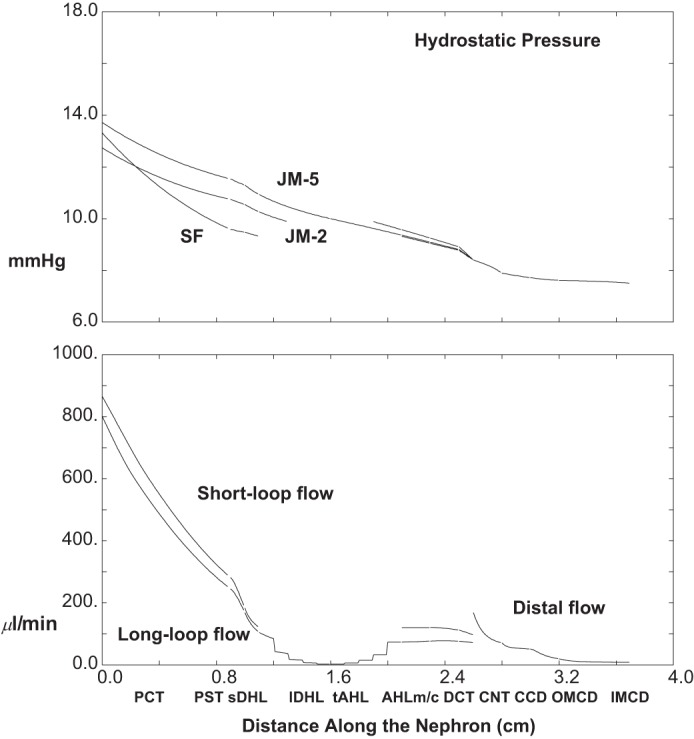
Pressure and volume flow as a function of distance along the nephron: hyperglycemia (ambient glucose = 10 mM). Data are plotted as in Fig. 2 (with increase in flow scale).
Fig. 6.

Segmental delivery and transport of Na+ (top tier), K+ (middle tier), and urea (bottom tier): hyperglycemia (ambient glucose = 10 mM). Data are plotted as in Fig. 3.
Figures 6 and 7 display segmental solute fluxes, which show that there is reduced excretion of Na+, K+, and urea, with little change in net acid. The 28% decrease in distal Na+ delivery from baseline (12.0-8.6 μmol/min) derives from a 13% reduction in CNT volume flow and an 18% reduction in Na+ concentration (62-51 mM). This decrease in luminal Na+ concentration is due in part to the increase in AHL contact time, and the inverse relationship of AHL flow and macula densa salt concentration. With a reduction in Na+ delivery, absolute CNT Na+ reabsorption is reduced to 7.7 μmol/min (compared with baseline 8.9 μmol/min), although the fractional CNT Na+ reabsorption increases from 74 to 90%. The remaining segmental Na+ fluxes are small, and final Na+ excretion is about 0.5 μmol/min, a reduction of 67% from baseline. Both the reductions in CNT Na+ delivery and volume flow impact K+ excretion. Reduced CNT Na+ reabsorption takes K+ secretion from 4.7 (baseline) to 4.0 μmol/min. Beyond that, slower volume flow along the CD increases K+ reabsorption from 2.8 to 3.3 μmol/min. The combined effect is a halving of K+ excretion from 2.8 to 1.5 μmol/min. The lower axial volume flows also reduce urea excretion, both by decreasing distal delivery (suggesting enhanced medullary countercurrent exchange) and by enhancing reabsorption in OMCD (where peritubular urea is low). At lower distal flow, HCO3− excretion goes to near zero, reflecting the decrease in urine flow plus the 50% reduction in urine HCO3− to 2.1 mM (pH 6.18). With the reduction in pH, there is an increase in luminal NH4+ concentration to 58 mM, although the decrease in urine flow provides for an overall reduction in NH4+ excretion to 0.46 μmol/min. TA concentration increases with the lower urine pH, which in this case dominates the flow effect, so that excretion increases slightly to 0.59 μmol/min. Summing the decrease in HCO3− excretion, the increase in TA excretion, and the decrease in NH4+ excretion, the impact on net acid excretion is small (8% reduction from baseline).
1Na+:1Glucose Cotransporter Inhibition
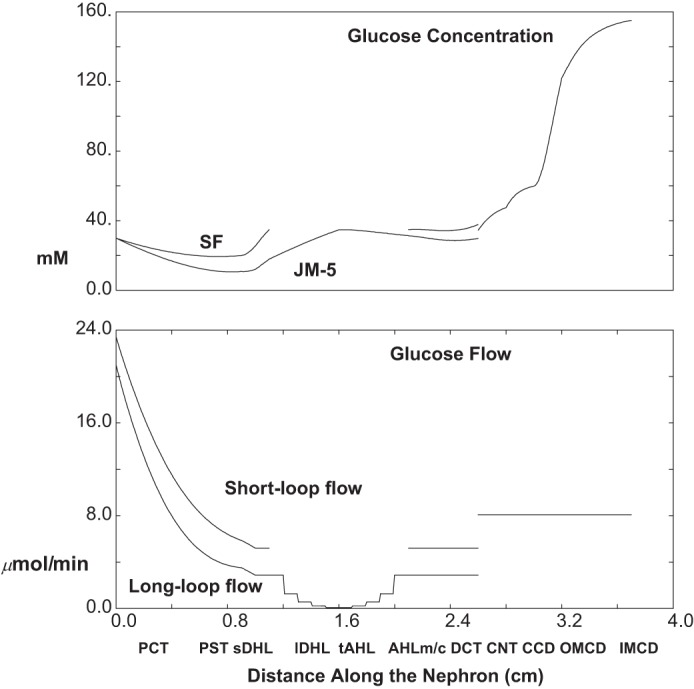
The calculations of Table 3 and Figs. 8, 9, and 10 are done under baseline conditions (5 mM ambient glucose), with the exception of a 95% reduction in 1Na+:1glucose cotransporter (SGLT2) activity in both SFPCT and JMPCT. In Fig. 8, the top pane displays luminal glucose concentration along SF nephrons and along the longest of the JM nephrons. Along both SFPCT and JMPCT, the glucose concentration changes little, increasing from 5 to 6 mM; i.e., glucose reabsorption now keeps pace with volume reabsorption. Despite water reabsorption in PST, there is a small decrease in glucose concentration in SFPST and JMPST, where glucose reabsorption proceeds via SGLT1. Within thin limbs, water reabsorption yields an increase in luminal glucose in both short and long loops, to about 8.9 and 16.6 mM, at their respective loop bends. Of note, the mixed glucose concentration at initial CNT is quite close to that of the SF nephrons. This derives from the fact that there is spread in long loop glucose concentrations at end-DCT. At its bend, the shortest and most abundant of the long loops actually has a lower glucose concentration, 8.4 mM, than at the tip of the SF loop. This derives from the observation noted in Table 4 of the companion paper (40) that TGF activation increases from the longest to the shortest of the long loops, so that the shortest of these long loops is best able to reabsorb filtered glucose. By the end of the collecting duct, urine glucose concentration has increased to 46 mM. The bottom pane of Fig. 8 displays the glucose flows within SF and combined JM nephrons, and then in the common CNT-CD. The filtered load of glucose for the whole kidney is about 6.6 μmol/min, and excreted glucose is 2.4 μmol/min. Thus, with SGLT2 inhibition, total proximal glucose reabsorption is 4.2 μmol/min, compared with 7.7 μmol/min under baseline conditions (Table 3).
Table 3.
Segmental volume and solute delivery and reabsorption: 95% inhibition of SGLT2; ambient glucose = 5 mM
| Superficial Nephrons | ||||||
|---|---|---|---|---|---|---|
| SFPCT | SFPST | sDHL | AHLm | AHLc | DCT | |
| Delivery | ||||||
| Fv, μl/min | 691.2 | 341.8 | 242.6 | 154.3 | 156.2 | 152.9 |
| Na+, μmol/min | 99.54 | 48.82 | 44.31 | 42.76 | 27.49 | 14.16 |
| K+ | 3.46 | 1.85 | 1.69 | 1.59 | 0.69 | 0.28 |
| HCO3− | 17.28 | 5.41 | 5.16 | 5.02 | 2.66 | 1.15 |
| NH4+ | 0.14 | 0.12 | 0.41 | 0.44 | 0.39 | 0.05 |
| Net acid | −17.09 | −5.18 | −4.70 | −4.60 | −2.18 | −0.84 |
| Urea | 3.46 | 2.16 | 1.93 | 2.13 | 2.12 | 2.04 |
| Glucose | 3.46 | 2.11 | 1.37 | 1.37 | 1.37 | 1.37 |
| Reabsorption | ||||||
| Fv, μl/min | 349.4 | 99.2 | 88.3 | −2.0 | 3.3 | 10.8 |
| Na+, μmol/min | 50.71 | 4.51 | 1.56 | 15.26 | 13.33 | 4.13 |
| K+ | 1.60 | 0.16 | 0.10 | 0.90 | 0.41 | −0.27 |
| HCO3− | 11.87 | 0.24 | 0.14 | 2.36 | 1.51 | 0.68 |
| NH4+ | 0.02 | −0.29 | −0.03 | 0.05 | 0.34 | −0.16 |
| Net acid | −11.90 | −0.49 | −0.10 | −2.42 | −1.34 | −1.09 |
| Urea | 1.30 | 0.23 | −0.20 | 0.01 | 0.08 | 0.06 |
| Glucose | 1.35 | 0.74 | 0.00 | 0.00 | 0.00 | 0.00 |
| Juxtamedullary Nephrons | ||||||||
|---|---|---|---|---|---|---|---|---|
| JMPCT | JMPST | lDHLu | lDHLl | tAHL | AHLm | AHLc | DCT | |
| Delivery | ||||||||
| Fv, μl/min | 636.0 | 301.0 | 227.3 | 138.4 | 98.9 | 99.9 | 104.8 | 107.6 |
| Na+, μmol/min | 91.62 | 42.81 | 39.31 | 37.45 | 33.37 | 28.51 | 20.38 | 12.79 |
| K+ | 3.18 | 1.71 | 1.55 | 1.38 | 1.25 | 1.04 | 0.57 | 0.29 |
| HCO3− | 15.90 | 3.88 | 3.72 | 3.67 | 3.50 | 2.53 | 1.35 | 0.58 |
| NH4+ | 0.13 | 0.12 | 0.38 | 0.43 | 0.41 | 0.41 | 0.33 | 0.06 |
| Net acid | −15.73 | −3.64 | −3.25 | −3.23 | −3.10 | −2.10 | −0.92 | −0.31 |
| Urea | 3.18 | 2.02 | 1.86 | 1.87 | 7.55 | 6.67 | 6.42 | 6.16 |
| Glucose | 3.18 | 1.77 | 1.03 | 1.03 | 1.03 | 1.03 | 1.03 | 1.03 |
| Reabsorption | ||||||||
| Fv, μl/min | 335.0 | 73.8 | 88.9 | 39.5 | −1.0 | −4.8 | −2.9 | 1.1 |
| Na+, μmol/min | 48.79 | 3.50 | 1.86 | 4.08 | 4.86 | 8.14 | 7.59 | 2.18 |
| K+ | 1.47 | 0.15 | 0.17 | 0.13 | 0.21 | 0.47 | 0.28 | −0.13 |
| HCO3− | 12.02 | 0.16 | 0.05 | 0.17 | 0.97 | 1.18 | 0.77 | 0.31 |
| NH4+ | 0.00 | −0.26 | −0.05 | 0.02 | 0.00 | 0.08 | 0.27 | −0.09 |
| Net acid | −12.09 | −0.38 | −0.02 | −0.13 | −1.00 | −1.17 | −0.61 | −0.54 |
| Urea | 1.16 | 0.16 | −0.01 | −5.68 | 0.88 | 0.25 | 0.26 | 0.20 |
| Glucose | 1.41 | 0.74 | 0.00 | 0.00 | 0.00 | 0.00 | 0.00 | 0.00 |
| Distal Nephron | |||||
|---|---|---|---|---|---|
| CNT | CCD | OMCD | IMCD | Total | |
| Delivery | |||||
| Fv, μl/min | 248.6 | 182.0 | 141.2 | 68.2 | 52.1 |
| Na+, μmol/min | 20.63 | 10.54 | 9.60 | 9.52 | 7.55 |
| K+ | 0.98 | 6.23 | 6.25 | 5.50 | 4.70 |
| HCO3− | 0.75 | 0.67 | 0.59 | 0.51 | 0.38 |
| NH4+ | 0.36 | 0.39 | 0.45 | 0.78 | 0.94 |
| Net acid | 0.48 | 0.75 | 0.65 | 0.89 | 1.16 |
| Urea | 7.94 | 7.73 | 7.61 | 6.21 | 10.72 |
| Glucose | 2.40 | 2.40 | 2.40 | 2.40 | 2.40 |
| Reabsorption | |||||
| Fv, μl/min | 66.6 | 40.8 | 73.0 | 16.1 | 1275.0 |
| Na+, μmol/min | 10.10 | 0.94 | 0.08 | 1.96 | 183.54 |
| K+ | −5.25 | −0.02 | 0.75 | 0.80 | 1.93 |
| HCO3− | 0.08 | 0.08 | 0.08 | 0.13 | 32.80 |
| NH4+ | −0.03 | −0.06 | −0.33 | −0.17 | −0.68 |
| Net acid | −0.27 | 0.09 | −0.24 | −0.27 | −33.97 |
| Urea | 0.22 | 0.11 | 1.40 | −4.50 | −4.08 |
See the text for definitions.
Fig. 8.
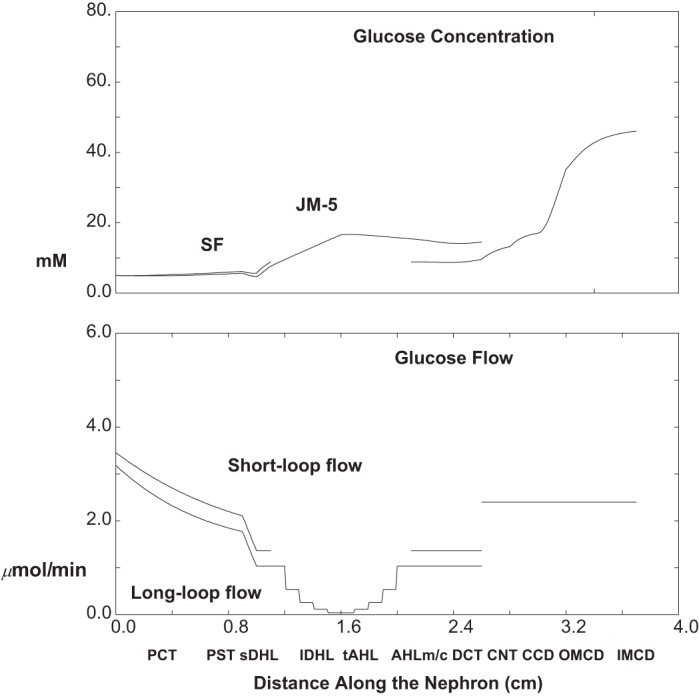
Glucose concentration and flows as a function of distance along the nephron: 95% 1Na+:1glucose cotransporter (SGLT2) inhibition (ambient glucose = 5 mM). The top pane shows luminal concentrations in SF nephrons, in the longest of the JM nephrons, and in the common CNT-collecting duct (CD) system. The bottom pane shows axial glucose flows in SF and combined JM nephrons, which add at the initial CNT-CD.
Fig. 9.
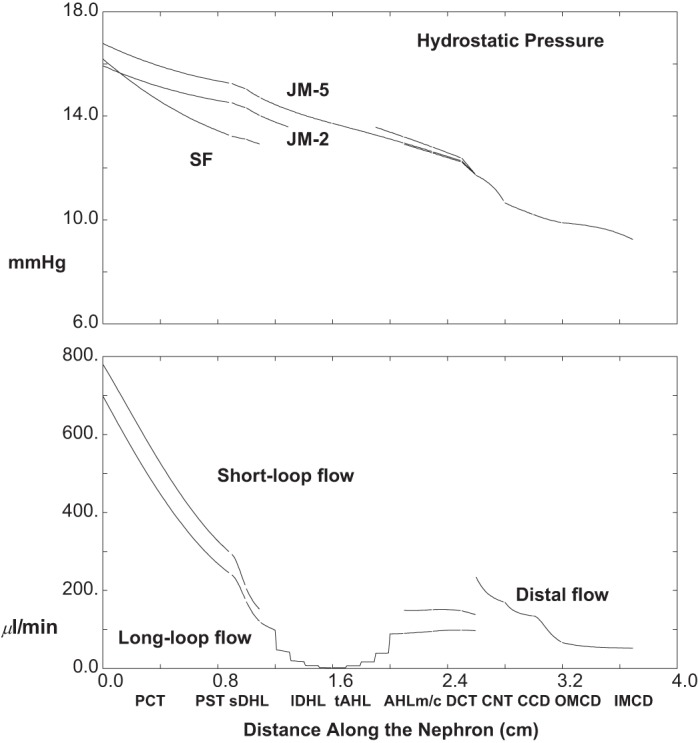
Pressure and volume flow as a function of distance along the nephron: 95% SGLT2 inhibition (ambient glucose = 5 mM). Data are plotted as in Fig. 2 (with increase in pressure scale).
Fig. 10.

Segmental delivery and transport of Na+ (top tier), K+ (middle tier), and urea (bottom tier): 95% SGLT2 inhibition (ambient glucose = 5 mm). Data are plotted as in Fig. 3.
The top pane of Fig. 9 shows axial profiles of pressure in three nephrons (SF and short and long JM); the bottom pane shows volume flow along SF and the aggregate JM nephron population. Compared with baseline conditions, whole kidney GFR is decreased by about 14% to 1.33 ml/min, due to TGF activation by the increase in distal delivery (CNT flow increases 30% to 249 μl/min); final urine flow, 52 μl/min, is about three times baseline. Under baseline conditions, total PCT volume reabsorption is 966 μl/min (63% of GFR), and with SGLT2 inhibition it decreases to 684 μl/min (52% of GFR). Thus the impact of altered glucose transport on proximal volume reabsorption (29% reduction) is greater than what might be expected from the simple reduction in GFR. In this simulation of SGLT2 inhibition, the glucose concentration along luminal SFPCT and JMPCT changes little (staying from 5 to 6 mM); i.e., glucose reabsorption now keeps pace with volume reabsorption. The presence of this additional luminal osmole (normally depleted within the first 2 mm of tubule length) acts to blunt volume reabsorption. Distal hydrostatic pressures with SGLT2 inhibition are increased to 12.4 mmHg at initial CNT, and 9.8 mmHg at end-IMCD (compared with baseline 9.6 and 8.3 mmHg), due to the increase in distal flows. The increase in PCT pressure reflects the distal increase, although the pressure drop along PCT is reduced. The lower PCT pressure drop reflects the lower PCT flow and also the larger cross-sectional area of this compliant tubule.
Figure 10 and Table 3 display segmental solute fluxes with SGLT2 inhibition; in broad terms, they show increased excretion of Na+, K+, and urea, with little change in net acid. The 72% increase in distal Na+ delivery from baseline (12.0 to 20.6 μmol/min) derives from a combined 29% increase in volume flow and 34% increase in Na+ concentration (62–83 mM). With enhanced distal delivery, absolute CNT Na+ reabsorption is increased to 10.1 μmol/min (compared with baseline 8.9 μmol/min), although fractional CNT Na+ reabsorption decreases from 74 to 49% of the entering flow. The remaining segmental Na+ fluxes are small, and absolute Na+ excretion is 7.6 μmol/min, about five times baseline excretion. Taking into account TGF-mediated reduction of GFR, the fractional excretion of Na+ (4%) with SGLT2 inhibition is six times baseline. Both the increases in CNT Na+ delivery and volume flow increase K+ excretion. Enhanced CNT Na+ reabsorption takes K+ secretion from 4.7 (baseline) to 5.3 μmol/min. Beyond that, faster volume flow along the CD changes CCD K+ flux from reabsorptive to slightly secretory, and decreases total CD K+ reabsorption from 2.8 to 1.5 μmol/min. The combined effect is an increase in K+ excretion from 2.8 to 4.7 μmol/min, so that compared with baseline, the fractional excretion of K+ goes from 36 to 71%. The higher axial volume flows also produce a doubling of absolute urea excretion, both by increasing distal delivery and by enhancing secretion in IMCD (where peritubular urea is high). With higher distal flow, HCO3− excretion increases from 0.07 to 0.38 μmol/min, reflecting the increase in urine flow plus the increase in urine HCO3− to 7.3 mM (pH 6.54). With the increase in urine pH, there is a decrease in urinary NH4+ concentration to 18 mM, although the increase in urine flow provides for an overall increase in NH4+ excretion from 0.63 to 0.94 μmol/min. At higher urine pH, one would expect reduced TA excretion, but in fact it remains constant (0.56 μmol/min at baseline and 0.60 μmol/min with SGLT2 inhibition). This reflects an increase in absolute phosphate excretion from 1.1 to 1.3 μmol/min. With SGLT2 inhibition, fractional proximal tubule phosphate reabsorption decreases from a baseline of 73 to 61% of filtered load, and this is consistent with the magnitude of the overall flow-mediated reduction in PCT transport. In sum, counterbalancing changes in both HCO3− and NH4+ excretion yield no change in net acid excretion (1.12 to 1.16 μmol/min).
Osmotic Diuresis
Osmotic diuresis is represented by setting ambient glucose concentrations (lumen and blood) to 30 mM, so that glycosuria ensues. Table 4 and Figs. 11, 12, and 13 contain the results of this simulation, which show similarities and differences with the diuresis of SGLT2 inhibition. In Fig. 11, the top pane displays luminal glucose concentration along SF nephrons and along the longest of the JM nephrons. Within both SFPCT and JMPCT, the glucose concentration drops sharply, decreasing to 20.0 and 10.9. Despite continued glucose reabsorption in PST, water reabsorption increases luminal glucose concentration in both SFPST and JMPST, and continues to concentrate luminal glucose in thin limbs. Within the thin limbs, water reabsorption yields an increase in luminal glucose in both short and long loops, to about 35 mM, at their respective loop bends. At the point of mixing in early CNT, luminal glucose concentrations are quite close for SF and JM nephrons, and by the end of the collecting duct, urine glucose concentration has increased to 155 mM, with a final urine osmolality of 762 mosmol/kgH2O. The bottom pane of Fig. 11 displays the glucose flows within SF and combined JM nephrons, and then in the common CNT-CD. The filtered load of glucose to SF and JM nephrons is 23.4 and 21.0 μmol/min, with the lower JM load deriving from stronger TGF activation. The reduced glucose load to JM nephrons allows for greater fractional reabsorption, 86%, compared with 78% in SF nephrons. In all, the combined filtered glucose load is 44.4 μmol/min (compared with 7.7 μmol/min at baseline), and total proximal reabsorption is 36.3 μmol/min (82%). Excreted glucose is 8.1 μmol/min, with JM nephrons contributing about half as much as SF nephrons.
Fig. 11.
Glucose concentration and flows as a function of distance along the nephron: osmotic diuresis (ambient glucose = 30 mM). Data are plotted as in Fig. 8.
Fig. 12.
Pressure and volume flow as a function of distance along the nephron: osmotic diuresis (ambient glucose = 30 mM). Data are plotted as in Fig. 2.
Fig. 13.

Segmental delivery and transport of Na+ (top tier), K+ (middle tier), and urea (bottom tier): osmotic diuresis (ambient glucose = 30 mM). Data are plotted as in Fig. 3.
The top pane of Fig. 12 shows axial profiles of pressure in three nephrons (SF and short and long JM); the bottom pane shows volume flow along SF and the aggregate JM nephron population. Compared with baseline conditions, TGF decreases whole kidney GFR only slightly to 1.48 ml/min (from 1.54); CNT flow increases to 234 μl/min, and final urine flow to 52 μl/min. The decrease in GFR is much less than the reduction seen with SGLT2 inhibition; CNT flows are comparable; and urine flows are identical. The difference in TGF effect is due to the lower NaCl concentration at end-AHL in the presence of glucose. In superficial nephrons, for example, end-AHL Na+ and Cl− concentrations are 83 and 67 mM with 35 mM glucose, compared with 93 and 79 mM with 9 mM glucose in the SGLT2 simulation; baseline concentrations of Na+ and Cl− are 77 and 65 mM. It is also notable that with osmotic diuresis, the reduction in GFR derives largely from JM nephrons, in which luminal glucose has a greater impact on luminal Cl−. For example, in the longest JM nephron, end-AHL Na+ and Cl− concentrations are 81 and 76 mM, compared with 70 and 65 mM at baseline. The higher CNT volume flow with osmotic diuresis provides an increased CNT hydrostatic pressure, 11.7 mmHg (according to Eq. 11), and end-IMCD pressure, 9.2 mmHg. As with SGLT2 inhibition, the increase in PCT pressure reflects the distal increase, while the pressure drop along the PCT is reduced due to the lower PCT flow and also the larger cross-sectional area of this compliant tubule.
Figure 13 and Table 4 display segmental solute fluxes with osmotic diuresis, and the overall excretion profile is similar to the impact of SGLT2 inhibition. CNT Na+ delivery is 16.6 μmol/min with approximately equal contributions from SF and JM nephrons; CNT Na+ reabsorption is 9.5 μmol/min; and excreted Na+ is 5.1 μmol/min (compared with 20.6, 10.1, and 7.6 μmol/min with SGLT2 inhibition). The lower CNT Na+ delivery derives from the fact that despite the osmotic diuresis in the proximal tubule, there is still glucose-mediated Na+ uptake. With respect to K+, CNT secretion is 5.3 μmol/min, CCD has a small secretory flux, and reabsorption in the remainder of the CD is 1.6 μmol/min, so that excretion is 4.7 μmol/min (basically identical to the distal K+ fluxes with SGLT2 inhibition). Compared with baseline, the striking difference in distal K+ fluxes is the diminished CD K+ reabsorption with higher flow. By virtue of the increased urine flow, the increase in urea excretion with osmotic diuresis is also comparable to the result with SGLT2 inhibition. With osmotic diuresis, HCO3− excretion increases to 0.34 μmol/min (baseline 0.07 μmol/min), reflecting the increase in urine flow plus the increase in urine HCO3− to 6.4 mM (pH 6.50). Luminal NH4+ concentration is 18 mM, although the increase in urine flow provides for an overall increase in NH4+ excretion to 0.93 μmol/min (from baseline 0.63 μmol/min). Despite the higher urine pH (compared with baseline), there is greater excretion of TA, 0.69 μmol/min, and this is due to the phosphaturia (38% of filtered load, compared with 27% at baseline). The reduction in proximal tubule phosphate reabsorption derives from an increase in cytosolic Na+ that accompanies the increased Na+-glucose uptake (thus decreasing the driving force for Na+-H2PO4− cotransport). In sum, the increase in HCO3− and the increase in NH4+ excretion nearly balance, so with the small change in TA excretion, net acid excretion, 1.28 μmol/min, is little different from the baseline rate (1.12 μmol/min).
SGLT2 Inhibition with Hyperglycemia
The calculations of Table 5 and Figs. 14, 15, and 16 are done with a 95% reduction in SGLT2 activity in both SFPCT and JMPCT, and ambient glucose at 10 mM. In Fig. 14, the top pane displays luminal glucose concentration along SF nephrons and along the longest of the JM nephrons. Along both SFPCT and JMPCT, the glucose concentration increases from 10 to 14 mM; i.e., glucose reabsorption now lags behind volume reabsorption. Despite full SGLT1 function in PST, there are still small increases in glucose concentration in SFPST and JMPST, to 15 mM, and within the thin limbs, water reabsorption yields an increase in luminal glucose in both short and long loops, to about 24 and 43 mM, respectively, at their loop bends. At the point of mixing in early CNT, luminal glucose concentration is close to its concentration within SF DCT, and by the end of the collecting duct, urine glucose concentration has increased to 83 mM, with a final urine osmolality of 692 mosmol/kgH2O. The bottom pane of Fig. 14 displays the glucose flows within SF and combined JM nephrons, and then in the common CNT-CD. The filtered glucose load to SF and JM nephrons is 6.4 and 5.8 μmol/min (Table 5). Due to TGF activation with glycosuria, these values are about 25% lower than with hyperglycemia alone (10 mM glucose), when filtered loads were 8.7 and 8.0 μmol/min. Compared with normoglycemic (5 mM) SGLT2 inhibition (when glucose filtration was 3.5 and 3.2 μmol/min), doubling the glucose concentration to 10 mM produced less than a doubling of the filtered load, reflecting stronger TGF activation with greater glycosuria. Of note, absolute PCT glucose reabsorption with hyperglycemia is little changed from normoglycemia, due to the overall decrease in fluxes that accompany TGF-mediated reduction in luminal flow velocity. In all, the combined filtered glucose load for the whole kidney is 12.1 μmol/min, total proximal glucose reabsorption is 4.4 μmol/min (36%), and excreted glucose is 7.7 μmol/min.
Table 5.
Segmental volume and solute delivery and reabsorption: 95% inhibition of SGLT2; ambient glucose = 10 mM
| Superficial Nephrons | ||||||
|---|---|---|---|---|---|---|
| SFPCT | SFPST | sDHL | AHLm | AHLc | DCT | |
| Delivery | ||||||
| Fv, μl/min | 635.4 | 358.7 | 265.0 | 172.9 | 175.6 | 174.7 |
| Na+, μmol/min | 91.44 | 50.87 | 47.42 | 46.46 | 31.34 | 17.60 |
| K+ | 3.18 | 1.91 | 1.81 | 1.74 | 0.79 | 0.33 |
| HCO3− | 15.88 | 5.95 | 5.70 | 5.58 | 3.21 | 1.56 |
| NH4+ | 0.13 | 0.12 | 0.43 | 0.48 | 0.44 | 0.06 |
| Net acid | −15.70 | −5.73 | −5.21 | −5.11 | −2.69 | −1.27 |
| Urea | 3.18 | 2.15 | 1.98 | 2.22 | 2.21 | 2.15 |
| Glucose | 6.35 | 4.95 | 4.09 | 4.09 | 4.09 | 4.09 |
| Reabsorption | ||||||
| Fv, μl/min | 276.4 | 93.7 | 92.1 | −2.7 | 1.0 | 8.2 |
| Na+, μmol/min | 40.60 | 3.46 | 0.96 | 15.11 | 13.75 | 4.33 |
| K+ | 1.26 | 0.10 | 0.07 | 0.95 | 0.46 | −0.28 |
| HCO3− | 9.93 | 0.25 | 0.12 | 2.37 | 1.65 | 0.87 |
| NH4+ | 0.01 | −0.31 | −0.06 | 0.04 | 0.38 | −0.16 |
| Net acid | −9.97 | −0.52 | −0.10 | −2.42 | −1.42 | −1.34 |
| Urea | 1.02 | 0.18 | −0.24 | 0.00 | 0.07 | 0.05 |
| Glucose | 1.40 | 0.85 | 0.00 | 0.00 | 0.00 | 0.00 |
| Juxtamedullary Nephrons | ||||||||
|---|---|---|---|---|---|---|---|---|
| JMPCT | JMPST | lDHLu | lDHLl | tAHL | AHLm | AHLc | DCT | |
| Delivery | ||||||||
| Fv, μl/min | 574.6 | 321.1 | 251.6 | 157.7 | 115.1 | 116.8 | 123.1 | 128.2 |
| Na+, μmol/min | 82.74 | 45.36 | 42.65 | 41.15 | 37.87 | 33.32 | 25.13 | 17.20 |
| K+ | 2.87 | 1.77 | 1.68 | 1.52 | 1.44 | 1.23 | 0.71 | 0.40 |
| HCO3− | 14.36 | 4.63 | 4.42 | 4.37 | 4.19 | 2.98 | 1.78 | 0.88 |
| NH4+ | 0.11 | 0.12 | 0.40 | 0.46 | 0.46 | 0.48 | 0.39 | 0.07 |
| Net acid | −14.21 | −4.40 | −3.93 | −3.90 | −3.75 | −2.49 | −1.30 | −0.61 |
| Urea | 2.87 | 2.01 | 1.89 | 1.91 | 7.98 | 7.87 | 7.62 | 7.36 |
| Glucose | 5.75 | 4.44 | 3.61 | 3.61 | 3.61 | 3.61 | 3.61 | 3.61 |
| Reabsorption | ||||||||
| Fv, μl/min | 253.5 | 69.4 | 93.9 | 42.6 | −1.7 | −6.3 | −5.0 | −1.0 |
| Na+, μmol/min | 37.38 | 2.70 | 1.50 | 3.28 | 4.54 | 8.19 | 7.94 | 2.32 |
| K+ | 1.10 | 0.09 | 0.16 | 0.08 | 0.21 | 0.52 | 0.31 | −0.13 |
| HCO3− | 9.74 | 0.20 | 0.05 | 0.18 | 1.21 | 1.21 | 0.89 | 0.44 |
| NH4+ | −0.01 | −0.28 | −0.06 | 0.00 | −0.02 | 0.09 | 0.32 | −0.09 |
| Net acid | −9.81 | −0.46 | −0.03 | −0.16 | −1.26 | −1.19 | −0.69 | −0.73 |
| Urea | 0.86 | 0.12 | −0.02 | −6.07 | 0.11 | 0.25 | 0.26 | 0.19 |
| Glucose | 1.31 | 0.83 | 0.00 | 0.00 | 0.00 | 0.00 | 0.00 | 0.00 |
| Distal Nephron | |||||
|---|---|---|---|---|---|
| CNT | CCD | OMCD | IMCD | Total | |
| Delivery | |||||
| Fv, μl/min | 295.6 | 253.4 | 214.8 | 110.3 | 92.6 |
| Na+, μmol/min | 28.15 | 17.54 | 16.52 | 16.31 | 14.26 |
| K+ | 1.14 | 6.61 | 6.76 | 6.24 | 5.65 |
| HCO3− | 1.13 | 1.03 | 0.93 | 0.86 | 0.74 |
| NH4+ | 0.38 | 0.42 | 0.49 | 0.90 | 1.12 |
| Net acid | 0.18 | 0.52 | 0.43 | 0.70 | 0.99 |
| Urea | 9.26 | 9.07 | 8.98 | 7.96 | 14.81 |
| Glucose | 7.70 | 7.70 | 7.70 | 7.70 | 7.70 |
| Reabsorption | |||||
| Fv, μl/min | 42.2 | 38.6 | 104.5 | 17.7 | 1117.2 |
| Na+, μmol/min | 10.61 | 1.02 | 0.21 | 2.06 | 159.96 |
| K+ | −5.47 | −0.15 | 0.52 | 0.59 | 0.40 |
| HCO3− | 0.11 | 0.10 | 0.07 | 0.11 | 29.50 |
| NH4+ | −0.04 | −0.07 | −0.41 | −0.21 | −0.88 |
| Net acid | −0.33 | 0.09 | −0.27 | −0.30 | −30.91 |
| Urea | 0.19 | 0.09 | 1.02 | −6.85 | −8.76 |
Fig. 14.
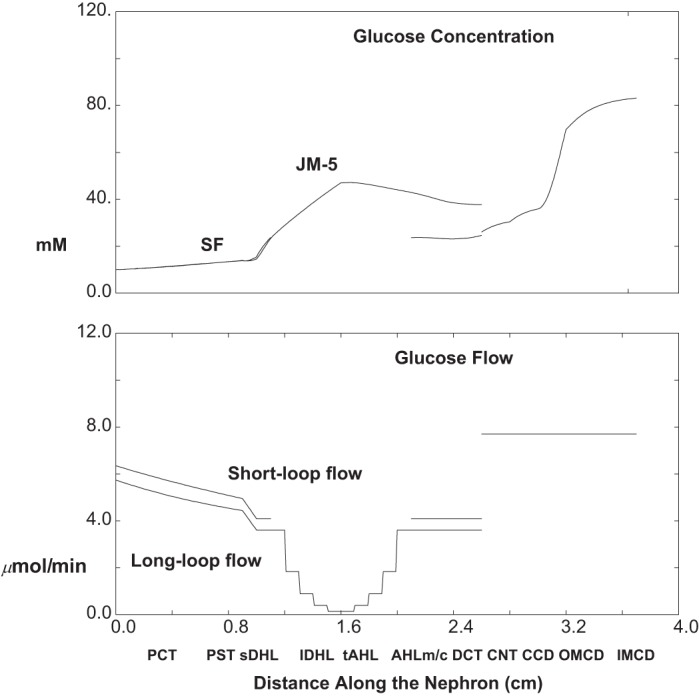
Glucose concentration and flow as a function of distance along the nephron: 95% SGLT2 inhibition with hyperglycemia (ambient glucose = 10 mM). Data are plotted as in Fig. 8.
Fig. 15.

Pressure and volume flow as a function of distance along the nephron: 95% SGLT2 inhibition with hyperglycemia (ambient glucose = 10 mM). Data are plotted as in Fig. 2.
Fig. 16.

Segmental delivery and transport of Na+ (top tier), K+ (middle tier), and urea (bottom tier): 95% SGLT2 inhibition with hyperglycemia (ambient glucose = 10 mm). Data are plotted as in Fig. 3.
The top pane of Fig. 15 shows axial profiles of pressure in three nephrons (SF and short and long JM); the bottom pane shows volume flow along SF and the aggregate JM nephron population. Compared with baseline conditions, whole kidney GFR is decreased by about 21% to 1.21 ml/min, due to TGF activation by the increase in distal delivery (CNT flow increases 50% to 296 μl/min); final urine flow, 93 μl/min, is about five times baseline. Total PCT volume reabsorption is 530 μl/min (44% of GFR), compared with 63% of GFR at baseline, and 52% of GFR with normoglycemic SGLT2 inhibition, illustrating abrogation of GTB due to high luminal glucose. Due to the increase in distal volume flow, distal hydrostatic pressures with SGLT2 inhibition and hyperglycemia are increased to 14.8 mmHg at initial CNT, and 10.8 mmHg at end-IMCD (compared with baseline 9.6 and 8.3 mmHg). With these distal pressures, early proximal pressures are high, about 19–21 mmHg, although the pressure drop along the PCT is small, and the difference from early PCT to CNT (about 6 mmHg) is little different from the gradient under baseline conditions (about 5 mmHg).
Figure 16 and Table 5 display segmental solute fluxes with SGLT2 inhibition and hyperglycemia (10 mM glucose). Overall, there is even greater excretion of Na+, K+, and urea than was predicted with osmotic diuresis (30 mM glucose); net acid excretion was little changed. Distal Na+ delivery (to CNT) was 28.2 μmol/min, and this may be viewed in the context of Na+ delivery at baseline, with normoglycemic SGLT2 inhibition, and with osmotic diuresis, 12.0, 20.6, and 16.6 μmol/min. With increased delivery, there is a less than proportional increase in distal nephron (CNT plus CD) Na+ reabsorption of 13.9 μmol/min (compared with 10.5, 13.1, and 11.5 μmol/min at baseline, with normoglycemic SGLT2 inhibition, and with osmotic diuresis). Na+ excretion in this case is 14.3 μmol/min, about 10 times baseline, and about 8% of filtered load. Both the increases in CNT Na+ delivery and volume flow per se increase K+ excretion. Enhanced CNT Na+ reabsorption takes K+ secretion from 4.7 (baseline) to 5.5 μmol/min; beyond that, faster volume flow along the CD decreases total CD K+ reabsorption from 2.8 to 1.0 μmol/min. The combined effect is an increase in K+ excretion from 2.8 to 5.7 μmol/min, so that compared with baseline, the fractional excretion of K+ goes from 36 to 93%. The higher axial volume flows also produce a threefold increase in urea excretion. With higher distal flow, HCO3− excretion increases from 0.07 to 0.74 μmol/min, reflecting the increase in urine flow plus the increase in urine HCO3− to 8.0 mM (pH 6.58). With the increase in urine pH, there is a decrease in urinary NH4+ concentration to 12.0 mM, although the increase in urine flow provides for an overall increase in NH4+ excretion from 0.63 to 1.12 μmol/min. At higher urine pH, one would expect reduced TA excretion, but in fact it increases slightly (0.56 μmol/min at baseline and 0.62 μmol/min with SGLT2 inhibition and hyperglycemia). This reflects an increase in absolute phosphate excretion from 1.1 to 1.5 μmol/min. With SGLT2 inhibition and hyperglycemia, fractional proximal tubule phosphate reabsorption decreases from a baseline of 73 to 52% of filtered load, and this is consistent with the magnitude of the overall flow-mediated reduction in PCT transport. In sum, counterbalancing changes in both HCO3− and NH4+ excretion yields little change in net acid excretion (1.12 to 0.99 μmol/min).
DISCUSSION
The present model confers the ability to examine the impact of proximal events on distal transport, and to identify the contributions of SF and JM nephrons. In the whole kidney, there is convergence of SF and JM nephrons within the connecting segment, so that the distal nephron is the recipient of a mix of luminal fluid from the full ensemble of proximal tubules and Henle limbs. The importance of this exercise derives from the fact that proximal transport, at least for water or Na+ or HCO3−, is about an order of magnitude greater than distal transport. Thus even relatively small perturbations of proximal transport should have the capacity to swamp distal capacity and produce major derangements in renal solute excretion. There are at least two regulatory systems which act to protect the distal nephron from perturbations in proximal transport: GTB and TGF. GTB, which derives from flow-dependent reabsorption, seems to be the more basic of the mechanisms, providing distal delivery at a relatively constant fraction of filtered load. TGF takes this homeostasis further, by modulating SNGFR to achieve an absolute target for distal load. It must be acknowledged that neither GTB nor TGF have been studied in JM nephrons, so that as a first approximation, representation of each process began with its SF formulation scaled to JM size and flow (40).
A central feature of this model is that distal contributions of volume and solute from SF and JM nephrons are comparable, basically reflecting model design, with JM nephrons about a third of the total (14) and filtering at twice the rate of SF glomeruli (11). Within the JM population, the exponential decrease in the number of Henle limbs as a function of inner medullary depth (halving with each millimeter) further diminishes functional differences between the two populations; i.e., most JM nephrons are relatively short-looped. If one looks beyond the overall distal contribution (identified here as presentation to CNT), there are, however, notable differences between SF and JM Henle loops: The bulk of distal urea delivery (about 75% under baseline conditions) derives from JM nephrons. With respect to Na+ and HCO3−, JM nephrons show diffusive reabsorption within tAHL, followed by medullary AHL fluxes that are lower than those of SF AHL; the net distal delivery for these two solutes is comparable for SF and JM nephrons. Diffusive thin limb HCO3− reabsorption derives from the estimate for tAHL Cl− permeability, and the assumption of HCO3− permeability about 20% that of Cl− (40); the increase in long loop HCO3− concentration (from late PCT to LOH) is due to water reabsorption and has been documented experimentally (9). This model finding supports the speculation of DuBose and Lucci (8) that the long-loop HCO3− reabsorption, which persists despite carbonic anhydrase inhibition, may derive from favorable passive gradients for electrodiffusive flux of HCO3−.
Table 6 provides a comparison of the inner medullary solute balance of this model with several prior models. The model of Stephenson et al. (27) is a model with a single full-length JM nephron to five SF nephrons, in which parameters were chosen to be close to those of the rabbit kidney. In that work, the flows were normalized, so that absolute medullary solute delivery is difficult to determine. The model of Thomas (28) is an update of the prior model of Wexler et al. (42), in which there are two JM nephrons to four SF nephrons, and in which parameters are derived from the rat and hamster. The model of Layton (15, 16) is the conjunction of prior OM and IM models of the rat kidney (17, 18), in which the ratio of SF to JM nephrons is 2:1, and in which there is an exponentially tapering number of medullary nephrons as one proceeds from IM base to tip. The kidney models of Thomas and Layton allow for a more direct comparison with the current work, and for those models the absolute IM flows in Table 6 were estimated from the published tubule flows by assuming 12,000 JM nephrons for each. Na+ fluxes are displayed in the top pane of Table 6, in which IM delivery for this model can be seen to be midway between the models of Thomas and Layton. Na+ reabsorption, both absolute and relative, is greater in the present model than for the three prior models, and this derives from both lDHLl and tAHL Na+ reabsorption. In the case of urea (bottom pane), this model is closer to the entering flow of the Layton model, and the exiting flows are nearly identical to that model. Experimental determination of renal medullary solute balance does not exist, but there have been measurements of LOH solute concentrations by Jamison and coworkers (2). Sampling fluid from LOH bends, they found fluid-to-plasma (TF/P) inulin ratio of 6.7, fluid osmolality 938 mosmol/kgH2O, Na+ of 344 mM, and K+ of 26 mM, so that TF/P(Na) = 2.3 and TF/P(K) = 5.8, and with that, fractional delivery of these solutes (relative to filtered load) was 39 and 94%, respectively (2). In another study by this group, in loops for which TF/P(inulin) = 7, it was found that TF/P(urea) = 40. In the present model, the JM nephron which descends 3 mm into the inner medulla appears to be closest to that of the experiments, in the sense that for this nephron under baseline conditions, TF/P(inulin) is 6.3, with fluid osmolality 932 mosmol/kgH2O, and TF/P for Na+, K+, and urea are 2.5, 2.8, and 34, respectively. The largest discrepancy between the model nephron and experiments is the tubule fluid K+ concentration. This derives from the fact that in this model, IM interstitial K+ was taken to be between 10 and 20 mM, while in the rats of these investigators, vasa recta plasma K+ concentration was 36 mM (2).
Table 6.
Baseline inner medullary Na+ and urea delivery and transport: comparison with prior models
| lDHLl Base (per tubule) |
Total IM |
tAHL Base (per tubule) |
Total IM |
IM Na+ Reabs. | Fract. Reabs. | |||||
|---|---|---|---|---|---|---|---|---|---|---|
| FvM | CM(Na) | FM(Na) | FM(Na) | FvM | CM(Na) | FM(Na) | FM(Na) | |||
| Norm. | M | Norm. | M | |||||||
| Stephenson et al. (27) | 0.463 | 0.295 | 0.136 | 0.427 | 0.260 | 0.111 | 0.19 | |||
| nl/min | M | nmol/min | μmol/min | nl/min | M | nmol/min | μmol/min | μmol/min | ||
| Thomas (28) | 5.64 | 0.506 | 2.85 | 34.2 | 6.54 | 0.370 | 2.42 | 29.0 | 5.2 | 0.15 |
| Layton (15) | 6.0 | 0.360 | 2.16 | 25.9 | 6.0 | 0.300 | 1.80 | 21.6 | 4.3 | 0.17 |
| Current model (Table 1) | 31.7 | 23.0 | 8.7 | 0.27 | ||||||
| lDHLl Base (per tubule) |
Total IM |
tAHL Base (per tubule) |
Total IM |
IM Urea Secr. | |||||
|---|---|---|---|---|---|---|---|---|---|
| FvM | CM(urea) | FM(urea) | FM(urea) | FvM | CM(urea) | FM(urea) | FM(urea) | ||
| Norm. | M | Norm. | M | ||||||
| Stephenson et al. (27) | 0.463 | 0.011 | 0.005 | 0.427 | 0.045 | 0.019 | |||
| nl/min | M | nmol/min | μmol/min | nl/min | M | nmol/min | μmol/min | μmol/min | |
| Thomas (28) | 5.64 | 0.063 | 0.35 | 4.2 | 6.54 | 0.113 | 0.74 | 8.8 | 4.6 |
| Layton (15) | 6.0 | 0.015 | 0.09 | 1.1 | 6.0 | 0.075 | 0.45 | 5.4 | 4.3 |
| Current model (Table 1) | 1.8 | 5.3 | 3.5 | ||||||
FvM and FM denote axial flows of volume and solute. Total IM is determined by multiplying tubule flows by 12,000 JM nephrons. Fract. Reabs., IM Na+ reabsorption relative to FM(Na) entry at lDHLl.
It must be acknowledged that the three models cited in Table 6 undertook computation of the medullary interstitial solute concentration profiles, which provided mass balance among the tubules, blood vessels, and CD (albeit for a limited set of solutes). In the present model, the focus has been on tubular function; there is no vasculature, and interstitial concentrations have been specified [Table 3 of the companion paper (40)]. One may still ask, how close the tubular fluxes from this model are to actually generating the interstitial profiles that have been set. That is addressed in Table 7, in which the left panes summarize OM fluxes and the right panes IM fluxes for the baseline case (Table 1). For the OM, the first three columns show total reabsorptive fluxes for the segments comprising SF loops, JM loops, and their sum with OMCD fluxes of volume, Na+, K+, HCO3−, NH4+, and urea. The fourth column is the ratio of the solute to volume fluxes, i.e., a virtual concentration of the reabsorbed fluid. For the IM, the first column is the loop flux, the second combines this with IMCD fluxes, and the third column shows reabsorbate concentrations. For Na+, both OM and IM reabsorbates are hypotonic to the interstitium. In a full medullary model, the OM would be receiving more concentrated Na+ solutions ascending from the IM vasculature, tending to support the interstitial concentration. For the IM, reabsorbate Na+ is hypertonic, but still less than the surrounding value (284 mM), and this despite ample Na+ reabsorption from JM loops. This suggests that to sustain the observed IM Na+ concentration, there may need to be reduced lDHLl water reabsorption. For K+, the OM reabsorbate is consistent with the interstitial concentration, while the IM reabsorbate suggests an interstitial concentration higher than the specified 10–20 mM. The case of HCO3− is more complex, as both OM and IM reabsorbates appear to be more acidic than their interstitium (25 mM). In a full model, however, the interstitial base can be supported by tubular NH4+ secretion with reabsorption of NH3, and that process is not captured in this table. Furthermore, in a full medullary model, there will be interstitial HCO3− replenishment from the vasculature. For NH4+, delivery to the OM is 0.1 and 0.12 μmol/min for SFPCT and JMPCT, respectively (Table 1), or between 4.2 and 5.0 pmol·min−1·tubule−1, comparable to 5.7 pmol/min reported by Good and DuBose (10), but quite a bit less than 13.2 pmol/min found by Buerkert et al. (4). Within OM, Table 7 shows an approximate doubling of luminal NH4+ flow, and this fractional increase is consistent with experimental observation (4). To sustain this rate of OM NH4+ secretion, a full model will require a robust source of additional NH4+, e.g., delivery from the IM vasculature. With respect to IM NH4+, the urinary excretion rate, 0.63 μmol/min (Table 1) is generous, but within the envelope of reported rates, and a small rate of CD NH4+ secretion is consistent with observation (reviewed in Ref. 36). The accounting in Table 7 suggests that in a full medullary model, IM NH4+ concentration will be less than the 9 mM used here, so that CD NH4+ could become reabsorptive and help support the interstitial concentration. Finally, OM urea handling shows an interstitial concentration, which is compatible with the tubule fluxes; however, IM urea fluxes cannot sustain the assigned concentration (500 mM), and this would be less in a full medullary model.
Table 7.
Overall medullary solute balance in relation to water fluxes
| Outer Medulla |
Inner Medulla |
||||||
|---|---|---|---|---|---|---|---|
| LOH-SF | LOH-JM | LOH+OMCD | LOH-IM | LOH+IMCD | |||
| Tv, μl/min | Tv, μl/min | ||||||
| 172.2 | 146.7 | 360.8 | 33.9 | 47.7 | |||
| Tk, μmol/min | Tk/Tv, mM | Tk, μmol/min | Tk/Tv, mM | ||||
| Na+ | 22.41 | 14.73 | 36.77 | 101.9 | 8.74 | 10.07 | 211.3 |
| K+ | 1.12 | 0.80 | 3.12 | 8.7 | 0.31 | 1.58 | 33.2 |
| HCO3− | 2.90 | 1.16 | 4.16 | 11.5 | 0.18 | 0.30 | 6.3 |
| NH4+ | −0.24 | −0.22 | −0.65 | −1.8 | 0.07 | 0.00 | −0.1 |
| Urea | 0.17 | 0.47 | 2.83 | 7.8 | −3.52 | −4.83 | −101.3 |
LOH-SF, net OM reabsorption from SFPST+sDHL+AHLm for SF nephrons; LOH-JM, net OM reabsorption from JMPST+lDHLu+AHLm for JM nephrons; LOH+OMCD, sum of reabsorption from LOH-SF+LOH-JM+OMCD; LOH-IM, net IM reabsorption from lDHLl+tAHL; LOH+IMCD, sum of reabsorption from LOH+IMCD; Tv, volume reabsorption from the indicated tubules; Tk, solute reabsorption from the indicated tubules; Tk/Tv, virtual concentration of either OM or IM solute entry to OM or IM volume entry.
From the perspective of model construction, perhaps the most unique feature of this work is the role of luminal hydrostatic pressure as a model variable, which is more prominent than in prior models of the renal medulla. Luminal hydrostatic pressure plus PCT compliance were indispensable to representing GTB (41). Retaining those features here added substantially to model complexity, however. The most obvious consequence of tracking hydrostatic pressures is the coupling of model nephrons. As the nephrons coalesce at CNT, there must be a unique CNT pressure, and the luminal pressure profiles for all nephrons must agree at that point. In consequence, if distal delivery from one nephron is altered, then the resulting change in distal hydrostatic pressure must be transmitted to all nephrons. Furthermore, by virtue of nephron compliance, and the impact of tubule flow velocity on reabsorption, there will be a change in distal delivery from the remaining nephrons. The fact that proximal fluxes are an order of magnitude greater than distal flows implied that such perturbations could not be ignored. Thus representing hydrostatic pressure mandated internephron coupling and simultaneous solution of the full ensemble of tubules. This aspect of the model can be viewed as a precursor to a more complete kidney model, in which medullary interstitial concentrations also couple the nephrons. With hydrostatic pressure, however, there appears to be a destabilizing aspect to the problem due to the fact that increases in distal pressure will tend to diminish proximal reabsorption (enhancing distal flow, and further elevating distal pressure). As a consequence, the Newton procedure for updating the unknown proximal tubule pressures could not be counted on to make large corrections, but rather needed to start reasonably close to the ultimate solution.
Renal glucose transport is a natural first focus for a model of this scope, as it is an example of a proximal event with distal consequences. The three cases considered are hyperglycemia without glycosuria, inhibition of PCT glucose transport, and osmotic diuresis. The impact of glucose ingestion on renal electrolyte excretion has been a focus of investigation for over half a century, with the robust observation that provision of glucose (especially to previously fasted individuals) leads to renal Na+ retention (3). In humans fasted overnight and receiving a water load (presumably suppressing ADH), challenge with a glucose load produced a prompt fall in urine output, and a fall in both Na+ and K+ excretion (20). Lindeman et al. (20) reasoned that in view of ADH suppression, the drop in urine flow must derive from enhanced proximal reabsorption; they viewed the parallel fall in Na+ and K+ excretion as confirming that the impact on transport was occurring in an aldosterone-insensitive portion of the nephron. In a more comprehensive study, Lennon et al. (19) confirmed that glucose administration produced a fall in urine flow, and reduced excretion of Na+, K+, urea, and HCO3−, and also increased urinary NH4+ and phosphate excretion, so that net acid excretion rose. Noting that glucose reduced the estimated fractional AHL delivery, (CNa+CH2O)/GFR, and finding a negative correlation of glucose reabsorption with Na+ excretion, these workers proposed that increased glucose availability in the proximal tubule stimulated Na+ reabsorption there. This view received prompt confirmation in reports of microperfused rat and rabbit PCT, in which glucose addition to the luminal perfusate sharply increased volume reabsorption (5, 33). Subsequent microperfusion of diabetic rats documented that the increased proximal Na+ reabsorption produced by a glucose load was similar to the increase in normal rats (1). Whether the impact of glucose administration in vivo is wholly attributable to its increased luminal concentration profile along the proximal tubule is uncertain. Following the glucose load, there is an increase in plasma insulin concentration, and insulin by itself decreases urinary excretion of Na+ and K+ in the isolated perfused dog kidney (24), and in the glucose-clamped kidney in vivo (6). Of note, when DeFronzo et al. (6) did proximal micropuncture on dogs receiving glucose infusions, they found no increase in proximal Na+ reabsorption. In interpreting those results, however, it should be considered that the dogs were receiving a saline infusion and the observed TF/P inulin ratios were low (1.3–1.6 range), suggesting either a limited portion of the tubule was available for sampling, or that the animals were quite volume expanded.
Hyperglycemia without osmotic diuresis is a common occurrence in diabetes and has been thought to be pathogenic in diabetic nephropathy. As envisioned by Vallon and coworkers (30, 31), a “primary” increase in proximal reabsorption by the diabetic kidney reduces distal delivery, activates TGF, and thus provokes glomerular hyperfiltration. The mechanism underlying this primary increase in proximal Na+ reabsorption is uncertain. What an early PCT model provided for this discussion was quantitative support for the action of enhanced Na+-glucose cotransport to mediate increased PCT Na+ uptake during mild hyperglycemia (34). The recent addition of a PST and LOH supplied the observation that the calculated reduction in distal Na+ delivery would be of sufficient magnitude to activate TGF to generate detectable hyperfiltration (40). What the current work adds is the prediction that the expected reduction in distal Na+ delivery could reduce both urine volume and K+ excretion to <50% of baseline values. This result may also be viewed in the context of diabetic K+ intolerance. Alternatively, this model behavior at low flows suggests that another, and perhaps important, aspect of distal transport regulation may be missing from the model. Satlin and coworkers (26) have called attention to a steep flow dependence of CCD Na+ reabsorption, especially at low perfusion rates. If that feature were included in this simulation, perhaps throughout the CD, one might predict better preservation of urine volume flow, and reduction of CD K+ reabsorption when distal flow is reduced.
The recent development of safe and specific inhibitors of SGLT2 has rekindled interest in renal glucose metabolism. One point of concern in the adoption of these drugs was the possibility of osmotic diuresis, but although there is evidence for natriuresis and volume depletion, the problem has not been severe (43). Indeed, the observation is that the drugs inhibit <50% of the reabsorption of filtered glucose (21). In large part, this is due to the fact that SGLT2 and SGLT1 are situated in series, so that with SGLT2 inhibition, there is enhanced glucose transport via SGLT1 (25). The current model captures that pattern of renal glucose transport in the simulation in which 95% of SGLT2 activity has been inhibited under normoglycemic conditions, and 36% of the filtered glucose load appears in the urine. With SGLT2 inhibition, the model kidney shows increased distal solute delivery, activation of TGF, reduction in GFR, and overall, a 29% reduction in proximal Na+ reabsorption. When Thomson and colleagues (29) performed micropuncture on hyperglycemic rats treated with the SGLT2 inhibitor dapagliflozin, they found that acute drug application increased distal Cl− delivery, lowered SNGFR, and reduced proximal volume reabsorption by 24%. One unanticipated observation from the model kidney was the impact on TGF, comparing the diuresis of SGLT2 inhibition with the osmotic diuresis of hyperglycemia. In the two simulations, CNT fluid delivery was comparable, but the reduction in GFR was several-fold greater with SGLT2 inhibition, due to higher end-AHL Cl− concentration with SGLT2 inhibition. In the case that mild hyperglycemia is superimposed on SGLT2 inhibition, model calculations suggest that natriuresis may be severe, reflecting synergy of a proximal diuretic and osmotic diuresis.
In sum, this mathematical model of the full ensemble of renal tubules from the rat kidney provides a comprehensive simulation: by virtue of the number of solutes that it tracks, its attention to renal cortical transport, its inclusion of luminal hydrostatic pressure, and its representation of two key homeostatic mechanisms, GTB and TGF. Model calculations suggest that hyperglycemia per se may drive proximal Na+ reabsorption and reduce distal delivery, and may thus be a proximate cause for TGF-mediated glomerular hyperfiltration. In this regard, SGLT2 inhibition as part of a diabetic treatment plan targets the pertinent pathophysiology (39). Consistent with experimental observations, the model predicts that under normoglycemic conditions and with SGLT2 inhibition by 95%, about 60% of filtered glucose will still be reabsorbed, so that profound glycosuria is not to be expected. Model calculations suggest that the diuresis of SGLT2 inhibition and glucose-driven osmotic diuresis will differ in NaCl delivery to the macula densa, so that SGLT2 inhibition is more likely to activate TGF. Finally, model calculations suggest that in the presence of SGLT2 inhibition, the individual will have enhanced susceptibility to osmotic diuresis with even modest degrees of hyperglycemia; the natriuresis in this setting may be severe.
GRANTS
This investigation was supported by Public Health Service Grant R01-DK-29857 from the National Institute of Arthritis, Diabetes, and Digestive, and Kidney Diseases.
DISCLOSURES
No conflicts of interest, financial or otherwise, are declared by the authors.
AUTHOR CONTRIBUTIONS
Author contributions: A.M.W. provided conception and design of research; A.M.W. performed experiments; A.M.W. analyzed data; A.M.W. interpreted results of experiments; A.M.W. prepared figures; A.M.W. drafted manuscript; A.M.W. edited and revised manuscript; A.M.W. approved final version of manuscript.
REFERENCES
- 1.Bank N, Aynedjian HS. Progressive increases in luminal glucose stimulate proximal sodium absorption in normal and diabetic rats. J Clin Invest 86: 309–316, 1990. [DOI] [PMC free article] [PubMed] [Google Scholar]
- 2.Battilana CA, Dobyan DC, Lacy FB, Bhattacharya J, Johnston PA, Jamison RL. Effect of chronic potassium loading on potassium secretion by the pars recta or descending limb of the juxtamedullary nephron in the rat. J Clin Invest 62: 1093–1103, 1978. [DOI] [PMC free article] [PubMed] [Google Scholar]
- 3.Bloom WL. Inhibition of salt excretion by carbohydrate. Arch Int Med 109: 26–32, 1962. [DOI] [PubMed] [Google Scholar]
- 4.Buerkert J, Martin D, Trigg D. Segmental analysis of the renal tubule in buffer production and net acid formation. Am J Physiol Renal Fluid Electrolyte Physiol 244: F442–F454, 1983. [DOI] [PubMed] [Google Scholar]
- 5.Burg M, Patlak C, Green N, Villey D. Organic solutes in fluid absorption by renal proximal convoluted tubules. Am J Physiol 231: 627–637, 1976. [DOI] [PubMed] [Google Scholar]
- 6.DeFronzo RA, Goldberg M, Agus ZS. The effects of glucose and insulin on renal electrolyte transport. J Clin Invest 58: 83–90, 1976. [DOI] [PMC free article] [PubMed] [Google Scholar]
- 7.DuBose TD, Caflisch CR. Effect of selective aldosterone deficiency on acidification in nephron segments of the rat inner medulla. J Clin Invest 82: 1624–1632, 1988. [DOI] [PMC free article] [PubMed] [Google Scholar]
- 8.DuBose TD, Lucci MS. Effect of carbonic anhydrase inhibition on superficial and deep nephron bicarbonate reabsorption in the rat. J Clin Invest 71: 55–65, 1983. [DOI] [PMC free article] [PubMed] [Google Scholar]
- 9.DuBose TD, Lucci MS, Hogg RJ, Pucacco LR, Kokko JP, Carter NW. Comparison of acidification parameters in superficial and deep nephrons of the rat. Am J Physiol Renal Fluid Electrolyte Physiol 244: F497–F503, 1983. [DOI] [PubMed] [Google Scholar]
- 10.Good DW, DuBose TD Jr. Ammonia transport by early and late proximal convoluted tubule of the rat. J Clin Invest 79: 684–691, 1987. [DOI] [PMC free article] [PubMed] [Google Scholar]
- 11.Horster M, Thurau K. Micropuncture studies on the filtration rate of single superficial and juxtamedullary glomeruli in the rat kidney. Pflügers Arch 301: 162–181, 1968. [DOI] [PubMed] [Google Scholar]
- 12.Jaeger P, Karlmark B, Giebisch G. Ammonium transport in rat cortical tubule: relationship to potassium metabolism. Am J Physiol Renal Fluid Electrolyte Physiol 245: F593–F600, 1983. [DOI] [PubMed] [Google Scholar]
- 13.Karlmark B, Jaeger P, Giebisch G. Luminal buffer transport in rat cortical tubule: relationship to potassium metabolism. Am J Physiol Renal Fluid Electrolyte Physiol 245: F584–F592, 1983. [DOI] [PubMed] [Google Scholar]
- 14.Knepper MA, Danielson RA, Saidel GM, Post RS. Quantitative analysis of renal medullary anatomy in rats and rabbits. Kid Int 12: 313–323, 1977. [DOI] [PubMed] [Google Scholar]
- 15.Layton AT. A mathematical model of the urine concentrating mechanism in the rat renal medulla. I. Formulation and base-case results. Am J Physiol Renal Physiol 300: F356–F371, 2011. [DOI] [PMC free article] [PubMed] [Google Scholar]
- 16.Layton AT. A mathematical model of the urine concentrating mechanism in the rat renal medulla. II. Funtional implications of three-dimensional architecture. Am J Physiol Renal Physiol 300: F372–F384, 2011. [DOI] [PMC free article] [PubMed] [Google Scholar]
- 17.Layton AT, Layton HE. A region-based mathematical model of the urine concentrating mechanism in the rat outer medulla. I. Formulation and base-case results. Am J Physiol Renal Physiol 289: F1346–F1366, 2005. [DOI] [PubMed] [Google Scholar]
- 18.Layton AT, Pannabecker TL, Dantzler WH, Layton HE. Functional implications of the three-dimensional architecture of the rat renal inner medulla. Am J Physiol Renal Physiol 298: F973–F987, 2010. [DOI] [PMC free article] [PubMed] [Google Scholar]
- 19.Lennon EJ, Lemann J Jr, Piering WF, Larson LS. The effect of glucose on urinary cation excretion during chronic extracellular volume expansion in normal man. J Clin Invest 53: 1424–1433, 1974. [DOI] [PMC free article] [PubMed] [Google Scholar]
- 20.Lindeman RD, Adler S, Yiengst MJ, Beard ES. Natriuresis and carbohydrate-induced antinatriuresis after overnight fast and hydration. Nephron 7: 289–300, 1970. [DOI] [PubMed] [Google Scholar]
- 21.Liu J, Lee T, DeFronzo RA. Why do SGLT2 inhibitors inhibit only 30–50% of renal glucose reabsorption in humans. Diabetes 61: 2199–2204, 2012. [DOI] [PMC free article] [PubMed] [Google Scholar]
- 22.Malnic G, Klose RM, Giebisch G. Micropuncture study of renal potassium excretion in the rat. Am J Physiol 206: 674–686, 1964. [DOI] [PubMed] [Google Scholar]
- 23.Moss R, Thomas SR. Hormonal regulation of salt and water excretion: a mathematical model of whole kidney function and pressure natriuresis. Am J Physiol Renal Physiol 306: F224–F248, 2014. [DOI] [PubMed] [Google Scholar]
- 24.Nizet A, Lefebvre P, Crabbé J. Control by insulin of sodium potassium and water excretion by the isolated dog kidney. Pflügers Arch 323: 11–20, 1971. [DOI] [PubMed] [Google Scholar]
- 25.Rieg T, Masuda T, Gerasimova M, Mayoux E, Platt K, Powell DR, Thomson SC, Koepsell H, Vallon V. Increase in SGLT1-mediated transport explains renal glucose reabsorption during genetic and pharmacological SGLT2 inhibition in euglycemia. Am J Physiol Renal Physiol 306: F188–F193, 2014. [DOI] [PMC free article] [PubMed] [Google Scholar]
- 26.Satlin LM, Sheng S, Woda CB, Kleyman TR. Epithelial Na+ channels are regulated by flow. Am J Physiol Renal Physiol 280: F1010–F1018, 2001. [DOI] [PubMed] [Google Scholar]
- 27.Stephenson JL, Zhang Y, Tewarson R. Electrolyte, urea, and water transport in a two-nephron central core model of the renal medulla. Am J Physiol Renal Fluid Electrolyte Physiol 257: F399–F413, 1989. [DOI] [PubMed] [Google Scholar]
- 28.Thomas SR. Cycles and separations in a model of the renal medulla. Am J Physiol Renal Physiol 275: F671–F690, 1998. [DOI] [PubMed] [Google Scholar]
- 29.Thomson SC, Rieg T, Miracle C, Mansoury H, Whaley J, Vallon V, Singh P. Acute and chronic effects of SGLT2 blockade on glomerular and tubular function in the early diabetic rat. Am J Physiol Regul Integr Comp Physiol 302: R75–R83, 2012. [DOI] [PMC free article] [PubMed] [Google Scholar]
- 30.Vallon V. The proximal tubule in the pathophysiology of the diabetic kidney. Am J Physiol Regul Integr Comp Physiol 300: R1009–R1022, 2011. [DOI] [PMC free article] [PubMed] [Google Scholar]
- 31.Vallon V, Huang D, Deng A, Richter K, Blantz RC, Thomson S. Salt sensitivity of proximal reabsorption alters macula densa salt and explains the paradoxical effect of dietary salt on glomerular filtration rate in diabetes mellitus. J Am Soc Nephrol 13: 1865–1871, 2002. [DOI] [PubMed] [Google Scholar]
- 32.Walls J, Buerkert JE, Purkerson ML, Klahr S. Nature of the acidifying defect after the relief of unilateral obstruction. Kidney Int 7: 304–316, 1975. [DOI] [PubMed] [Google Scholar]
- 33.Weinman EJ, Suki WN, Eknoyan G. d-Glucose enhancement of water reabsorption in proximal tubule of the rat kidney. Am J Physiol 231: 777–780, 1976. [DOI] [PubMed] [Google Scholar]
- 34.Weinstein AM. Osmotic diuresis in a mathematical model of the rat proximal tubule. Am J Physiol Renal Fluid Electrolyte Physiol 250: F874–F884, 1986. [DOI] [PubMed] [Google Scholar]
- 35.Weinstein AM. A mathematical model of rat cortical collecting duct: determinants of the transtubular potassium gradient. Am J Physiol Renal Physiol 280: F1072–F1092, 2001. [DOI] [PubMed] [Google Scholar]
- 36.Weinstein AM. A mathematical model of rat collecting duct. I. Flow effects on transport and urinary acidification. Am J Physiol Renal Physiol 283: F1237–F1251, 2002. [DOI] [PubMed] [Google Scholar]
- 37.Weinstein AM. A mathematical model of distal nephron acidification: diuretic effects. Am J Physiol Renal Physiol 295: F1353–F1364, 2008. [DOI] [PMC free article] [PubMed] [Google Scholar]
- 38.Weinstein AM. Potassium excretion during antinatriuresis: perspective from a distal nephron model. Am J Physiol Renal Physiol 302: F658–F673, 2012. [DOI] [PMC free article] [PubMed] [Google Scholar]
- 39.Weinstein AM. The diabetic proximal tubule: part of the problem, and part of the solution? Am J Physiol Renal Physiol 307: F147–F148, 2014. [DOI] [PMC free article] [PubMed] [Google Scholar]
- 40.Weinstein AM. A mathematical model of rat proximal tubule and loop of Henle. Am J Physiol Renal Physiol (First published February 18, 2015). doi: 10.1152/ajprenal.00504.2014. [DOI] [PMC free article] [PubMed] [Google Scholar]
- 41.Weinstein AM, Weinbaum S, Duan Y, Du Z, Yan Q, Wong T. Flow-dependent transport in a mathematical model of rat proximal tubule. Am J Physiol Renal Physiol 292: F1164–F1181, 2007. [DOI] [PubMed] [Google Scholar]
- 42.Wexler AS, Kalaba RE, Marsh DJ. Three-dimensional anatomy and renal concentrating mechanism. I. Modeling results. Am J Physiol Renal Fluid Electrolyte Physiol 260: F368–F383, 1991. [DOI] [PubMed] [Google Scholar]
- 43.Yamout H, Perkovic V, Davies M, Woo V, de Zeeuw D, Mayer C, Vijapurkar U, Kline I, Usiskin K, Meininger G, Bakris G. Efficacy and safety of canagliflozin in patients with type 2 diabetes and stage 3 nephropathy. Am J Nephrol 40: 64–74, 2014. [DOI] [PubMed] [Google Scholar]