

Abstract
A causal relationship between the pathophysiological changes in the gut epithelium and altered gut microbiota with the onset of obesity have been suggested but not defined. The aim of this study was to determine the temporal relationship between impaired intestinal barrier function and microbial dysbiosis in the small and large intestine in rodent high-fat (HF) diet-induced obesity. Rats were fed HF diet (45% fat) or normal chow (C, 10% fat) for 1, 3, or 6 wk; food intake, body weight, and adiposity were measured. Barrier function ex vivo using FITC-labeled dextran (4,000 Da, FD-4) and horseradish peroxidase (HRP) probes in Ussing chambers, gene expression, and gut microbial communities was assessed. After 1 wk, there was an immediate but reversible increase in paracellular permeability, decrease in IL-10 expression, and decrease in abundance of genera within the class Clostridia in the ileum. In the large intestine, HRP flux and abundance of genera within the order Bacteroidales increased with time on the HF diet and correlated with the onset of increased body weight and adiposity. The data show immediate insults in the ileum in response to ingestion of a HF diet, which were rapidly restored and preceded increased passage of large molecules across the large intestinal epithelium. This study provides an understanding of microbiota dysbiosis and gut pathophysiology in diet-induced obesity and has identified IL-10 and Oscillospira in the ileum and transcellular flux in the large intestine as potential early impairments in the gut that might lead to obesity and metabolic disorders.
Keywords: obesity, gut barrier, gut microbiota, intestinal permeability, HF diet
obesity and associated metabolic disorders are major health problems around the world with current reports showing that obesity rates have tripled since 1980 (16). In animal models, obesity is associated with numerous physiological changes in the body including decreased intestinal barrier function, gut inflammation, metabolic endotoxemia, and chronic low-grade systemic inflammation (39, 47); similar changes have been observed in human obesity (3, 33, 46, 47, 51).
The intestinal epithelium is the first site of diet, microbe, and host interaction (34). The gut epithelium secretes numerous compounds (e.g., mucus and defensins) ensuring a primary line of defense (36), and properties of gut epithelial cells act as a highly regulated physical barrier against the entry of bacteria and antigens (32). There is increased permeability of the intestinal epithelium during obesity in both humans and rodents (6, 12, 46), and it has been hypothesized that decreased barrier function leads to passage of microbial components, such as lipopolysaccharide (LPS), which drives systemic inflammation (5). However, the precise defects in gut barrier function and the possible role played in the development of obesity remain unclear. Measurement of intestinal permeability in vivo has been useful to show impaired intestinal permeability (12, 46), yet these approaches do not identify the site of the defect. The only study using an ex vivo intestinal permeability test to compare different sections of the gut was performed once obesity was established (43), not during development of the obese phenotype. Tight junction gene expression and protein localization (6) provide important but limited data on how passage of small molecules occurs between cells, the paracellular pathway, may be altered. In addition, other routes of transepithelial passage have been described (32, 40).
An early response to ingestion of high-fat, high-calorie (HF) diets in rodents is a decrease in the ability of intestinal satiety factors, such as cholecystokinin, to inhibit food intake (9, 35). There is evidence that this is due to desensitization of vagal afferent neurons to intestinal satiety factors and leads to hyperphagia and eventual increases in body weight. However, the pathway leading to these changes in the phenotype of vagal afferent neurons is not known, but given the anatomical localization of the terminals of vagal afferent neurons close to the intestinal epithelium, it is likely to depend on changes at the level of the gut. The contribution of altered paracellular vs. transcellular pathway, together with changes in the gut microbiota, in different intestinal regions to the altered vagal afferent nerve function and the obese phenotype is unknown but represents a barrier to our understanding of the role of the gut in the onset of the obese phenotype.
A potential role of the intestinal microbiota to influence body weight was provided by evidence that germ-free mice are resistant to the obesogenic effects of a HF diet (2). Transfer of the microbiota from either lean or obese mice to germ-free mice results in recapitulation of the donor phenotype (49), suggesting that body weight is influenced by the gut microbiota. Obese humans and obese animal models house an altered gut microbiota compared with lean individuals (24); changes at the phylum level are comparable between studies (25). The altered microbiota in obesity has been primarily defined in rodent obese-prone genetic models, or in rodent models of HF diet-induced obesity, once increased body weight gain, adiposity, and metabolic disorders are well established (47). However, there is evidence that the effect of diet on the gut microbiota can be rapid and dynamic (11). A thorough investigation of how gut barrier function and microbiota are altered within different regions of the intestine in response to ingestion of a HF diet will aid in determination of the mechanisms that impair gut-brain signaling in diet-induced obesity (20).
The overarching aim of this study was to determine the early changes in the gut microbiota and gut physiology that occur in response to ingestion of a HF diet. We determined the relationship between microbial dysbiosis and impairment of intestinal barrier function in the small and large intestine with the obese phenotype in diet-induced obesity in rats. The results show that a HF diet induces pathophysiological changes in gut epithelium and the microbiota, some of which occur early and are transient, and others that are sustained. This study provides the basis for further mechanistic and interventional studies to prevent or reverse the obese phenotype.
MATERIALS AND METHODS
Animals.
Animals were maintained and handled in accordance with protocols approved by the Institutional Animal Care and Use Committee (University of California, Davis). Male Wistar rats (9–10 wk old; 351.2 ± 2.2 g; n = 36; Harlan, San Diego, CA) were fed a HF diet (Research Diets D12451; 45% fat, 20% protein; 4.37 kcal/g) for a total of 1, 3, or 6 wk (n = 6 per group) after 3 wk of acclimation to the animal facility and were compared with age- and body weight-matched rats fed ab libitum chow (Purina Lab Diet 5001 rodent diet; 13% fat, 23% protein; 3.36 kcal/g). All animals were housed individually at 22°C with a 12:12-h light-dark cycle. Body weight and food intake were measured weekly. Rats were euthanized after an overnight fast of 12 h (ab libitum water) and a 2-h refeed, using deep anesthesia induced with isoflurane and cardiac puncture.
Plasma and tissue collection.
Blood was collected via cardiac puncture in heparinized tubes. Plasma was obtained after centrifugation (4°C; 10,000 rpm, 10 min) and frozen at −20°C. Cecum weight and colon length were recorded. Luminal contents were removed from the ileum and cecum and flash frozen in liquid nitrogen. Segments of jejunum, ileum, cecum, and proximal colon were collected and stored in low glucose DMEM for Ussing chambers. Sections of the ileum and cecum were fixed in 4% paraformaldehyde for 2 h and kept in 25% sucrose PBS at 4°C. Other sections were flash frozen in liquid nitrogen and stored at −80°C until RNA extraction. Fat pad (mesenteric, epididymal, and retroperitoneal) weight was measured, and adiposity was calculated as the sum of fat pads/body weight × 100.
Barrier function assessment.
Gut tissue was opened along the mesenteric border and mounted in Ussing chambers (Physiologic Instruments, San Diego, CA), exposing 0.5 cm2 of tissue surface area to 2.5 ml of oxygenated Krebs-glucose (10 mM) and Krebs-mannitol (10 mM) at 37°C on the serosal and luminal sides, respectively. The paracellular pathway and transcellular pathway were measured as the flux of FITC-4000 (FD-4; Sigma-Aldrich) and horseradish peroxidase (HRP Type II; Sigma Aldrich), respectively. FD-4 (400 μg/ml) and HRP (200 μg/ml) were added to the mucosal chamber, and samples were collected from the serosal chamber every 15 min for 2 h. Concentration of FD-4 was measured via fluorescence at excitation 485 nm and emission 538 nm. O-dianisidine substrate was used to detect HRP at absorbance 450 nm.
Plasma lipopolysaccharide-binding protein.
Lipopolysaccharide-binding protein (LBP) levels were detected in plasma samples via ELISA kit according to manufacturer's recommendation (Biometec, Greifswald, Germany).
Histology.
Cryostat sections of fixed ileum and cecum (5 μm) were stained with hematoxylin and eosin or periodic acid-Schiff-alcian blue (53) and examined under a light microscope (Nikon ECLIPSE E400; Nikon Instruments) equipped with image analysis software (NIS-Elements AR3.0 software; Nikon Instruments). Villi length and crypt depth were measured in 15–20 well-oriented crypt-villus units in the ileum and cecum. Goblet cells were counted in 10–15 well-oriented cecal crypts.
Fat analysis.
Quantity of fat within the contents of the cecal lumen was determined by the Folch method using chloroform and methanol (2:1 m vol/vol) (17).
RNA extraction and quantitative RT-PCR.
Total RNA from ileal and cecal samples was extracted via the TRIzol method (15596018; Life Technologies). Quality of RNA was assessed via Agilent 2100 Bioanalyzer. Total RNA (2 ug) was used for reverse transcription producing cDNA, performed according to manufacturer protocol (High Capacity Complementary DNA Reverse Transcription Kit; Applied Biosystems). Primer sequences can be found in Table 1. Real-time PCR was performed with the StepOnePlus real-time PCR machine using SyberGreen master mix (Life Technologies) for detection. RPS18 and HPRT1 were used as housekeeping genes; genes of interest were analyzed according to the 2−ΔCT method, comparing to week 1 control samples.
Table 1.
Primers used for quantitative RT-PCR
| Gene | Forward (5′-3′) | Reverse (5′-3′) |
|---|---|---|
| CAV1 | CGCACACCAAGGAGATTGA | CCATAGGGATGCCGAAGATG |
| CCR2 | GTTCTCTTCCTGACCACCTTC | GGGCATTGTTTGCAGAGATTT |
| HPRT1 | TAGGTCCATTCCTATGACTGTAGA | TGGCCTGTATCCAACACTTC |
| IL-1β | ATCTATACCTGTCCTGTGTGATG | GACAGGTCTGTGCTCTGC |
| IL-10 | CGACGCTGTCATCGATTTCT | AGCTCTATTTATGTCCTGCAGTC |
| MCP1 | GTCTCAGCCAGATGCAGTTAAT | GCTGAAGTCCTTAGGGTTGATG |
| Muc2 | GGAACTTCAGAAAGAAGCCAGAT | CGGACTCTATGCTGGAGTGA |
| RPS18 | CGAGAAGTTTCAGCACATCCT | GAACCAGTCAGGGATCTTGTATT |
| TNF-α | ACCTTATCTACTCCCAGGTTCTC | CGGACTCCGTGATGTCTAAGTA |
| ZO1 | GCAATTCCGTATCGTTGGATTT | CGGTTGTATGCTGGAGTGAT |
Real-time PCR primers were designed using Integrated DNA Technologies Primer Quest and Oligo Analyzer tools.
Microbiota DNA extraction and sequencing.
DNA was extracted from ileal and cecum luminal contents using the Zymo Research fecal DNA mini prep kit according to the manufacturer's protocol (cat. no. D6010; Zymo Research, Irvine, CA). Quantification of DNA was performed on a Quibit Fluorometer (Life Technologies). Amplification was performed on the V4 region of the 16S rRNA genes via PCR as recommended by the Earth Microbiome Project (19). Briefly, an Illumina Nextera adapter, barcode, primer pad, and primer linker were added to each primer: F515 (5′-GTGCCAGCMGCCGCGGTAA-3′) and R806 (5′-GGACTACHVGGGTWTCTAAT-3′) (8). High throughput sequencing was performed with Illumina MiSEQ paired end 250 basepair runs at the University of California Davis Genomic Sequencing Center.
Microbioal bioinformatic analysis.
Quantitative Insights Into Microbial Ecology (QIIME, version 1.7) (7) software was used for demultiplexing and quality filtering. Operational taxonomic unit (OTU) picking was performed using an open reference workflow script with Greengenes 97 (version 13_5) for taxonomy assignment at 97% similarity (31). Principle Coordinate analysis taxa summaries using unweighted UniFrac and alpha rarefaction plots were created through QIIME. Multivariable statistical analysis was performed in the LEfSe package (42) with default parameters. First, cladograms were created comparing how diet significantly changed genera abundance independent of time in the ileum and cecum. Second, individual genera abundance were plotted into four groups: Chow, HF Wk1, HF Wk3, and HF Wk6.
Statistical analysis.
Statistical analysis was performed on GraphPad Prism software (v5; San Diego, CA), and data are expressed as means ± SE. Data were analyzed using two-way ANOVA testing diet, time, and diet × time factors, with Bonferroni post hoc tests. P < 0.05 was considered significant. Principal component analysis (PCA) of parameters significantly changed due to HF diet and microbiota abundances was performed on R software via FactoMineR. For this later analysis, bacterial genus that had an average abundance of <0.4% in the highest detectable group was discarded. Description of categories analysis established the most significant factors for each cluster (23). Only data with statistical values |v.test| >2.6 are presented in the tables. One rat fed a control diet was excluded from the PCA analysis because of a significantly different microbiota than all other rats. Finally, linear correlations between selected parameters were measured via Pearson's R coefficient on GraphPad Prism.
RESULTS
Ingestion of a HF diet results in obese phenotype.
Body weight was higher in HF compared with chow-fed rats after 1 wk and remained significantly higher at 3 and 6 wk of HF feeding (Fig. 1A). Rats fed a HF diet ate significantly more kilocalories per day at weeks 1 and 2 but ate comparable amounts of energy at weeks 3 to 6 compared with chow-fed rats (Fig. 1B). Adiposity index increased progressively over time in HF-fed rats, reaching 54% greater adiposity compared with chow-fed controls at week 6 (Fig. 1C). Ingestion of a HF diet resulted in increased plasma levels of LBP at weeks 3 and 6 compared with chow-fed controls (Fig. 1D).
Fig. 1.

Effect of a high-fat (HF) diet on body weight (A), food intake (B), adiposity (C), and lipopolysaccharide binding protein (LBP; D). Adiposity index [(mesenteric + epididymal + retroperitoneal fat/body weight) × 100]. C, chow. Values are means ± SE. Two-way ANOVA (P values displayed for diet, time, and interaction), followed by Bonferroni's post hoc test, *P < 0.05 or ***P < 0.001, significant difference; n = 18/group (A and B) n = 6/group (C and D).
Effect of HF diet on the intestine.
Intestinal barrier function in the small (jejunum and ileum) and large intestine (cecum and proximal colon) was evaluated ex vivo at each time point (Fig. 2). HF diet significantly increased paracellular permeability in both the small and large intestine (Fig. 2, A and C). In the ileum, the increase in paracellular permeability was significant after week 1 of the HF diet but returned to control values at weeks 3 and 6 (Fig. 2A).
Fig. 2.

Effect of a HF diet on gut barrier function in the small (A and B) and large (C and D) intestine. FITC-dextran 4000 (FD4) flux (=paracellular pathway) (A and C) and horseradish peroxidase (HRP) flux (=transcellular pathway) (B and D) was measured ex vivo in Ussing chambers. Values are means ± SE. Two-way ANOVA (P values displayed for diet, time, and interaction), followed by Bonferroni's post hoc test, *P < 0.05, significant difference; n = 5–6/group.
There was no significant difference in the transcellular flux in the small intestine between HF and chow-fed rats at any time point (Fig. 2B). In contrast, in the large intestine (cecum and colon), there was a progressive and sustained increase in transcellular flux in HF compared with chow-fed rats. Transcellular flux was significantly increased at week 3 and 6 in rats ingesting the HF diet compared with chow-fed controls (Fig. 2D).
Gross measurements of colon length and histological measurement of ileal and cecal morphology revealed significant effects of HF diet on the intestine (Table 2). Colon length, cecal weight, cecal and ileal crypt depth, and the number of goblet cells per cecal crypt were decreased after week 1 and remained low in rats fed a HF diet compared with chow-fed controls (Table 2). Villi length in the ileum was not affected by a HF diet. Cecal fat content was increased at week 1 and remained elevated at weeks 3 and 6 (Table 2).
Table 2.
Intestinal morphology
|
Week 1 |
Week 3 |
Week 6 |
|||||
|---|---|---|---|---|---|---|---|
| C | HF | C | HF | C | HF | Two-Way ANOVA | |
| Cecum weight, g | 6.0 ± 0.2 | 1.8 ± 0.2* | 6.0 ± 0.4 | 2.2 ± 0.1* | 6.1 ± 0.2 | 2.0 ± 0.1* | Diet P < 0.0001 |
| Colon length, cm | 14.1 ± 0.3 | 12.9 ± 0.5 | 16.1 ± 1.0 | 13.1 ± 0.4* | 15.2 ± 0.6 | 12.6 ± 0.5* | Diet P < 0.0001 |
| Ileum villi length, μm | 302.1 ± 15.1 | 297.1 ± 6.0 | 269.3 ± 13.4 | 295.0 ± 13.1 | 266.8 ± 22.5 | 234.2 ± 26.3 | Time P = 0.03 |
| Ileum crypt depth, μm | 163.0 ± 10.3 | 152.3 ± 8.0 | 172.1 ± 10.9 | 133.5 ± 2.0 | 164.5 ± 4.6 | 146.5 ± 12.4 | Diet P = 0.009 |
| Cecum crypt depth, μm | 169.9 ± 7.5 | 160.0 ± 3.9 | 168.4 ± 12.0 | 142.0 ± 5.3 | 154.2 ± 4.2 | 132.3 ± 6.3 | Diet P = 0.002 |
| Time P = 0.02 | |||||||
| Cecum goblet cell/crypt | 21.6 ± 1 | 17.8 ± 0.5* | 18.1 ± 2 | 19.6 ± 1 | 20 ± 0.4 | 18 ± 0.7 | Interaction P = 0.03 |
| Fat in content of cecum, % | 1.26 ± 0.1 | 2.06 ± 0.2 | 0.96 ± 0.1 | 2.19 ± 0.1* | 1.07 ± 0.2 | 2.22 ± 0.4* | Diet P < 0.0001 |
High-fat (HF) diet significantly different compared with chow (C) diet at specific time point by Bonferroni post hoc test.
Differential gene expression analysis showed that there were more changes in the ileum than cecum in response to ingestion of a HF diet. HF diet significantly lowered anti-inflammatory cytokine IL-10 expression in the ileum at week 1 (Table 3). Proinflammatory cytokine expression (IL-1β) in the ileum was increased in HF-fed rats and was significantly higher in week 6 compared with week 1 (P < 0.05). ZO1 (tight junction protein) expression was increased at week 3 in the ileum, and caveolin-1 (endocytosis protein) expression was increased in both the ileum and cecum at all time points. Muc2, MCP1, TNF-α, and CCR2 expression was not significantly different due to HF diet (Table 3).
Table 3.
Gene expression analysis in the ileum and cecum
| Ileum |
Cecum |
|||||||||||||
|---|---|---|---|---|---|---|---|---|---|---|---|---|---|---|
|
Week 1 |
Week 3 |
Week 6 |
Week 1 |
Week 3 |
Week 6 |
|||||||||
| Gene | C | HF | C | HF | C | HF | Two-Way ANOVA Ileum | C | HF | C | HF | C | HF | Two-Way ANOVA Cecum |
| CAV1 | 1 ± 0.13 | 1.75 ± 0.29 | 2.05 ± 0.73 | 3.16 ± 0.92 | 1.08 ± 0.11 | 1.7 ± 0.35 | Diet P = 0.03 Time P = 0.008 | 1 ± 0.18 | 1.42 ± 0.29 | 0.88 ± 0.1 | 1.38 ± 0.20 | 0.67 ± 0.07 | 0.84 ± 0.09 | Diet P = 0.008 Time P = 0.01 |
| CCR2 | 1 ± 0.1 | 1.65 ± 0.16 | 0.87 ± 0.42 | 1.43 ± 0.22 | 1.53 ± 0.17 | 1.45 ± 0.31 | 1 ± 0.14 | 1.61 ± 0.16 | 1.59 ± 0.25 | 0.82 ± 0.12 | 0.9 ± 0.09 | 0.76 ± 0.15 | Time P = 0.019 Interaction P < 0.001 | |
| IL-1β | 1 ± 0.09 | 1.1 ± 0.21 | 1.08 ± 0.11 | 1.56 ± 0.25 | 1.71 ± 0.15 | 2.28 ± 0.31 | Diet P = 0.01 Time P < 0.001 | 1 ± 0.09 | 1.37 ± 0.3 | 1.66 ± 0.43 | 0.95 ± 0.07 | 1.15 ± 0.13 | 1.58 ± 0.23 | |
| IL-10 | 1 ± 0.28 | 0.23 ± 0.04* | 0.74 ± 0.28 | 0.48 ± 0.2 | 0.85 ± 0.19 | 0.42 ± 0.2 | Diet P = 0.006 | 1 ± 0.31 | 1.79 ± 0.37 | 1.21 ± 0.24 | 1.06 ± 0.11 | 0.83 ± 0.13 | 1.39 ± 0.16 | |
| MCP1 | 1 ± 0.08 | 0.93 ± 0.12 | 2.14 ± 0.37 | 2.94 ± 0.25 | 1.88 ± 0.29 | 2.05 ± 0.31 | Time P < 0.001 | 1 ± 0.18 | 1.27 ± 0.19 | 1.04 ± 0.29 | 1.47 ± 0.23 | 1.75 ± 0.28 | 1.33 ± 0.16 | |
| Muc2 | 1 ± 0.09 | 0.86 ± 0.18 | 1.4 ± 0.22 | 0.73 ± 0.16 | 1.71 ± 0.26 | 1.28 ± 0.34 | Time P = 0.02 | 1 ± 0.35 | 0.55 ± 0.07 | 0.9 ± 0.21 | 0.76 ± 0.29 | 0.76 ± 0.18 | 1.06 ± 0.0.2 | |
| TNF-α | 1 ± 0.24 | 0.73 ± 0.17 | 1.25 ± 0.32 | 2.03 ± 0.44 | 1.23 ± 0.22 | 1.82 ± 0.91 | 1 ± 0.22 | 1.71 ± 0.29 | 1.26 ± 0.27 | 1.39 ± 0.14 | 1.18 ± 0.15 | 1.17 ± 0.2 | ||
| ZO1 | 1 ± 0.07 | 1.44 ± 0.11 | 1.52 ± 0.17 | 2.62 ± 0.28* | 1.46 ± 0.15 | 2 ± 0.38 | Diet P < 0.001 Time P = 0.001 | 1 ± 0.04 | 0.95 ± 0.11 | 0.65 ± 0.86 | 0.74 ± 0.06 | 0.72 ± 0.05 | 0.74 ± 0.07 | Time = 0.0013 |
HF significantly different compared with C at specific time point by Bonferroni post hoc test.
Regional differences in the gut microbiota.
An initial analysis was performed to determine the difference in microbiota based on region. Unweighted UniFrac analysis showed distinct communities in the ileum compared with the cecum (Fig. 3A). Alpha rarefaction analysis showed that the cecum contained a more diverse microbiota than the ileum (data not shown). There were differences in the abundance of phyla between cecum and ileum; of the two most abundant phyla in the cecum, Bacteroidetes and Firmicutes, the cecum had significantly higher abundance of Bacteroidetes than the ileum, while the ileum had significantly more Firmicutes (Fig. 3B). Of the less abundant phyla, the cecum contained significantly more Tenericutes than the ileum, while the ileum contained significantly more Actinobacteria, Proteobacteria, Cyanobacteria, and Thermi than the cecum (Fig. 3B).
Fig. 3.

Gut microbiota changes due to location and diet. A: principal component analysis (PCA) plot showing microbiota communities cluster with location and diet, determined by unweighted UniFrac analysis. B: average relative abundance at phylum level in ileum and colon of rats ingesting either chow or a HF diet. C: significant changes in relative genus abundance in cecum and ileum (>0.4%), labeled [phylum, (genera)] unless otherwise noted. Circle color indicates change in abundance: yellow, no change; red, elevated in chow; and green, elevated in HF. Linear discriminant analysis (LDA) effect size analysis (LEfSe) score >3 was considered significant.
Effect of HF diet on gut microbiota.
A second analysis was performed to determine the difference in microbiota based on region and diet, independently of the duration of time on a HF diet. Communities clustered within the PCA plot dependent on diet; chow-fed rats had a more diverse microbiota than HF-fed rats (Fig. 3A). At the kingdom and phylum level, the changes in bacterial abundance due to diet were similar in the cecum and ileum. Kingdom Archea was decreased and the ratio of Firmicutes to Bacteroidetes was increased in both regions in HF compared with chow-fed rats (Fig. 3C, data not shown). However, there were two significant differences at the phylum level between regions due to diet; Deferribacteres significantly increased in the cecum but not the ileum of HF-fed rats and Cyanobacteria (from chloroplasts in ingested plant material) was significantly greater in the ileum, but not the cecum, of chow-fed rats (Fig. 3C).
At the genus level significant changes in abundance were seen in rats fed a HF diet. Thirteen percent of all bacterial genera detected in the ileum was significantly changed in abundance by diet; the majority (57%) of differences were within the phylum Firmicutes. For example, the most abundant genus in chow-fed rats was an unclassified genus of the Clostridiaceae family (30%), while the most abundant genus in HF-fed rats was Lactococcus (32%) (Fig. 3C). The only other genus that was significantly greater in abundance due to a HF diet in the ileum was Corynebacterium (Fig. 3C).
Changes in abundance at the genus level in response to HF diet were significantly larger in the cecum than the ileum (22% of the total genera detected); the majority (47%) of changes were within the Bacteroidetes phylum. Specifically, the most abundant genus in chow-fed animals was Prevotella (22.5%), while the most abundant genus in HF-fed rats was Bacteroides (15%). There was also an increase abundance of genus within the phylum Proteobacteria (unclassified RF32 and family Desulfovibrionaceae) and within the Clostridiales order (family Clostrideacea and RC4_4) in HF compared with chow-fed rats (Fig. 3C).
Effect of HF diet on bacterial genera in relation with time.
A third analysis was performed taking into account the duration of time on a HF diet. Microbiota from rats on the chow diet showed no significant changes with time (data not shown); therefore, these data were combined and compared with the microbiota of rats fed HF diet for 1, 3, and 6 wk.
The changes in abundance with time can be described in three different patterns (Fig. 4 and Table 4): 1) reduced or increased at week 1 on HF diet and remaining at these levels at weeks 3 and 6 (e.g., Prevotella and Bacteroides; Fig. 4, A and B); 2) abundance increased or decreased after 1 wk on HF diet but restored to that of chow-fed rats at weeks 3 and 6 (e.g., an unclassified genus in the family Lachnospiraceae and Oscillospira of the order Clostridiales; Fig. 4, C and D); and 3) abundance increased (e.g., an unclassified genus in the order Bacteroidales,) or decreased (e.g., Blautia) progressively with time on HF diet (Fig. 4, E and F).
Fig. 4.

Microbiota shifts at the genus level in the cecum due to HF diet and time can be characterized in 3 types of response: immediate and sustained change in abundance, e.g., Prevotella [LDA = 5] (A) and Bacteroides [LDA = 4.8] (B); immediate change in abundance at week 1 followed by restoration to chow levels at weeks 3 and 6, e.g., unclassified genus in Lachnospiraceae family [LDA=4.5] (C) and Oscillospira [LDA = 3.9] (D); and immediate change in abundance at week 1 restored to chow levels by week 6, e.g., unclassified genus in Bacteroidales order [LDA = 4.6] (E) and Blautia [LDA = 4.2] (F). Abundance of bacterial genera across time in chow-fed animals did not differ significantly; therefore, time points were combined. LEfSe LDA score >3 was considered significant.
Table 4.
Significant changes in genus abundance due to length of time on a HF diet
| Abundance % |
|||||
|---|---|---|---|---|---|
| LDA | Chow | HF Wk1 | HF Wk3 | HF Wk6 | |
| Ileum | |||||
| Chow high, down at week 1 HF | |||||
| Clostridiaceae, other | 4 | 30 | 9 | 23 | 9 |
| Prevotella | 3.9 | 1.5 | 0.001 | 0.01 | 0.02 |
| Mitochondria, other | 4 | 1.75 | 0.6 | 0.2 | 0.1 |
| Blautia | 3.9 | 0.6 | 0.15 | 0.25 | 0.2 |
| Chow low, high at week 1 HF | |||||
| Lactococcus | 5.2 | 4 | 38 | 20 | 39 |
| Corynebacterium | 4.1 | 0.5 | 19 | 29 | 9 |
| Chow low, increases over time with HF | |||||
| Bacteroidales, other | 2 | 0 | 0 | 0.25 | 0.75 |
| Akkermansia | 3.5 | 0.01 | 0.01 | 0.6 | 0.2 |
| Butyricimonas | 4.2 | 0.01 | 0 | 0.03 | 0.08 |
| Rikenellaceae, other | 4.1 | 0.01 | 0.01 | 0.075 | 0.125 |
| High in chow, decreases over time | |||||
| Pasteurellaceae (family) | 3 | 1 | 0.6 | 0.01 | 0.01 |
| Change at week 1 HF, is restored | |||||
| Lachnospiraceae, other | 3.8 | 1 | 0.1 | 0.4 | 0.8 |
| Ruminococcus | 4.2 | 0.9 | 0.1 | 1.25 | 0.6 |
| S24_7, other | 3.7 | 0.55 | 0.1 | 0.3 | 0.39 |
| Oscillospira | 3.9 | 0.45 | 0.05 | 0.2 | 0.3 |
| Facklamia | 3.9 | 0.19 | 0.05 | 0.06 | 0.25 |
| Cecum | |||||
| Chow high, down at week 1 HF | |||||
| Prevotella* | 5 | 22.5 | 0 | 0 | 0 |
| Methanosphaera | 4.5 | 5.5 | 0 | 0 | 0 |
| Chow low, high at week 1 HF | |||||
| Bacteroides* | 4.8 | 5 | 15 | 13 | 16 |
| Clostridiaceae, other | 4.5 | 0.5 | 6 | 10.5 | 8 |
| Rikenellaceae, other | 3.8 | 0.25 | 1.75 | 1.6 | 1.55 |
| Mucispirillum | 3.7 | 0.1 | 1.25 | 1.1 | 1.3 |
| Desulfovibrionaceae (family) | 3.3 | 0.5 | 0.9 | 0.7 | 1.2 |
| Lactococcus | 3.6 | 0.05 | 0.35 | 0.45 | 0.25 |
| Odoribacter | 3.5 | 0 | 0.35 | 0.35 | 0.35 |
| Chow low, increases over time with HF | |||||
| Bacteroidales, other* | 4 | 0 | 1 | 1.5 | 5.5 |
| Akkermansia | 4.3 | 0.5 | 1 | 3.5 | 5 |
| Oscillospira | 4.2 | 3.5 | 2 | 3 | 4.5 |
| Streptophyta, other | 3.6 | 0.7 | 0.25 | 0.94 | 1.14 |
| Clostridium | 3.5 | 0.017 | 0.3 | 0.4 | 0.56 |
| Butyricimonas | 3.4 | 0.13 | 0.43 | 0.44 | 0.922 |
| Staphylococcus | 3.2 | 0.2 | 0.117 | 0.06 | 0.32 |
| Micrococcaeceae, other | 3.6 | 0.005 | 0.125 | 0.18 | 0.2 |
| Citrobacter | 3.7 | 0 | 0 | 0 | 0.06 |
| Lachnospiraceae, other | 3.1 | 5.85 | 3.75 | 7.02 | 10.12 |
| High in chow, decreases over time | |||||
| Blautia* | 4.2 | 5.5 | 5.5 | 1 | 1 |
| Peptococcus | 4 | 1.5 | 2.25 | 0.5 | 0.75 |
| Clostridiales, other | 3.5 | 1 | 1.25 | 0.6 | 0.6 |
| Coriobacteriaceae (family) | 3.6 | 0.2 | 0.125 | 0.08 | 0.06 |
| Change at week 1 HF, is restored | |||||
| Lachnospiraceae, other* | 4.5 | 7 | 12.5 | 5 | 6 |
| [Ruminococcus] | 4.2 | 1 | 4 | 0.8 | 1 |
| Paraprevotellaceae, other | 4.1 | 0.8 | 3.5 | 2.25 | 1.5 |
| Clostridia, other | 3.4 | 0.25 | 1.1 | 0.25 | 0.25 |
| [Coprobacillaceae], other | 3.5 | 0.15 | 0.8 | 0.1 | 0.2 |
| rc4-4 | 3.5 | 0.25 | 0.75 | 0.35 | 0.5 |
| Allobaculum | 3.4 | 0 | 0.1 | 0.4 | 0.1 |
| Dehalobacteriaceae | 3.5 | 0.32 | 0.06 | 0.06 | 0.2 |
LDA, linear discriminant analysis.
Representative genus in Fig. 4.
Multivariate analysis of response to HF diet.
Multivariate analysis was used to provide a statistical link between the phenotype and microbiota data: obese phenotype, gut barrier function, cytokine gene expression, and bacterial abundance. The data showed that each rat was more similar to rats in the same diet group than other diet groups, clustering together in a PCA plot (Fig. 5). Chow-fed rats clustered due to parameters that exhibited rapid and sustained changes in HF-fed animals, regardless of time on HF diet, cecum weight, Methanosphaera, and Prevotella (Tables 5 and 6). Rats fed a HF diet for 1 wk clustered due to increased paracellular flux in the ileum and bacteria abundance shifts in the Clostridia class. Rats fed a HF diet for 3 and 6 wk clustered together in the PCA analysis yet still show distinct populations on the graph (Fig. 5C). Specifically, rats fed the HF diet for 3 or 6 wk were described by obesity measures (increased adiposity, body weight, LPS binding protein, and IL-1β), increased transcellular flux in the large intestine (cecum and colon), and bacteria abundances that change progressively over time, for example, Blautia (Tables 5 and 6).
Fig. 5.
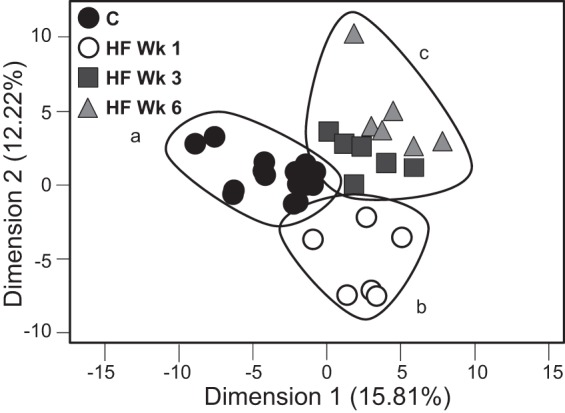
PCA chow-fed animals (A), rats fed HF diet for 1 wk (B), and rats fed HF diet 3 or 6 wk (C) clustered, yet still show distinct populations. Only bacteria genera with an average abundance >0.4% was taken into account.
Table 5.
Discription of clusters: phenotypic response
| Parameter | Gut Section | |
|---|---|---|
| HF diet, all time points compared with chow, leads to | ||
| Lower | IL10 | Ileum |
| Lower | Weight | Cecum |
| Lower | Length | Colon |
| Higher | Food intake week 1 | |
| HF for 1 wk, compared with 3 wk, 6 wk, or chow, leads to | ||
| Higher | FD4 | Ileum |
| HF for 3 or 6 wk, compared with 1 wk or chow, leads to | ||
| Lower | Crypt depth | Ileum and decum |
| Higher | HRP | Colon |
| Higher | IL-1b | Ileum |
| Higher | ZO1 | Ileum |
| HF for 3 or 6 wk, compared with chow, leads to | ||
| Higher | Adiposity index | |
| Higher | HRP | Cecum |
| Higher | LBP, ng/ml | |
| Higher | Fat content |
HRP, horseradish peroxidase; LBP, lipopolysaccharide-binding protein.
Table 6.
Discription of clusters: microbiota response
| Class | Order | Genus | Gut Section | |
|---|---|---|---|---|
| HF diet, all time points compared with chow, leads to | ||||
| Lower | Methanobacteria | Methanobacteriales | Methanosphaera | Ileum and cecum |
| Lower | Bacteroidetes | Bacteroidales | Prevotella | Ielum and cecum |
| Higher | Deferribacteres | Deferribacterales | Mucispirillum | Cecum |
| Higher | Bacteroidetes | Bacteroidales | Butyricimonas | Cecum |
| HF for 1 wk, compared with 3 wk, 6 wk, or chow, leads to | ||||
| Lower | Clostridia | Clostridiales | Oscillospira | Ileum |
| Higher | Clostridia | Clostridiales | Lachnospiraceae, other | Cecum |
| Higher | Clostridia | Erysipelotrichales | [Coprobacillaceae] | Cecum |
| Higher | Clostridia | Clostridiales | [Ruminococcus] | Cecum |
| Higher | Clostridia | Other | Other | Cecum |
| Higher | Clostridia | Clostridiales | rc4-4 | Cecum |
| HF for 3 or 6 wk, compared with 1 wk or chow, leads to | ||||
| Lower | Clostridia | Clostridiales | Peptococcus | Cecum |
| Lower | Clostridia | Clostridiales | Blautia | Cecum |
| Higher | Bacteroidetes | Bacteroidales | other | Cecum |
We determined the correlation between all the parameters and microbiota. Oscillospira (within the Clostridia class) in the ileum significantly correlated with small intestine paracellular permeability (R = 0.56, P = 0.0059). IL-1β expression in the ileum was significantly correlated with adiposity and body weight (R = 0.65, P < 0.0001; R = 0.71, P < 0.0001 respectively) but not ileal barrier function. Butyricimonas and an unclassified genus in the cecum (both within the Bacteroidales order) were significantly correlated to the cecal transcellular flux (R = 0.48, P = 0.043; R = 0.56, P = 0.015, respectively). Further analysis showed that the large intestine transcellular pathway, but not the paracellular pathway, was highly correlated with adiposity, body weight, and LPS binding protein (R = 0.66, P < 0.0001; R = 0.56, P = 0.0007; R = 0.44, P = 0.011, respectively).
DISCUSSION
There is considerable evidence to support a role for an interaction between the gut epithelium and the microbiota in obesity; however, the precise nature of this interaction and how these changes may drive hyperphagia are not understood. In the current study, we sought to gain insight by describing the early onset, time-dependent, and region-specific changes in the gut microbiota and correlating these with alterations in gut epithelial function and the obese phenotype in rodent HF diet-induced obesity. The data show that within the first week of ingestion of a HF diet, there was a significant increase in paracellular permeability in the small intestine, which was accompanied by a decrease in expression of IL-10; genera in the class Clostridia significantly correlated with these early onset changes. In contrast, transcellular flux increased in the large intestine and at time points later than week 1. These changes correlated significantly with genera in the order Bacteriodales and coincided with increased adiposity, body weight, and plasma levels of LBP, together with increased expression of IL-1β in the ileum. The data show that changes in the intestinal epithelium and gut microbiota are dynamic and dependent on intestinal region and duration of ingestion of HF diet. Taken together, the data show specific changes in microbial ecology occur in different regions of the gut in response to a HF diet and that these changes are associated with altered gut physiological and metabolic changes in the host.
Changes in gut barrier function in obesity are of considerable interest to gain insight into how HF diets may alter the gut innervation and change feeding behavior. Here we show that a HF diet differentially influences barrier function of the small and large intestine. The increase in paracellular permeability in both the small and large intestine is consistent with other studies (6, 36), but our data are the first to show how early this occurs and, moreover, that in the small intestine, it returns to control levels after 3 wk of HF diet. We show tight junction protein ZO1 gene expression is significantly higher after 3 wk on a HF diet in the ileum, which may be a part of a compensatory mechanism to restore paracellular permeability. The only significant change in bacterial abundance in the ileum to significantly correlate with paracellular permeability was a decrease in genus Oscillospira, within the order Clostridiales. The abundance of this genus negatively correlates with BMI in humans (48) and decreases in abundance in sheep after a switch from forage to grain-containing diets (27). It is possible that the lower amounts of fiber in the HF diet compared with chow, rather than the increase in fat content, could cause a decrease in Oscillospira. We used a chow control rather than a low-fat, semipurified diet to more accurately mimic the differences in a normal diet and a HF, low-fiber diet that reflects that associated with human obesity. The abundance of many other genera within the Clostridia class changed significantly in the cecum after 1 wk of a HF diet; how these changes influence intestinal barrier function is unclear and warrants further investigation.
The transcellular pathway allows larger molecules to cross the epithelium through endocytosis (22). Many microbial components, including LPS, are larger than the pore size of tight junctions (4 Å) (50), thus leading to the hypothesis that the transcellular pathway is involved in metabolic endotoxemia and systemic inflammation seen in obesity. However, there is only one report looking at changes in transcellular flux in obesity, showing an increase in the small intestine in ob/ob mice; the large intestine was not studied (4). In the present study, we found that plasma levels of LBP, which binds LPS and other bacterial pathogen-associated molecular patterns (PAMPs) (13), significantly correlated with transcellular flux in the large intestine. Studies have shown that fat differentially increases LPS translocation via chylomicrons (18, 30). The lipid raft protein caveolin-1 has been shown to be involved in fat absorption (45); here we show that cav-1 gene expression and the amount of fat in the cecum are increased after 1 wk and remain elevated. However, transcellular flux in the large intestine was not increased at week 1; thus it is unlikely that the amount of fat explains the increase in the transcellular pathway. Further investigation is needed to show how a HF diet and the gut microbiota may influence transcellular flux and increased passage of LPS across the intestine.
Several groups have characterized the microbiota of obese individuals and changes in gut microbiota of HF-fed rodents; however, we are the first to utilize next-generation sequencing to assess the microbiota in different regions of the gut over time in a model of HF diet-induced obesity. Using the algorithm created by the Huttenhower laboratory to determine significance of changes in bacterial abundance (42), we report similar changes as others in response to long-term ingestion of a HF diet and in cross-sectional studies in obese subjects (10, 12, 24, 38); however, we are the first to characterize the small intestinal bacterial signature due to a HF diet and highlight discrepancies with other previous findings. One major difference in the present study is that we report a decrease in the abundance in the Archaea kingdom. Turnbaugh et al. (49) have reported an increase in Archaea in ob/ob mice and hypothesized that that the microbiota have a greater ability to harvest energy from diets compared with lean counterparts. Our data show that Archaea and plant polysaccharides-degrading Prevotella (21) decrease in abundance within 1 wk on a HF diet in both the small and large intestine. The HF diet used was both high in fat and low in fiber; thus we hypothesize that the abundance of these genus are a result of the high fiber content in chow.
There is conflicting evidence regarding the relative abundance of the genus Akkermansia in obesity and whether it may be beneficial in obesity and metabolic disease. In the current study, there is an increase in abundance of Akkermansia when animals are ingesting a HF diet. In studies involving animal models of gastric bypass (26), ob/ob mice (15), or diet-induced obese mice (44), Akkermansia has lower abundance in the diseased state. Individuals with type 2 diabetes have higher abundance of Akkermansia compared with nondiabetic controls (37). This genus is a mucin-degrader; it has been shown that a HF diet leads to a decrease in mucus thickness, which can be restored by gavage of Akkermansia (15). Our data show that the number of goblet cells/crypt in the cecum is decreased after a week, concurrent with a decrease in crypt depth, even though there is an increase in Akkermansia in the large intestine after 6 wk. Further research is needed to identify why the abundance of this bacteria is connected to obesity and metabolic syndrome.
Interestingly, genera within the order Bacteroidales (Gram-negative bacteria) increase in relative abundance progressively and have significant positive correlation with the increase in transcellular flux in the large intestine and the onset of the obese phenotype. These changes also correlate with increase in plasma levels of LBP, likely reflecting an increase in plasma LPS derived from both cecal and colonic bacteria; although the composition of the latter was not measured in the current study, unpublished data from our group would suggest there are similar changes between cecum and colonic microbiota in response to a HF diet. The family Bacteroidaceae is the most extensively studied and has been shown to be both beneficial to the host but also to contain pathogenic genera (52). Our data show an increase in abundance of the genus Butyricimonas, a butyrate-producing bacteria. Butyricimonas, along with other genera in the Bacteroidales order, are also increased in rats after dextran sulfate sodium-induced colitis (41). Butyrate is a major source for energy for colonocytes (21), which suggests that there may be host-microbe communication that promotes growth of bacteria that will help restore the epithelial barrier in times of challenge and inflammation, such as ingestion of HF diet or colitis.
The role of intestinal inflammation with obesity associated systemic inflammation and gut barrier function is unclear. Gut inflammation measured with myeloperoxidase, a neutrophil marker, is increased in rats after 12 wk on a HF diet (12), and proinflammatory cytokine (TNF-α) expression in the ileum has been shown to be positively correlated to adiposity, becoming significantly increased compared with controls after 6 wk in mice on a HF diet (14). Here we also show a positive correlation between proinflammatory cytokine expression in the ileum (IL-1β) and adiposity. However, we also show that a decrease in anti-inflammatory gene expression (IL-10) precedes the increase in the proinflammatory cytokine expression. IL-10 knockout mice have increased intestinal permeability before the onset of microbiota-induced gut inflammation (29). Innoculating rodents with Clostridum increases expression of IL-10 from colonic immune cells (1), and IL-10 exposure of intestinal epithelial cells in culture will maintain tight junctions in the presence of inflammatory insult (28). Thus the decreased in IL-10 in the ileum may be causative of the increase in paracellular permeability; whether the lack of Oscillospira (within the order Clostridiales) in the ileum after 1 wk on a HF diet is the cause of decreased IL-10 requires further investigation but is a reasonable hypothesis.
In conclusion, we have demonstrated by ex vivo determination of gut barrier function and next-generation sequencing analysis of microbiota that the response to a HF diet in rodents differs in a time- and region-dependent manner. How the early onset changes in the small intestine and the later onset changes in the large intestine contribute to the altered gut-brain pathway and increase in food intake and adiposity requires further investigation. We have identified IL-10 and Oscillospira in the ileum, and increase in transcellular flux in the large intestine, as possible targets. It is possible that different mechanisms and pathways can now be delineated that result in the onset and/or maintenance of the obese phenotype.
GRANTS
This work was supported by National Institute of Diabetes and Digestive and Kidney Diseases Grant 41004 (to H. E. Raybould). G. Boudry was funded by a FP7-PEOPLE-2011-IOF Grant (Symobigut No. 298697). M. K. Hamilton was funded by a Chateaubriand Fellowship.
DISCLOSURES
No conflicts of interest, financial or otherwise, are declared by the author(s).
AUTHOR CONTRIBUTIONS
Author contributions: M.K.H., G.B., and H.E.R. conception and design of research; M.K.H. and G.B. performed experiments; M.K.H., G.B., D.G.L., and H.E.R. analyzed data; M.K.H., G.B., D.G.L., and H.E.R. interpreted results of experiments; M.K.H. prepared figures; M.K.H. and H.E.R. drafted manuscript; M.K.H., G.B., D.G.L., and H.E.R. edited and revised manuscript; M.K.H., G.B., D.G.L., and H.E.R. approved final version of manuscript.
ACKNOWLEDGMENTS
We thank Armelle Cahu and Angélique Heichette for technical assistance with the histology analysis. We acknowledge Matt Rolston and University of California Davis Host-Microbe Core for microbiota sequencing.
REFERENCES
- 1.Atarashi K, Tanoue T, Shima T, Imaoka A, Kuwahara T, Momose Y, Cheng G, Yamasaki S, Saito T, Ohba Y, Taniguchi T, Takeda K, Hori S, Ivanov II, Umesaki Y, Itoh K, Honda K. Induction of colonic regulatory T cells by indigenous Clostridium species. Science 331: 337–341, 2011. [DOI] [PMC free article] [PubMed] [Google Scholar]
- 2.Backhed F, Manchester JK, Semenkovich CF, Gordon JI. Mechanisms underlying the resistance to diet-induced obesity in germ-free mice. Proc Natl Acad Sci USA 104: 979–984, 2007. [DOI] [PMC free article] [PubMed] [Google Scholar]
- 3.Brignardello J, Morales P, Diaz E, Romero J, Brunser O, Gotteland M. Pilot study: alterations of intestinal microbiota in obese humans are not associated with colonic inflammation or disturbances of barrier function. Aliment Pharmacol Ther 32: 1307–1314, 2010. [DOI] [PubMed] [Google Scholar]
- 4.Brun P, Castagliuolo I, Di Leo V, Buda A, Pinzani M, Palu G, Martines D. Increased intestinal permeability in obese mice: new evidence in the pathogenesis of nonalcoholic steatohepatitis. Am J Physiol Gastrointest Liver Physiol 292: G518–G525, 2007. [DOI] [PubMed] [Google Scholar]
- 5.Cani PD, Bibiloni R, Knauf C, Waget A, Neyrinck AM, Delzenne NM, Burcelin R. Changes in gut microbiota control metabolic endotoxemia-induced inflammation in high-fat diet-induced obesity and diabetes in mice. Diabetes 57: 1470–1481, 2008. [DOI] [PubMed] [Google Scholar]
- 6.Cani PD, Possemiers S, Van de Wiele T, Guiot Y, Everard A, Rottier O, Geurts L, Naslain D, Neyrinck A, Lambert DM, Muccioli GG, Delzenne NM. Changes in gut microbiota control inflammation in obese mice through a mechanism involving GLP-2-driven improvement of gut permeability. Gut 58: 1091–1103, 2009. [DOI] [PMC free article] [PubMed] [Google Scholar]
- 7.Caporaso JG, Kuczynski J, Stombaugh J, Bittinger K, Bushman FD, Costello EK, Fierer N, Pena AG, Goodrich JK, Gordon JI, Huttley GA, Kelley ST, Knights D, Koenig JE, Ley RE, Lozupone CA, McDonald D, Muegge BD, Pirrung M, Reeder J, Sevinsky JR, Turnbaugh PJ, Walters WA, Widmann J, Yatsunenko T, Zaneveld J, Knight R. QIIME allows analysis of high-throughput community sequencing data. Nat Methods 7: 335–336, 2010. [DOI] [PMC free article] [PubMed] [Google Scholar]
- 8.Caporaso JG, Lauber CL, Walters WA, Berg-Lyons D, Lozupone CA, Turnbaugh PJ, Fierer N, Knight R. Global patterns of 16S rRNA diversity at a depth of millions of sequences per sample. Proc Natl Acad Sci USA 108, Suppl 1: 4516–4522, 2011. [DOI] [PMC free article] [PubMed] [Google Scholar]
- 9.Covasa M, Ritter RC. Rats maintained on high-fat diets exhibit reduced satiety in response to CCK and bombesin. Peptides 19: 1407–1415, 1998. [DOI] [PubMed] [Google Scholar]
- 10.Daniel H, Moghaddas Gholami A, Berry D, Desmarchelier C, Hahne H, Loh G, Mondot S, Lepage P, Rothballer M, Walker A, Bohm C, Wenning M, Wagner M, Blaut M, Schmitt-Kopplin P, Kuster B, Haller D, Clavel T. High-fat diet alters gut microbiota physiology in mice. ISME J 8: 295–308, 2014. [DOI] [PMC free article] [PubMed] [Google Scholar]
- 11.David LA, Maurice CF, Carmody RN, Gootenberg DB, Button JE, Wolfe BE, Ling AV, Devlin AS, Varma Y, Fischbach MA, Biddinger SB, Dutton RJ, Turnbaugh PJ. Diet rapidly and reproducibly alters the human gut microbiome. Nature 505: 559–563, 2014. [DOI] [PMC free article] [PubMed] [Google Scholar]
- 12.de La Serre CB, Ellis CL, Lee J, Hartman AL, Rutledge JC, Raybould HE. Propensity to high-fat diet-induced obesity in rats is associated with changes in the gut microbiota and gut inflammation. Am J Physiol Gastrointest Liver Physiol 299: G440–G448, 2010. [DOI] [PMC free article] [PubMed] [Google Scholar]
- 13.Ding PH, Jin LJ. The role of lipopolysaccharide-binding protein in innate immunity: a revisit and its relevance to oral/periodontal health. J Periodontal Res 49: 1–9, 2014. [DOI] [PubMed] [Google Scholar]
- 14.Ding S, Chi MM, Scull BP, Rigby R, Schwerbrock NM, Magness S, Jobin C, Lund PK. High-fat diet: bacteria interactions promote intestinal inflammation which precedes and correlates with obesity and insulin resistance in mouse. PLoS One 5: e12191, 2010. [DOI] [PMC free article] [PubMed] [Google Scholar]
- 15.Everard A, Belzer C, Geurts L, Ouwerkerk JP, Druart C, Bindels LB, Guiot Y, Derrien M, Muccioli GG, Delzenne NM, de Vos WM, Cani PD. Cross-talk between Akkermansia muciniphila and intestinal epithelium controls diet-induced obesity. Proc Natl Acad Sci USA 110: 9066–9071, 2013. [DOI] [PMC free article] [PubMed] [Google Scholar]
- 16.Finucane MM, Stevens GA, Cowan MJ, Danaei G, Lin JK, Paciorek CJ, Singh GM, Gutierrez HR, Lu Y, Bahalim AN, Farzadfar F, Riley LM, Ezzati M. National, regional, and global trends in body-mass index since 1980: systematic analysis of health examination surveys and epidemiological studies with 960 country-years and 9.1 million participants. Lancet 377: 557–567, 2011. [DOI] [PMC free article] [PubMed] [Google Scholar]
- 17.Folch J, Lees M, Sloane Stanley GH. A simple method for the isolation and purification of total lipides from animal tissues. J Biol Chem 226: 497–509, 1957. [PubMed] [Google Scholar]
- 18.Ghoshal S, Witta J, Zhong J, de Villiers W, Eckhardt E. Chylomicrons promote intestinal absorption of lipopolysaccharides. J Lipid Res 50: 90–97, 2009. [DOI] [PubMed] [Google Scholar]
- 19.Gilbert JA, Meyer F, Antonopoulos D, Balaji P, Brown CT, Desai N, Eisen JA, Evers D, Field D, Feng W, Huson D, Jansson J, Knight R, Knight J, Kolker E, Konstantindis K, Kostka J, Kyrpides N, Mackelprang R, McHardy A, Quince C, Raes J, Sczyrba A, Shade A, Stevens R. Meeting report: the terabase metagenomics workshop and the vision of an Earth microbiome project. Stand Genomic Sci 3: 243–248, 2010. [DOI] [PMC free article] [PubMed] [Google Scholar]
- 20.Hariri N, Thibault L. High-fat diet-induced obesity in animal models. Nutr Res Rev 23: 270–299, 2010. [DOI] [PubMed] [Google Scholar]
- 21.Honda K, Littman DR. The microbiome in infectious disease and inflammation. Annu Rev Immunol 30: 759–795, 2012. [DOI] [PMC free article] [PubMed] [Google Scholar]
- 22.Knoop KA, Miller MJ, Newberry RD. Transepithelial antigen delivery in the small intestine: different paths, different outcomes. Curr Opin Gastroenterol 29: 112–118, 2013. [DOI] [PMC free article] [PubMed] [Google Scholar]
- 23.Le S, Josse J, Husson F. FactoMineR: an R package for multivariate analysis. J Stat Software 25: 1–18, 2008. [Google Scholar]
- 24.Ley RE, Backhed F, Turnbaugh P, Lozupone CA, Knight RD, Gordon JI. Obesity alters gut microbial ecology. Proc Natl Acad Sci USA 102: 11070–11075, 2005. [DOI] [PMC free article] [PubMed] [Google Scholar]
- 25.Ley RE, Turnbaugh PJ, Klein S, Gordon JI. Microbial ecology: human gut microbes associated with obesity. Nature 444: 1022–1023, 2006. [DOI] [PubMed] [Google Scholar]
- 26.Liou AP, Paziuk M, Luevano JM Jr, Machineni S, Turnbaugh PJ, Kaplan LM. Conserved shifts in the gut microbiota due to gastric bypass reduce host weight and adiposity. Sci Transl Med 5: 178ra141, 2013. [DOI] [PMC free article] [PubMed] [Google Scholar]
- 27.Mackie RI, Aminov RI, Hu W, Klieve AV, Ouwerkerk D, Sundset MA, Kamagata Y. Ecology of uncultivated Oscillospira species in the rumen of cattle, sheep, and reindeer as assessed by microscopy and molecular approaches. Appl Environ Microbiol 69: 6808–6815, 2003. [DOI] [PMC free article] [PubMed] [Google Scholar]
- 28.Madsen KL, Lewis SA, Tavernini MM, Hibbard J, Fedorak RN. Interleukin 10 prevents cytokine-induced disruption of T84 monolayer barrier integrity and limits chloride secretion. Gastroenterology 113: 151–159, 1997. [DOI] [PubMed] [Google Scholar]
- 29.Madsen KL, Malfair D, Gray D, Doyle JS, Jewell LD, Fedorak RN. Interleukin-10 gene-deficient mice develop a primary intestinal permeability defect in response to enteric microflora. Inflamm Bowel Dis 5: 262–270, 1999. [DOI] [PubMed] [Google Scholar]
- 30.Mani V, Hollis JH, Gabler NK. Dietary oil composition differentially modulates intestinal endotoxin transport and postprandial endotoxemia. Nutr Metab (Lond) 10: 6, 2013. [DOI] [PMC free article] [PubMed] [Google Scholar]
- 31.McDonald D, Price MN, Goodrich J, Nawrocki EP, DeSantis TZ, Probst A, Andersen GL, Knight R, Hugenholtz P. An improved Greengenes taxonomy with explicit ranks for ecological and evolutionary analyses of bacteria and archaea. ISME J 6: 610–618, 2012. [DOI] [PMC free article] [PubMed] [Google Scholar]
- 32.Menard S, Cerf-Bensussan N, Heyman M. Multiple facets of intestinal permeability and epithelial handling of dietary antigens. Mucosal Immunol 3: 247–259, 2010. [DOI] [PubMed] [Google Scholar]
- 33.Musso G, Gambino R, Cassader M. Interactions between gut microbiota and host metabolism predisposing to obesity and diabetes. Annu Rev Med 62: 361–380, 2011. [DOI] [PubMed] [Google Scholar]
- 34.Natividad JM, Verdu EF. Modulation of intestinal barrier by intestinal microbiota: pathological and therapeutic implications. Pharmacol Res 69: 42–51, 2013. [DOI] [PubMed] [Google Scholar]
- 35.Paulino G, Barbier de la Serre C, Knotts TA, Oort PJ, Newman JW, Adams SH, Raybould HE. Increased expression of receptors for orexigenic factors in nodose ganglion of diet-induced obese rats. Am J Physiol Endocrinol Metab 296: E898–E903, 2009. [DOI] [PMC free article] [PubMed] [Google Scholar]
- 36.Peterson LW, Artis D. Intestinal epithelial cells: regulators of barrier function and immune homeostasis. Nat Rev Immunol 14: 141–153, 2014. [DOI] [PubMed] [Google Scholar]
- 37.Qin J, Li Y, Cai Z, Li S, Zhu J, Zhang F, Liang S, Zhang W, Guan Y, Shen D, Peng Y, Zhang D, Jie Z, Wu W, Qin Y, Xue W, Li J, Han L, Lu D, Wu P, Dai Y, Sun X, Li Z, Tang A, Zhong S, Li X, Chen W, Xu R, Wang M, Feng Q, Gong M, Yu J, Zhang Y, Zhang M, Hansen T, Sanchez G, Raes J, Falony G, Okuda S, Almeida M, LeChatelier E, Renault P, Pons N, Batto JM, Zhang Z, Chen H, Yang R, Zheng W, Yang H, Wang J, Ehrlich SD, Nielsen R, Pedersen O, Kristiansen K. A metagenome-wide association study of gut microbiota in type 2 diabetes. Nature 490: 55–60, 2012. [DOI] [PubMed] [Google Scholar]
- 38.Ravussin Y, Koren O, Spor A, LeDuc C, Gutman R, Stombaugh J, Knight R, Ley RE, Leibel RL. Responses of gut microbiota to diet composition and weight loss in lean and obese mice. Obesity (Silver Spring) 20: 738–747, 2012. [DOI] [PMC free article] [PubMed] [Google Scholar]
- 39.Raybould HE. Gut microbiota, epithelial function and derangements in obesity. J Physiol 590: 441–446, 2012. [DOI] [PMC free article] [PubMed] [Google Scholar]
- 40.Salim SY, Söderholm JD. Importance of disrupted intestinal barrier in inflammatory bowel diseases. Inflamm Bowel Dis 17: 362–381, 2011. [DOI] [PubMed] [Google Scholar]
- 41.Samanta AK, Torok VA, Percy NJ, Abimosleh SM, Howarth GS. Microbial fingerprinting detects unique bacterial communities in the faecal microbiota of rats with experimentally-induced colitis. J Microbiol 50: 218–225, 2012. [DOI] [PubMed] [Google Scholar]
- 42.Segata N, Izard J, Waldron L, Gevers D, Miropolsky L, Garrett WS, Huttenhower C. Metagenomic biomarker discovery and explanation. Genome Biol 12: R60, 2011. [DOI] [PMC free article] [PubMed] [Google Scholar]
- 43.Serino M, Luche E, Gres S, Baylac A, Berge M, Cenac C, Waget A, Klopp P, Iacovoni J, Klopp C, Mariette J, Bouchez O, Lluch J, Ouarne F, Monsan P, Valet P, Roques C, Amar J, Bouloumie A, Theodorou V, Burcelin R. Metabolic adaptation to a high-fat diet is associated with a change in the gut microbiota. Gut 61: 543–553, 2012. [DOI] [PMC free article] [PubMed] [Google Scholar]
- 44.Shin NR, Lee JC, Lee HY, Kim MS, Whon TW, Lee MS, Bae JW. An increase in the Akkermansia spp. population induced by metformin treatment improves glucose homeostasis in diet-induced obese mice. Gut 63: 727–735, 2014. [DOI] [PubMed] [Google Scholar]
- 45.Siddiqi S, Sheth A, Patel F, Barnes M, Mansbach CM 2nd. Intestinal caveolin-1 is important for dietary fatty acid absorption. Biochim Biophys Acta 1831: 1311–1321, 2013. [DOI] [PMC free article] [PubMed] [Google Scholar]
- 46.Teixeira TF, Souza NC, Chiarello PG, Franceschini SC, Bressan J, Ferreira CL, Peluzio Mdo C. Intestinal permeability parameters in obese patients are correlated with metabolic syndrome risk factors. Clin Nutr 31: 735–740, 2012. [DOI] [PubMed] [Google Scholar]
- 47.Tilg H, Kaser A. Gut microbiome, obesity, and metabolic dysfunction. J Clin Invest 121: 2126–2132, 2011. [DOI] [PMC free article] [PubMed] [Google Scholar]
- 48.Tims S, Derom C, Jonkers DM, Vlietinck R, Saris WH, Kleerebezem M, de Vos WM, Zoetendal EG. Microbiota conservation and BMI signatures in adult monozygotic twins. ISME J 7: 707–717, 2013. [DOI] [PMC free article] [PubMed] [Google Scholar]
- 49.Turnbaugh PJ, Ley RE, Mahowald MA, Magrini V, Mardis ER, Gordon JI. An obesity-associated gut microbiome with increased capacity for energy harvest. Nature 444: 1027–1031, 2006. [DOI] [PubMed] [Google Scholar]
- 50.Van Itallie CM, Holmes J, Bridges A, Gookin JL, Coccaro MR, Proctor W, Colegio OR, Anderson JM. The density of small tight junction pores varies among cell types and is increased by expression of claudin-2. J Cell Sci 121: 298–305, 2008. [DOI] [PubMed] [Google Scholar]
- 51.Verdam FJ, Fuentes S, de Jonge C, Zoetendal EG, Erbil R, Greve JW, Buurman WA, de Vos WM, Rensen SS. Human intestinal microbiota composition is associated with local and systemic inflammation in obesity. Obesity (Silver Spring) 21: E607–615, 2013. [DOI] [PubMed] [Google Scholar]
- 52.Wexler HM. Bacteroides: the good, the bad, and the nitty-gritty. Clin Microbiol Rev 20: 593–621, 2007. [DOI] [PMC free article] [PubMed] [Google Scholar]
- 53.Yamabayashi S. Periodic acid-Schiff-alcian blue: a method for the differential staining of glycoproteins. Histochem J 19: 565–571, 1987. [DOI] [PubMed] [Google Scholar]