

Abstract
We compared response patterns and electrical receptive fields (ERF) of retinal ganglion cells (RGCs) during epiretinal and subretinal electrical stimulation of isolated mouse retina. Retinas were stimulated with an array of 3200 independently controllable electrodes. Four response patterns were observed: a burst of activity immediately after stimulation (Type I cells, Vision Research (2008), 48, 1562–1568), delayed bursts beginning >25 ms after stimulation (Type II), a combination of both (Type III), and inhibition of ongoing spike activity. Type I responses were produced more often by epiretinal than subretinal stimulation whereas delayed and inhibitory responses were evoked more frequently by subretinal stimulation. Response latencies were significantly shorter with epiretinal than subretinal stimulation. These data suggest that subretinal stimulation is more effective at activating intraretinal circuits than epiretinal stimulation. There was no significant difference in charge threshold between subretinal and epiretinal configurations. ERFs were defined by the stimulating array surface area that successfully stimulated spikes in an RGC. ERFs were complex in shape, similar to receptive fields mapped with light. ERF areas were significantly smaller with subretinal than epiretinal stimulation. This may reflect the greater distance between stimulating electrodes and RGCs in the subretinal configuration. ERFs for immediate and delayed responses mapped within the same Type III cells differed in shape and size, consistent with different sites and mechanisms for generating these two response types.
Keywords: Retina, Mouse, Electrical stimulation, Extracellular recording, Retinal prosthesis, High resolution electrode array
1. Introduction
Outer retinal degeneration disorders are a heterogeneous group of diseases. Two of the more common ones are retinitis pigmentosa (RP) and age related macular degeneration (AMD). RP is the leading cause of inherited blindness (Bunker et al., 1984) and AMD is the main cause of visual loss among adults over the age of 65 in developed countries. Post-mortem morphometric analysis of the retina of RP and AMD patients revealed that many more inner nuclear layer (INL) cells (bipolar cells and others, 78.4%), and ganglion cell layer cells (29.7%) are retained compared to outer nuclear layer (ONL) cells (photoreceptors, 4.9%) (Humayun, de Juan, et al., 1999; Kim et al., 2002; Santos et al., 1997; Stone et al., 1992). The limited degeneration of inner retinal neurons suggests that it may be feasible to electrically stimulate the remaining retinal neurons and bypass the degenerated photoreceptors, thereby restoring some form of functional vision.
There are several groups pursuing various retinal implants, two of which have achieved commercial success. The ARGUS II epiretinal implant (Second Sight, Sylmar CA) and the Alpha IMS subretinal implant (Retina Implant AG, Reutlingen Germany) have received European approval (CE Mark). In addition, ARGUS II recently received marketing approval from the U.S. Food and Drug Administration (FDA). Clinical studies of both devices have demonstrated safety and efficacy (Humayun et al., 2012; Stingl et al., 2013). Indeed, patients implanted with the ARGUS II, an epiretinal implant, performed statistically better with the system on vs. off during various visual tasks. The Alpha IMS, a subretinal implant, also significantly improved the ability of patients to identify, localize, and discriminate objects. While these developments are very encouraging, many questions remain about the electrophysiological processes that take place in the retina during such stimulation. A better understanding of these mechanisms would contribute to improved stimulation strategies and devices.
1.1. In vitro and in vivo studies of retinal electrical stimulation
Safe and effective stimulation parameters of retinal implants have been investigated and established in several studies (Chader, Weiland, & Humayun, 2009; Fernandes et al., 2012; Margalit et al., 2002; Shah, Montezuma, & Rizzo, 2006). Electrical stimulation evoked two types of activity in both retinal ganglion cells (RGCs) and visual cortex: an early response (typically 10 ms or less post stimulation), and a late response (greater than 50 ms post stimulation) (Chen et al., 2006; Jensen, Ziv, & Rizzo, 2005; Margalit & Thoreson, 2006; Margalit et al., 2011). Direct RGC stimulation was responsible for the early response whereas the late response originated from retinal neurons presynaptic to RGCs. RGCs typically showed lower thresholds to electrical stimulation, and could be activated by shorter pulses than other cells (e.g. photoreceptors, bipolar cells) (Fried, Hsueh, & Werblin, 2006; Jensen, Ziv, & Rizzo, 2005; Margalit & Thoreson, 2006; Suzuki et al., 2004).
A number of important questions regarding the use of retinal stimulation arrays remain unresolved. In this study, we focused on two: (1) Is epiretinal or subretinal placement of the array preferable? (2) What are the shapes and sizes of RGCs receptive fields when electrical stimulation is used?
Some investigators have argued in favor of epiretinal placement of prosthetic arrays and others favor subretinal placement (Humayun, Prince, et al., 1999; Zrenner et al., 1999). Advantages of subretinal placement include the greater likelihood of bipolar cell activation which may produce less distortion of the retinotopic map of the visual scene than activation of RGC axons (Zrenner et al., 1999). Advantages of epiretinal placement include easier surgical placement, unimpeded oxygen diffusion from the choroid, and the unobstructed view of arrays with an ophthalmoscope. Another potentially important advantage of either epiretinal or subretinal placements is that it may provide a lower threshold for activation of RGCs. The use of lower currents enhances device safety, lowers power demand, and may produce smaller electrical ‘‘receptive fields’’ (i.e., the spatial pattern of electrode activity needed to bring a cell to threshold). The current study compares electrical stimulation thresholds of RGCs using a novel retinal stimulation device developed by the Naval Research Laboratory (NRL) with a 3200 electrode stimulation array placed on either the epiretinal or subretinal surface (Fig. 1a–c). One is capable of choosing any number of electrodes to be activated during the experiment.
Fig. 1.
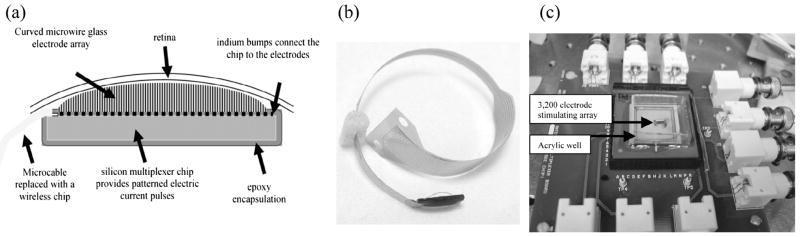
The 3200 electrode Naval Research Laboratory retinal prosthesis. (a) Schematic design of the retinal prosthesis. (b) A photo of the wired prosthesis designed for implantation. (c) Benchtop version of the retinal prosthesis stimulation array mounted in an acrylic well to allow perfusion of the retina.
The electrical receptive field (ERF) can be defined as the area of retina over which electrical stimulation can evoke responses in a given RGC. Previous studies indicate that ERFs, like RGC receptive fields mapped with light, are roughly equivalent to the dendritic areas of RGCs (Eickenscheidt et al., 2012; Stett, Mai, & Herrmann, 2007). The location, pattern, and size of ERFs are influenced by a number of different factors. Given the same stimulus, larger ERFs should be obtained when the stimulating electrode is closer to the stimulated cell, such as in the case of epiretinal stimulation. In addition, distance considerations suggest that subretinal stimulation should evoke bipolar and amacrine cells more easily than epiretinal stimulation and stimulation of these cells can recruit retinal processing mechanisms which may decrease the size of ERF. To test these ideas, we compared ERFs obtained with epiretinal and subretinal placement of the stimulating array.
2. Materials and methods
2.1. General procedures
Several general procedures that are common to most or all of the proposed experiments are described. Unless otherwise stated, chemicals were obtained from Sigma–Aldrich (St. Louis, MO).
2.2. Preparation of the retina
Mice were handled humanely according to the guidelines of the Association for Research in Vision and Ophthalmology and protocols approved by the Institutional Animal Care and Use Committees at VA Nebraska-Western Iowa Health Care System, and the University of Nebraska Medical Center.
Retina was isolated from 4 to 12 week old normal mice (C57BL/ 6J). Mice were euthanized by CO2 asphyxiation and cervical dislocation. One eye was immediately enucleated, the anterior segment was dissected under a surgical microscope, and then the retina was carefully separated. Isolated retinas were placed in a perfusion chamber on the electrical stimulation array with either the RGCs in contact with the array (epiretinal placement) or with photoreceptors in contact with the array (subretinal placement).
2.3. Extracellular solutions
Oxygenated Ames’ Medium (35 °C) was delivered to the perfusion chamber at 1–3 ml/min using a single pass, gravity-feed perfusion system. In some experiments, we added 100 μM CdCl2 to the Ames’ Medium to block synaptic transmission.
2.4. Electrical stimuli
A benchtop version of a multi-electrode array, which was developed at NRL (Jensen et al., 2009; Johnson et al., 2004, 2007), was used for electrical stimulation (Fig. 1c). This benchtop version of the prosthetic device consisted of 3200 electrode stimulation array mounted within an acrylic well. The stimulation array was connected directly to a desktop computer and a complete drive system was assembled to control the NRL device.
Details of the NRL array have been described previously (Jensen et al., 2009; Johnson et al., 2007; Scribner et al., 2002). Briefly, the fabrication process involved the sequential stacking and drawing of concentric glass tubes. The result was a hexagonal formation of 10 μm concentric fibers that was sliced into 1 mm thick wafers for further processing. The wafers, called microchannel plate glass (Fig. 2a), were dipped into acetic acid to etch out the cores of the concentric glass. This yielded a wafer with hollow channels perpendicular to the surface, ready to be filled with metal microwires by electroplating or other means. The array was placed in a hydro-fluoric acid solution to chemically etch-back the glass and create protruding (Fig. 2b) microwires. Finally, the exposed microwires were clad with a thin layer of platinum (Fig. 2c). The array was bonded to a multiplexer chip with indium bumps. There is one 30 × 20 μm indium bump (Fig. 2d) for each of the 3200 electrodes. Pressure was applied to the surface of the microwire glass array to push the wires a few microns into the soft indium metal. The indium bump spread under the pressure to cover a planar area of approximately 45 × 30 μm (Fig. 2e). Once hybridized to the stimulating multiplexer chip, there were approximately 20 microwires embedded into indium per electrode. The manufacturing process resulted in a 3200 (80 × 40) array of electrodes in an area of 4 × 1.4 mm. Individual electrodes interfaces (45 × 30 μm) have a center-to-center spacing of 50 × 36 μm.
Fig. 2.
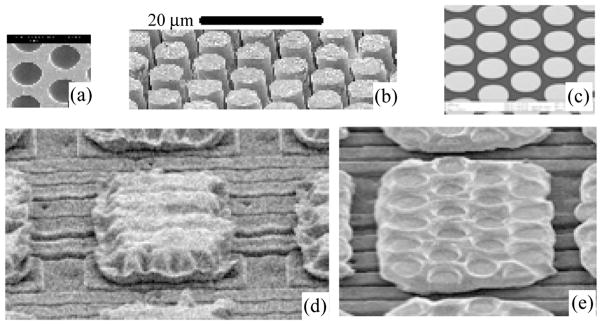
Images of the microwires and indium bumps. The microchannel plate glass prior to electroplating (a) and after electroplating and etching (b) and platinum microwires (c). Indium bump (d) prior to bonding with the microwire array. Indium bump (e) after bonding and removal of the microwires for observation purposes. Normally the microwires remain after bonding.
Electrical stimulation with the device is supported by a charge storage capacitor and transconductance amplifier that are included in each unit cell. The basic operation involves two steps performed in a sequential order and then continuously repeated at rates up to 16 frames per second. During the first step, an image frame is loaded pixel-by-pixel into corresponding unit cells. After all the unit cells are loaded with the pixel values for the current frame, the second step is to send a biphasic pulse to the transconductance amplifier in each unit cell, which in turn is modulated in proportion to the pixel value in each unit cell. The biphasic pulse flows from an external source, through each unit cell and its corresponding microwire glass electrodes, thus stimulating the retina in a simultaneous manner. Image sequences to stimulate the retina were created using MATLAB (The MathWorks, Natick, MA). For all of the experiments in this study, we used square, charge balanced pulses with a 2 ms cathodic stimulating current balanced by an equal amount of 2 ms anodic current with a 1 ms interpulse interval. The cathodic charge density was 0.355 mC/cm2. Because charge density per electrode was held constant, the threshold was calculated from the total charge which is directly related to the number of electrodes needed to evoke an RGC response at least 50% of the time.
2.5. Electrophysiological recording
Stimulation was applied using the 3200 electrode NRL benchtop device and extracellular activity was recorded using a 16-electrode recording array (Alpha Omega Co., Alpharetta, GA). The individual recording electrodes were made of parylene-coated tungsten and had an impedance of 1 MΩ apiece. The electrodes were arranged in 3 rows of 6, 4, 6 electrodes respectively, with 0.1 mm between adjacent electrodes in each row and 0.25 mm between rows.
Data were acquired using a 16-channel amplifier (Multi-Channel Processor (MCP), Alpha Omega Co.) and a data acquisition system (Alpha Map, Alpha Omega Co.). The MCP amplifier had 16 channels each with adjustable gain and frequency settings. We typically used a gain of 20,000 with a bandwidth of 0.3–3.0 kHz.
We recorded from cells with the retina placed on the array in either an epiretinal position with the RGCs lying directly above the stimulating electrodes (n = 46) or a subretinal position with the photoreceptors lying above the stimulating electrode (n = 59).
The recording electrodes were positioned near the retinal surface under direct microscopic observation. Electrodes were then advanced into the retina using a motorized micromanipulator (Siskiyou Instruments, Grants Pass, OR) while monitoring activity on an oscilloscope (TDS 1001B, Tektronix Inc., Beaverton, OR) and through an audio monitor (ACS90, Altec Lansing, New York, NY). Surface contact could be detected by changes in background noise. After contact, electrodes were carefully advanced until single unit activity was detected. In the subretinal configuration, RGCs lay on the top surface of the retina and were readily accessible to the recording electrode. However, in the epiretinal configuration, it was necessary for the recording electrode to penetrate the retina from the photoreceptor side to reach RGCs.
Once single unit spontaneous activity was detected, we activated an 8 × 8 pixel stimulation pattern and sequentially stepped the pattern across the entire NRL device using a series of brief biphasic pulses applied at 0.5 s intervals. Areas with noticeable evoked responses were stimulated with progressively smaller patterns until the response disappeared. This determined the minimum pattern that evoked a response and then that size pattern was used to map the ERF of the cell. The ERF refers to the entire collection of pixels on the chip that can individually activate a cell. Each stimulus was applied 10 times at a frequency of 2 Hz. We compared ERFs with the stimulation array positioned sub-retinally or epiretinally using normal mice retina.
To analyze the data, we used an off-line spike sorting software (Spike 2, Cambridge Electronic Design, Cambridge, England) that allowed discrimination of multiple spikes per electrode. Spike detection was performed by comparing different spikes to templates that were customized by the user around the different spike configurations. The user could pick a variable number of template points with variable spacing between the points to create a template that matched a specific spike shape. The templates could also automatically adapt to changes in spike shape during the experiment. A spike was considered for analysis if the signal to noise ratio surpassed 2, and if the response appeared in at least 50% of the trials. We limited our analysis to 3 or fewer units per electrode.
2.6. Statistics
Numerical values are given as mean and standard error of the mean (SEM). Statistical significance was determined with Chi-Squared, Pearson’s correlation, ANOVA, or Student’s t-tests according to the circumstances. The criterion for statistical significance was chosen to be p < 0.05.
3. Results
The results presented in this study were obtained using a 3200 electrode stimulating array to stimulate isolated mice retinas and a multielectrode recording system that has 16 individual tungsten microelectrodes. Using waveform templates, we were able to identify and separate spike responses from multiple cells simultaneously. For example, Fig. 3 shows evoked activity recorded simultaneously from at least 5 cells on 4 different channels.
Fig. 3.

Example of evoked activity recorded simultaneously from at least 5 retinal ganglion cells using 4 different extracellular electrodes.
Both epi- and subretinal stimulation often evoked bursts of spikes immediately after stimulation, corresponding to Type I cells characterized by Jensen and Rizzo (Fig. 4a) (Jensen & Rizzo, 2008). We defined immediate responses as cells exhibiting spikes within 25 ms of the stimulus artifact. In addition to immediate activation, epi- and subretinal stimulation could also evoke more delayed bursts (Fig. 4b), similar to Type II cells of Jensen and Rizzo (2008). With subretinal stimulation, Type III cells showing an immediate burst followed by a delayed burst were also sometimes evident (Fig. 4c). In a few cells, activation of the array inhibited ongoing tonic spiking activity (not shown).
Fig. 4.

Examples of Type I (a), Type II (b) and Type III (c) responses evoked by epiretinal (left column) and subretinal (right column) stimulation. Each trace shows responses to three consecutive stimulus pulses. Stimulus electrical artifacts are indicated by the arrows.
The frequencies with which we observed these different response patterns are summarized in Table 1. A total of 59 RGCs from 13 mouse retinas were recorded during subretinal stimulation, and 46 RGCs from 15 mouse retinas were recorded during epiretinal stimulation. Immediate excitation, which is largely due to direct activation of RGCs as described further below, was evoked more often by epiretinal (83%) than subretinal stimulation (53%). Conversely, delayed responses observed in Type II and Type III cells, which involve intraretinal synaptic activity (Jensen & Rizzo, 2008), were evoked more frequently by subretinal (18/59 cells, 31%) than epiretinal stimulation (7/46 cells, 15%). Inhibitory responses were also observed more often with subretinal (17%) than epiretinal stimulation (2%). These differences in the occurrence of different response types evoked by epi- vs. sub-retinal stimulation were statistically significant (p = 0.0012, exact chi-square test). The greater frequency of inhibitory and delayed responses suggests that subretinal stimulation is more effective at activating intraretinal circuits than epiretinal stimulation.
Table 1.
Distribution of responses for subretinal and epiretinal configurations.
| Response type | Subretinal
|
Epiretinal
|
||
|---|---|---|---|---|
| # Cells | % | # Cells | % | |
| Type I: excitatory | 31 | 52.5 | 38 | 82.6 |
| Type II: delayed excitatory | 11 | 18.6 | 7 | 15.2 |
| Type III: short/long latency | 7 | 11.9 | 0 | 0 |
| Inhibitory | 10 | 16.9 | 1 | 2.2 |
| Total | 59 | 46 | ||
In addition to differences in response patterns, response latencies were also significantly shorter for epiretinal vs. subretinal stimulation (Table 2). With epiretinal stimulation, 77% of responses exhibited delays shorter than 25 ms. However, only 48% of responses to subretinal stimulation exhibited similarly short delays (p = 0.0009, chi-square test odds ratio = 3.94). The significantly greater frequency of delayed responses also provides further evidence that subretinal stimulation is more effective at activating intraretinal circuits than epiretinal stimulation.
Table 2.
Distribution of responses according to time points of responses for epiretinal and subretinal.
| Latencies (ms) | Epiretinal
|
Subretinal
|
Total N | ||
|---|---|---|---|---|---|
| N | Col% | N | Col% | ||
| 0–25 | 37 | 77.1 | 35 | 48.6 | 72 |
| 25–100 | 5 | 10.4 | 9 | 12.5 | 14 |
| 101–200 | 4 | 8.3 | 8 | 11.1 | 12 |
| 201–500 | 2 | 4.2 | 20 | 27.8 | 22 |
To test whether short latency (<25 ms) responses were due to direct activation of RGCs, we blocked synaptic transmission with CdCl2 (100 μM). We tested 7 RGCs from 3 mouse retinas under these conditions: 2 displayed immediate responses only (Type I), 3 displayed delayed responses only (Type II), and 2 displayed both immediate and delayed response components (Type III). The 2 Type I cells maintained their responses even in the presence of Cd2+ (Fig. 5a). The responses of the 3 Type II cells were eliminated by Cd2+ (Fig. 5b). One of Type III cells lost both components of response and the other lost only the delayed response component in the presence of Cd2+. Consistent with earlier studies (Chen et al., 2006; Jensen, Ziv, & Rizzo, 2005; Margalit & Thoreson, 2006; Margalit et al., 2011), these experiments indicate that long latency responses required synaptic activity and short latency responses were largely, although not wholly, due to direct activation of RGCs.
Fig. 5.

Response of Type I and Type II cells after exposure to CdCl2. Type I responses were maintained even in the presence of Cd2+ (a). Type II responses were eliminated in the presence of Cd2+ (b).
The density of charge per electrode was held constant at 0.355 mC/cm2 and so charge threshold was calculated from the total charge. Charge threshold was therefore defined as the number of electrodes needed to evoke an RGC response at least 50% of the time. With the array placed in a subretinal position, spikes could sometimes be evoked by activation of only a single stimulating electrode (Fig. 6a). When the retina was placed on the array in an epiretinal configuration, we never observed activation of cells by single pixels but found that spikes could sometimes be evoked by 2 × 2 pixel array (Fig. 6b). Because stimulation was performed with square patterns of electrodes (1, 2 × 2, 3 × 3, etc.), the charge threshold categories were discrete in nature rather than continuous. Although single pixels were able to activate RGCs in the sub-retinal configuration and 2 × 2 arrays were the minimum size observed to activate cells in the epiretinal configuration, the overall sample showed no significant difference in the charge required to activate cells in the two configurations (Table 3, Fig. 7). We compared these data in a number of different ways. A cumulative proportional odds model yielded an ordinal odds ratio of 0.63, which did not differ significantly from the prediction that there was no difference between epiretinal and subretinal thresholds (i.e., where the odds ratio = 1.0; p = 0.21). An ordinal logistic regression model was also computed (similar to that calculated for response delays) and this model also showed no significant difference in charge threshold between epiretinal vs. subretinal stimulation (p = 0.24). In addition to comparisons between the overall sample of epiretinal vs. subretinal stimulation, we also found no significant differences (ANOVA, p = 0.37) when we compared charge thresholds for immediate (Type I) responses against delayed (Type II) responses during subretinal stimulation, immediate vs. delayed responses during epiretinal stimulation, epiretinal vs. subretinal stimulation for immediate responses alone, and epiretinal vs. subretinal stimulation for delayed responses alone (see all p values for unpaired t-tests in Table 3).
Fig. 6.

Stimulation of isolated retina with a charge density of 0.355 mC/cm2. (a) Response of an RGC to subretinal stimulation using a single pixel. (b) Response of a different RGC to epiretinal stimulation performed with a 2 × 2 pixel pattern. Arrows point to stimulus electrical artifacts.
Table 3.
Summary of average charge threshold for response types for subretinal and epiretinal stimulation. Table also lists t-test results.
| Response type | Subretinal
|
Epiretinal
|
||||
|---|---|---|---|---|---|---|
| N | Average Charge threshold (μC) | Standard error of mean | N | Average Charge threshold (μC) | Standard error of mean | |
| Excitatory | 25 | 0.0275 | 0.0042 | 23 | 0.0311 | 0.0037 |
| Delayed excitatory | 14 | 0.0374 | 0.0059 | 5 | 0.0405 | 0.0088 |
| t-Test results | p Value |
|---|---|
| For excitatory: epiretinal vs. subretinal | p = 0.53 |
| For delayed: epiretinal vs. subretinal | p = 0.79 |
| For subretinal: excitatory vs. delayed | p = 0.18 |
| For epiretinal: excitatory vs. delayed | p = 0.30 |
Fig. 7.

A diagram showing the proportions of RGC charge thresholds in sub- or epiretinal configurations.
We used the electrophysiological activity of RGCs evoked by electrical stimulation to map ERFs. ERFs were defined by the area on the surface of the chip that can successfully stimulate spikes in a given RGC. For example, we tested the responsiveness of the cell activated by subretinal stimulation in Fig. 6a to stimulation by individual pixels placed in different locations on the stimulation array. As described previously, we applied 10 stimulus pulses at each location. Locations that evoked responses in this RGC at least 50% of the time were considered to be within the ERF. The resulting ERF map is shown in Fig. 8. This figure also shows an ERF map measured in a similar way for the cell activated by epiretinal stimulation in Fig. 6b. In this case, the ERF was mapped by activating 2 × 2 arrays of pixels positioned at different locations across the array.
Fig. 8.
Corresponding electrical receptive fields for cells from Fig. 6.
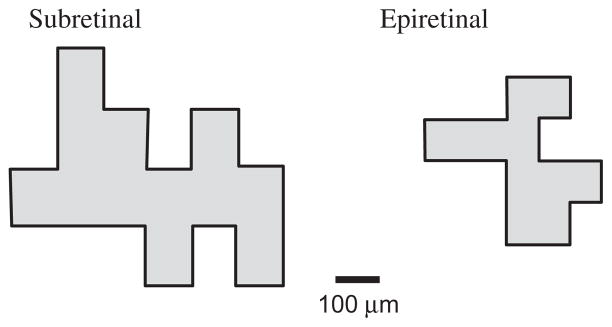
We mapped the sizes and shapes of ERFs using both epi-(n = 29) and sub- (n = 44) retinal array placements. We only included cells in which we mapped all of the boundaries of the receptive field, excluding cells in which the receptive field extended beyond the edge of the stimulating array. As illustrated by examples in Fig. 9, ERFs were sometimes simple rectangles or ellipsoids. However, most ERF showed more complex shapes. Complex ERF shapes were observed with both immediate and delayed responses evoked by either subretinal or epiretinal stimulation (Fig. 9). It is possible that the complex shape of ERFs may involve axonal stimulation. This possibility exists with any type of stimulation device. However, light-evoked RFs that do not involve axonal stimulation are not always simple ellipsoids and can have complex shapes similar to the ERFs shown in Fig. 9 (Brown, He, & Masland, 2000; Field et al., 2010; Gauthier et al., 2009). This suggests that using a high resolution stimulation array can reveal the complexities within RFs.
Fig. 9.
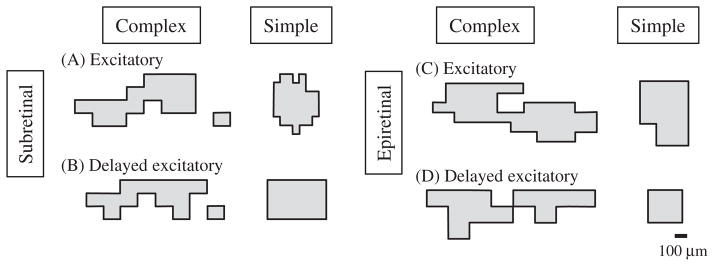
Complex and simple ERF shapes for subretinal and epiretinal stimulations.
For Type III cells that showed both immediate and delayed responses to stimulation, we found that, although they overlapped, ERFs for the two response components differed in their size and shape. We mapped the ERFs to both immediate and delayed responses for five Type III cells. An example of the different ERFs observed for the two components in shown for two cells in Fig. 10.
Fig. 10.

ERFs from two different Type III cells showing immediate (dark grey) and delayed (white) excitatory components mapped separately. In the combined maps at the right, regions with overlap between both response types are shown in light grey.
Differences in ERF size and shape are consistent with results of Cd2+ experiments indicating that immediate and delayed responses arise from different mechanisms: immediate responses are largely due to direct activation of RGC axons whereas delayed responses involve intraretinal circuits (Jensen, Ziv, & Rizzo, 2005; Margalit & Thoreson, 2006; Margalit et al., 2011; Suzuki et al., 2004).
The average sizes of ERFs obtained for short latency responses reflecting direct activation were smaller with subretinal than epiretinal stimulation. The bar graph in Fig. 11a shows that when we compared responses from all of the mapped cells, the average sizes of ERFs were significantly smaller with subretinal (0.22 ± 0.03 mm2, N = 44) than epiretinal (0.43 ± 0.08 mm2, N = 29) stimulation (p = 0.007, unpaired t-test). We observed a similar trend when we limited our comparison to short latency immediate responses evoked by epi- vs. subretinal stimulation but it did not attain statistical significance in this more limited sample (p = 0.068).
Fig. 11.

Comparing electrical receptive field (ERF) areas when subretinal vs. epiretinal stimulation are used. (a) When all mapped cells were included, ERFs mapped with subretinal stimuli (n = 44: immediate excitatory n = 25, delayed excitatory n = 14, inhibitory n = 5) were significantly smaller (p = 0.007, unpaired t-test) than those mapped with epiretinal stimuli (N = 29: immediate excitatory n = 23, delayed excitatory n = 5, inhibitory n = 1). Because immediate and delayed response components in Type III cells exhibited different ERF sizes and involve different mechanisms, we analyzed immediate and delayed ERFs from the five Type III cells independently. Comparing only immediate or delayed responses, the differences did not attain statistical significance (immediate, p = 0.068; delayed, p = 0.52). (b and c) Charge threshold was correlated with ERF area with both epiretinal (b), (Pearson correlation coefficient r = 0.42, p = 0.022) and subretinal (c), (Pearson r = 0.46, p = 0.0017) stimulation.
Larger currents spread further and are therefore more likely to activate more distant cells. Thus, as expected, we found that measurements of charge threshold were positively correlated with ERF area for both epiretinal and subretinal stimulation (Fig. 11b and c).
4. Discussion
In this study, we compared responses of RGCs evoked by subretinal and epiretinal electrical stimulation. Epiretinal stimulation with stimulating electrodes in close proximity to RGCs often evoked short latency spikes corresponding to Type I cells defined by Jensen and Rizzo (2008). Consistent with earlier studies (Chen et al., 2006; Jensen, Ziv, & Rizzo, 2005; Margalit & Thoreson, 2006; Margalit et al., 2011), experiments in which we blocked synaptic transmission with Cd2+ suggested that short latency responses were largely due to direct activation of RGCs whereas long latency responses involved intraretinal synaptic activity. In rabbit retina, application of 100 μM Cd2+ blocked directional selectivity in RGCs without completely abolishing light responses suggesting that amacrine cells may be more sensitive to Cd2+ than bipolar cells (Jensen, 1995). Thus, another possible explanation for our results is that short latency responses may involve activation by bipolar cells whereas longer latency responses are due to circuits involving amacrine cells.
Subretinal stimulation with stimulating electrodes positioned at the photoreceptor side of the retina evoked short latency responses less frequently than epiretinal stimulation and more often evoked responses with longer latencies. It has been reported that spikes can occur with submillisecond latencies following epiretinal stimulation (Sekirnjak et al., 2008); such extremely short latency responses would have been obscured by stimulation artifact, so the frequency of immediate responses should be viewed as a lower limit estimate of the true likelihood of observing short latency responses. Long latency responses evoked by subretinal stimulation were sometimes preceded by a burst of spikes immediately after stimulation (Type III cells), but in other cases were not (Type II cells). In addition, subretinal stimulation more often inhibited ongoing tonic spiking than epiretinal stimulation. Alongside these differences in response patterns, the latency to first spike was significantly shorter for epiretinal than subretinal stimulation. The longer latency to first spike and greater frequency of delayed and inhibitory responses evoked by subretinal stimulation suggest that this configuration is more effective than epiretinal stimulation at activating intraretinal circuits. A simple explanation for this result is that this arrangement promotes current passing through the retina. Since direct activation of RGCs is more likely to be useful than delayed bursts in restoring functional vision to individuals blinded by retinal degeneration, these results suggest that epiretinal placement may be preferable to subretinal placement of the array.
It is useful to consider charge density when discussing electrical stimulation, as this takes into account pulse amplitude, pulse duration, and electrode size (Margalit et al., 2002; Sekirnjak et al., 2006). Electrodes on the NRL stimulation array can deliver currents exceeding 10 μA for short periods, but recommended levels for sustained use are ≤3 μA per microelectrode. With the use of a single tungsten stimulating electrode with similar impedance characteristics to the NRL electrodes, a charge density of 11.7 μC/cm2 was sufficient to evoke spikes in ganglion cells of a flatmount mouse retina (Margalit et al., 2011). Other studies showed similar results (Margalit et al., 2011; Stett et al., 2000). Activation of RGCs in rd mice or P23H rats with retinal degeneration required similar or slightly greater charge levels (Margalit et al., 2011; Sekirnjak et al., 2009). Individual microelectrodes on the NRL chip can deliver 3 μA of current through a surface area of 600 μm2 indicating that a single pixel can deliver a charge density of 0.5 μC/cm2, well above that needed to activate RGCs in both wild type and rd mice. Consistent with previous evidence that levels of 1 μA per pixel are capable of stimulating RGCs with subretinal placement of the NRL array on an isolated retina (Jensen et al., 2009), we found that activation of a single pixel with 0.355 mC/cm2 produced robust activation of RGCs. In other experiments using whole cell recording techniques, we found that the thresholds for spikes evoked by stimuli of 1–10 ms duration increased with the square of the distance between the stimulating electrode and the target cell (unpublished observations). This was true for both short latency spikes involving direct activation of RGCs and longer latency spikes involving synaptic activity. Sekirnjak et al. (2008) found that individual RGCs can sometimes be activated by a single nearby stimulating electrode without activating neighboring cells. Together with the finding that activation of a single pixel could stimulate robust spiking in RGCs, the increase in threshold as a function of distance supports the possibility that the NRL high-resolution electrode array with an electrode–electrode distance of 30–56 μm chip may also be capable of activating different cells using different electrodes. Conversely, increasing the current at a single electrode will increase the likelihood that additional nearby RGCs might be activated and that increasing current strength will expand the size of the ERF for individual RGCs. Changes in stimulation current amplitude may thus be used to manipulate the ERF size.
We used the electrophysiological activity of RGCs to map ERFs, i.e., the area on the surface of the stimulating array that can successfully stimulate spikes in a given RGC. It has been proposed that RGCs with larger dendritic fields may occupy a larger portion of the electric field generated by the pulse and so lower thresholds might be expected in cells with larger dendritic fields. However, no correlation was found between stimulation threshold and either electrical image size or receptive field size, two parameters that are presumably related to dendritic field diameter (Tsai et al., 2009). Consistent with these results, we found higher, not lower, charge thresholds were correlated with larger electrical receptive field size. This correlation is presumably due to the fact that generating more charge by activating more electrodes on the array allowed charge to spread further and activate cells at a greater distance. It has also been proposed that synaptic activation can influence threshold (Margalit & Thoreson, 2006; Margalit et al., 2011). We found no significant overall difference in the threshold charge required to activate RGCs in sub- vs. epiretinal configurations. However, we observed smaller electrical receptive fields during subretinal stimulation compared to epiretinal stimulation. While this could partly reflect an influence of retinal circuits in sharpening the electrical receptive fields (Gauthier et al., 2009), it is also likely to involve differences in the distance between stimulating electrodes and recorded RGCs in the two configurations. The interposed retina separates the RGCs from the stimulating electrodes during subretinal placement and so less charge reaches distant RGCs. By contrast, in the epiretinal configuration, stimulating electrodes are closer to RGCs, and thus, activation of pixels at some distance from an RGC on the surface of the array can still deliver sufficient charge to evoke a spike, resulting in larger ERFs given the same current levels. Because bipolar cell terminals and amacrine cell processes in the inner plexiform layer are closer to the epiretinal surface, similar considerations suggest that slower, synaptically-mediated responses might also exhibit larger ERFs in the epiretinal configuration. However, we saw only small and statistically insignificant differences when we limited our comparison to delayed responses type RGCs.
When we examined Type III cells that exhibited both delayed and immediate responses, we found that the ERFs for the two response components differed in size and shape, although they overlapped with one another. This is consistent with different sites and mechanisms generating the two response components in the same cell: direct activation of RGC axons during immediate responses and activation of amacrine and bipolar cells during delayed responses.
Because of the high resolution NRL device, we were able to control the stimulation at the individual electrode level. This allowed us to reveal complexities within the receptive fields. We frequently found ERFs with complex non-ellipsoid shapes for both epiretinal and subretinal stimulation. Receptive fields mapped by light also show complex structural features including non-ellipsoid shapes and sub-domains of higher and lower sensitivity (Brown, He, & Masland, 2000; Field et al., 2010). Direct side-by-side comparison of light- and electrically-evoked receptive fields are needed to determine whether the complexities in ERF structure arise from the same mechanisms that generate complexities in light-evoked receptive fields or whether they reflect distinct electrical properties of RGCs, such as activation of axonal or dendritic ion channels.
Acknowledgments
This work was done through the VA Nebraska-Western Iowa Health Care System and is based upon work supported by the Department of Veterans Affairs, Veterans Health Administration, Office of Research and Development, Rehabilitation Research and Development Service.
This study was supported by a Department of Veterans Affairs Merit Review Grant #C6583R, unrestricted Grant from Research to Prevent Blindness, USA, Nebraska Research Initiative, Nebraska, USA, and National Eye Institute Grant EY10542, USA.
References
- Brown SP, He S, Masland RH. Receptive field microstructure and dendritic geometry of retinal ganglion cells. Neuron. 2000;27:371–383. doi: 10.1016/s0896-6273(00)00044-1. [DOI] [PubMed] [Google Scholar]
- Bunker CH, Berson EL, Bromley WC, Hayes RP, Roderick TH. Prevalence of retinitis pigmentosa in Maine. American Journal of Ophthalmology. 1984;97:357–365. doi: 10.1016/0002-9394(84)90636-6. [DOI] [PubMed] [Google Scholar]
- Chader GJ, Weiland J, Humayun MS. Artificial vision: Needs, functioning, and testing of retinal electronic prosthesis. Progress in Brain Research. 2009;175:317–332. doi: 10.1016/S0079-6123(09)17522-2. [DOI] [PubMed] [Google Scholar]
- Chen SJ, Mahadevappa M, Roizenblatt R, Weiland J, Humayun M. Neural responses elicited by electrical stimulation of the retina. Transactions of the American Ophthalmological Society. 2006;104:252–259. [PMC free article] [PubMed] [Google Scholar]
- Eickenscheidt M, Jenkner M, Thewes R, Fromherz P, Zeck G. Electrical stimulation of retinal neurons in epiretinal and subretinal configuration using a multicapacitor array. Journal of Neurophysiology. 2012;107:2742–2755. doi: 10.1152/jn.00909.2011. [DOI] [PubMed] [Google Scholar]
- Fernandes RA, Diniz B, Ribeiro R, Humayun M. Artificial vision through neuronal stimulation. Neuroscience Letters. 2012;519:122–128. doi: 10.1016/j.neulet.2012.01.063. [DOI] [PubMed] [Google Scholar]
- Field GD, Gauthier JL, Sher A, Greschner M, Mchado T, Jepson LH, et al. Functional connectivity in the retina at the resolution of photoreceptors. Nature. 2010;467:673–677. doi: 10.1038/nature09424. [DOI] [PMC free article] [PubMed] [Google Scholar]
- Fried SI, Hsueh HA, Werblin FS. A method for generating precise temporal patterns of retinal spiking using prosthetic stimulation. Journal of Neurophysiology. 2006;95:970–978. [Google Scholar]
- Gauthier JL, Field GD, Sher A, Greschner M, Shlens J, Litke AM, et al. Receptive fields in primate retina are coordinated to sample visual space more uniformly. PLoS Biology. 2009;7:e1000063. doi: 10.1371/journal.pbio.1000063. [DOI] [PMC free article] [PubMed] [Google Scholar]
- Humayun MS, de Juan EJ, Weiland JD, Dagnelie G, Katona S, Greenberg RJ, et al. Pattern electrical stimulation of the human retina. Vision Research. 1999;39:2569–2576. doi: 10.1016/s0042-6989(99)00052-8. [DOI] [PubMed] [Google Scholar]
- Humayun MS, Dorn JD, da Cruz L, Dagnelie G, Sahel JA, Stanga PE, et al. Interim results from the international trial of second Sight’s visual prosthesis. Ophthalmology. 2012;119:779–788. doi: 10.1016/j.ophtha.2011.09.028. [DOI] [PMC free article] [PubMed] [Google Scholar]
- Humayun MS, Prince M, de Juan EJ, Barron Y, Moskowitz M, Klock IB, et al. Morphometric analysis of the extramacular retina from postmortem eyes with retinitis pigmentosa. Investigative Ophthalmology and Visual Science. 1999;40:143–148. [PubMed] [Google Scholar]
- Jensen RJ. Effects of Ca2+ channel blockers on directional selectivity of rabbit retinal ganglion cells. Journal of Neurophysiology. 1995;74:12–23. doi: 10.1152/jn.1995.74.1.12. [DOI] [PubMed] [Google Scholar]
- Jensen RJ, Rizzo JF. Activation of retinal ganglion cells in wild-type and rd1 mice through electrical stimulation of the retinal neural network. Vision Research. 2008;48:1562–1568. doi: 10.1016/j.visres.2008.04.016. [DOI] [PubMed] [Google Scholar]
- Jensen RJ, Ziv OR, Rizzo JF. Responses of rabbit retinal ganglion cells to electrical stimulation with an epiretinal electrode. Journal of Neural Engineering. 2005;2:S16–S21. doi: 10.1088/1741-2560/2/1/003. [DOI] [PubMed] [Google Scholar]
- Jensen RJ, Ziv OR, Rizzo JF, Scribner D, Johnson L. Spatiotemporal aspects of pulsed electrical stimuli on the responses of rabbit retinal ganglion cells. Experimental Eye Research. 2009;89:972–979. doi: 10.1016/j.exer.2009.08.015. [DOI] [PubMed] [Google Scholar]
- Johnson L, Perkins FK, O’Hearn T, Skeath P, Merritt C, Frieble J, et al. Electrical stimulation of isolated retina with microwire glass electrodes. Journal of Neuroscience Methods. 2004;137:265–273. doi: 10.1016/j.jneumeth.2004.02.035. [DOI] [PubMed] [Google Scholar]
- Johnson L, Scribner D, Skeath P, Klein R, Ilg D, Perkins K, et al. Impedance-based retinal contact imaging as an aid for the placement of high resolution epiretinal prostheses. Journal of Neural Engineering. 2007;4:S17–S23. doi: 10.1088/1741-2560/4/1/S03. [DOI] [PubMed] [Google Scholar]
- Kim SY, Sadda S, Pearlman J, Humayun MS, de Juan E, Jr, Melia BM, et al. Morphometric analysis of the macula in eyes with disciform age-related macular degeneration. Retina. 2002;22:471–477. doi: 10.1097/00006982-200208000-00012. [DOI] [PubMed] [Google Scholar]
- Margalit E, Babai N, Luo J, Thoreson WB. Physiology of retinal electrical stimulation in normal and rd mice. Visual Neuroscience. 2011;28:145–154. doi: 10.1017/S0952523810000489. [DOI] [PMC free article] [PubMed] [Google Scholar]
- Margalit E, Maia M, Weiland JD, Greenberg RJ, Fujii GY, Torres G, et al. Retinal prosthesis for the blind. Survey of Ophthalmology. 2002;47:335–356. doi: 10.1016/s0039-6257(02)00311-9. [DOI] [PubMed] [Google Scholar]
- Margalit E, Thoreson WB. Inner retinal mechanisms engaged by retinal electrical stimulation. Investigative Ophthalmology and Visual Science. 2006;47:2606–2612. doi: 10.1167/iovs.05-1093. [DOI] [PMC free article] [PubMed] [Google Scholar]
- Santos A, Humayun MS, de Juan EJ, Greenburg RJ, Marsh MJ, Klock IB, et al. Preservation of the inner retina in retinitis pigmentosa. A morphometric analysis. Archives of Ophthalmology. 1997;115:511–515. doi: 10.1001/archopht.1997.01100150513011. [DOI] [PubMed] [Google Scholar]
- Scribner D, Margalit E, Au Eong K, Weiland J, de Juan EJ, Humayun M. Intraocular retinal prostheses and related signal processing. In: Hung K, Ciuffreda K, editors. Models of the visual system. New York: Kluwer Academic/Plenum Publishers; 2002. pp. 147–190. [Google Scholar]
- Sekirnjak C, Hottowy P, Sher A, Dabrowski W, Litke AM, Chichilnisky EJ. Electrical stimulation of mammalian retinal ganglion cells with multielectrode arrays. Journal of Neurophysiology. 2006;95:3311–3327. doi: 10.1152/jn.01168.2005. [DOI] [PubMed] [Google Scholar]
- Sekirnjak C, Hottowy P, Sher A, Dabrowski W, Litke AM, Chichilnisky EJ. High-resolution electrical stimulation of primate retina for epiretinal implant design. Journal of Neuroscience. 2008;28:4446–4456. doi: 10.1523/JNEUROSCI.5138-07.2008. [DOI] [PMC free article] [PubMed] [Google Scholar]
- Sekirnjak C, Hulse C, Jepson LH, Hottowy P, Sher A, Dabrowski W, et al. Loss of responses to visual but not electrical stimulation in ganglion cells of rats with severe photoreceptor degeneration. Journal of Neurophysiology. 2009;102:3260–3269. doi: 10.1152/jn.00663.2009. [DOI] [PMC free article] [PubMed] [Google Scholar]
- Shah HA, Montezuma SR, Rizzo JF. In vivo electrical stimulation of rabbit retina: Effect of stimulus duration and electrical field orientation. Experimental Eye Research. 2006;83:247–254. doi: 10.1016/j.exer.2005.11.023. [DOI] [PubMed] [Google Scholar]
- Stett A, Barth W, Weiss S, Haemmerle H, Zrenner E. Electrical multisite stimulation of the isolated chicken retina. Vision Research. 2000;40:1785–1795. doi: 10.1016/s0042-6989(00)00005-5. [DOI] [PubMed] [Google Scholar]
- Stett A, Mai A, Herrmann T. Retinal charge sensitivity and spatial discrimination obtainable by subretinal implants: Key lessons learned from isolated chicken retina. Journal of Neural Engineering. 2007;4:S7–S16. doi: 10.1088/1741-2560/4/1/S02. [DOI] [PubMed] [Google Scholar]
- Stingl K, Bartz-Schmidt KU, Besch D, Braun A, Bruckmann A, Gekeler F, et al. Artificial vision with wirelessly powered subretinal electronic implant alpha-IMS. Proceedings of the Royal Society: Biological Science. 2013;280:1757. doi: 10.1098/rspb.2013.0077. [DOI] [PMC free article] [PubMed] [Google Scholar]
- Stone JL, Barlow WE, Humayun MS, de Juan EJ, Milam AH. Morphometric analysis of macular photoreceptors and ganglion cells in retinas with retinitis pigmentosa. Archives of Ophthalmology. 1992;110:1634–1639. doi: 10.1001/archopht.1992.01080230134038. [DOI] [PubMed] [Google Scholar]
- Suzuki S, Humayun MS, Weiland JD, Chen SJ, Margalit E, Piyathaisere DV, et al. Comparison of electrical stimulation thresholds in normal and retinal degenerated mouse retina. Japanese Journal of Ophthalmology. 2004;48:345–349. doi: 10.1007/s10384-004-0084-9. [DOI] [PubMed] [Google Scholar]
- Tsai D, Morley JW, Suaning GJ, Lovell NH. Direct activation of retinal ganglion cells with subretinal stimulation. Conference Proceedings: Annual International Conference of the IEEE Engineering in Medicine and Biology Society. 2009;2009:618–621. doi: 10.1109/IEMBS.2009.5333494. [DOI] [PubMed] [Google Scholar]
- Zrenner E, Stett A, Weiss S, Aramant RB, Guenther E, Kohler K, et al. Can subretinal microphotodiodes successfully replace degenerated photoreceptors? Vision Research. 1999;39:2555–2567. doi: 10.1016/s0042-6989(98)00312-5. [DOI] [PubMed] [Google Scholar]