Abstract
Background
Manoscan™ is one of the commonly used high-resolution manometry (HRM) systems with declared measurement accuracy of 1-2 mmHg. However, the accuracy of pressure measurements is limited by development of pressure drift (PD) throughout recording. To date, there has been no systematic investigation to identify the factors contributing to PD.
AIM
To characterize the frequency and magnitude of PD in Manoscan™ system and identify the factors contributing to PD.
Methods
Records of 560 consecutive clinical esophageal HRM studies recorded by six distinct HRM catheters were retrospectively reviewed. PD was defined as the residual pressure measurement by each sensor immediately after removal of the catheter. Nonparametric locally weighted regression analysis was performed to assess the effect of duration of study, number of prior uses of a catheter, peak and average pressure exposure during a study on the PD.
Results
The majority (95%) of clinical manometry studies showed a non-negligible PD of more than 5 mmHg. The overall PD was 13 ± 5 mmHg and the sensor with greatest amount of PD showed 23 ± 12 mmHg of drift. The upper esophageal sphincter showed the highest PD. Average pressure exposure of a sensor throughout the recording was the most important predictor of PD. PD inversely correlated with number of prior uses of a catheter.
Conclusion
The PD preferentially affects esophageal high-pressure zones, and strongly correlates with “average pressure exposure” of a sensor during manometry. Available algorithms of the analysis software do not adequately correct the PD.
Keywords: thermal compensation, hysteresis, esophageal manometry, pressure topography
Introduction
Esophageal high-resolution manometry (HRM) is utilized as the gold standard diagnostic tool for clinical assessment of esophageal motor disorders (1). The Manoscan™ is one of the commonly used esophageal HRM systems with declared pressure accuracy within 1-2 mmHg (2-5). However, the Manoscan™ system has a limitation in showing propensity to develop pressure drift (PD) (6). PD is generally attributed to the change in temperature during in-vivo recordings, and the manufacturer provides a corrective algorithm called “thermal compensation” in the analysis software package to be applied at the time of study interpretation (7). Nonetheless, inaccuracy of the measured pressure is often suspected when physiologically implausible negative or positive pressure bands are encountered throughout some manometric studies.
Recently an in-vitro study utilizing Manoscan ™ system described a significant ‘baseline pressure drift’ that increased linearly over time, and authors suggested that duration of pressure recording likely played an important role in development of PD (6). However, this study evaluated PD after two hours of recording in a warm water bath without any pressure application, which is inconsistent with what catheters are exposed in the clinical practice. It is known that solid-state pressure sensors are delicate and need gentle handling during nasopharyngeal placement of the manometry catheter. Therefore some investigators suspect inadvertent manual squeeze of pressure sensors by operator (and resultant extreme pressure exposure of sensor) during catheter placement may contribute to the observed PD at the end of study. Additionally one may suspect that excessive catheter use can decrease accuracy of pressure measurement due to “wear and tear” effect on the pressure sensors. We have observed that UES and LES high-pressure zones frequently depict higher PD than other regions of pressure recording. Since duration and temperature which sensors record pressure in are similar during a clinical study, we wondered if variable PD could be related to other factors such as topographic region of a recording sensor or magnitude of pressure exposure throughout a given study.
To date, there has been no systematic investigation to address the possible factors contributing to the observed PD during clinical esophageal HRM studies. Our aim in the present study was to characterize the rate, distribution and magnitude of PD and identify the factors contributing to PD. We hypothesized that PD may be affected by factors related to the manometric study (duration of manometry), individual catheter utilized for study (distinct identification number of a catheter and cumulative number of prior manometric uses of a catheter), and sensor (topographic region of pressure recording and pressure exposure parameters of a sensor during the study).
Methods
Approach
Records of 560 consecutive clinical esophageal high-resolution manometry (HRM) studies performed at a tertiary referral center between July 2011-June 2013 were retrospectively reviewed. HRM studies were performed using the Manoscan 360 ™ system and high-resolution combined manometry-impedance catheters. All catheters were within the two-year warranty period with less than 200 uses, and were maintained according to the manufacturer's guidelines. Recommended maintenance processes including in-vivo calibration and tune up, were regularly performed at the end of each working week. Pressure recording initiated after a successful system calibration (0mmHg-300mmHg) prior to each clinical manometry study. The manometry system was operated by a single trained registered nurse with more than 5 years of experience in esophageal manometry. Studies were conducted by six distinct high-resolution manometry-impedance catheters (EAZ367, EAZ405, EAZ633, EAZ685, EAZ799, EAZ906 and EAZ934). All studies were conducted without the disposable sanitary sheath to allow concurrent impedance recording.
Esophageal Manometry Protocol
All patients underwent 6 hours of fasting prior to the procedure. After topical lidocaine application, the solid-state high-resolution manometry-impedance catheter (Given Imaging ®, Los Angeles, CA) was introduced transnasally. Our standard protocol includes 10 wet and 10 viscous swallows in the supine position followed by 5 wet, 5 viscous, 5 dry and 250 ml rapid water swallows in the upright position. Immediately after removal of the HRM catheter from esophagus, the operator suspended the catheter at bedside without any finger indentation prior to terminating the manometric recording.
Data Collection
All esophageal HRM studies were examined to determine if the HRM catheter removal from the esophagus at the end of study was included in the recording. Twenty-four incomplete studies that did not include the catheter removal were excluded from analysis. In most of these studies the patient did not tolerate nasopharyngeal intubation, and manometry was terminated early without interpretable pressure recording. For the remainder of the 536 studies, PD was defined as the residual pressure measurement immediately after removal of the catheter that theoretically should equal atmospheric pressure of zero (Figure 1). This is the point of time where “thermal compensation” correction in analysis software is applied based on the user guide published by manufacturer (2, 7). The interpreting physician identifies the time immediately after removal of the catheter at the end of study, and software subtracts the measured instantaneous pressure of each sensor uniformly from the entire in-vivo recording of that sensor as artifact (Figure 1). Based on this principle, the time and residual pressure of all 36 pressure sensors immediately (less than one second) after catheter removal were saved as an ASCII file and exported to external analysis software program. The entire recorded pressure dataset for each manometry study was also exported as an ASCII file. Each column of data in the exported file corresponds to the time series of recorded pressure from distinct identifiable sensors labeled individually as 1-36 (not interpolated data).
Figure 1. Measurement of pressure drift (PD) and duration of study immediately after removal of the manometry catheter.
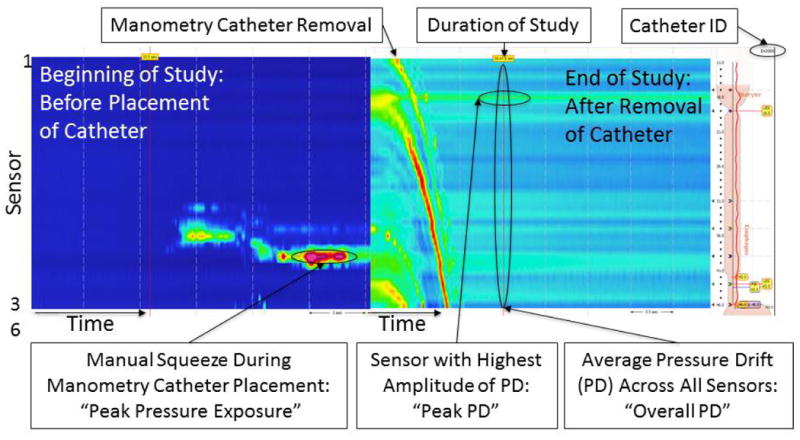
Representative color contour plots during placement and removal of manometry catheter. Catheter removal is easily recognizable at the end of study by a distinct topographic appearance similar to a “waterfall”. “Overall PD” was defined as the average residual pressure across all 36 sensors immediately (<1 second) after removal of manometry catheter. “Peak PD” was the sensor with highest amount of PD among 36 recording sensors of a study. Manual squeeze of manometry catheter at the beginning of study is often recognized by a characteristic extreme pressure measurement of few sensors while other sensors measure ambient atmospheric pressure of zero. Unique identifier of the manometry catheter of each study is embedded in the right upper corner of the analysis window.
The sensors were assigned into five topographic regions based on a 20 mmHg isobaric color contour plot: 1) pharynx (sensor 1 to the sensor above the upper border of UES; 2) UES (upper border of UES to lower border of UES); 3) esophagus (sensor below the lower border of UES to sensor above the upper border of LES); 4) LES (upper border of LES to lower border of LES); and 5) stomach (sensor below the lower border of the LES to sensor 36). The distinct HRM catheter identifier of each study that is embedded in the upper right hand corner of Manoview ™ profile window was recorded (Figure 1). Manometric studies were organized in chronological order and since manometic catheters were identifiable, we could easily calculate the cumulative number of prior catheter uses for each study.
Statistical Analysis
All data are presented as mean ± standard deviation. Custom written C software extracted the data including the mean and maximum pressure that each sensor was exposed during study from ASCII format manometry files. Statistical analyses were performed using SAS 9.3 (SAS Institute, Cary, NC) and results were corrected for multiple comparisons. The “overall PD” was quantified as the average PD of all sensors for each study, and the sensor with the highest amount of PD at the end of study was identified as “peak PD”. Topographic location of “peak PD” for each study was recorded. Nonparametric locally weighted regression analysis (Loess) was performed to assess the effect of duration of study, number of prior uses of a catheter, peak pressure and average pressure exposure of catheter during a study on the overall PD. Based on the Loess curves, average pressure exposure was log-transformed in the model. The combined effects were quantified via a linear model. Analysis of variance was performed to compare overall PD between distinct HRM catheters and various topographic regions of pressure recording.
Subsequently a more detailed, sensor-level analysis of PD was performed. All influential parameters were included in a mixed-effects model to determine the contribution to each measured PD of the fixed effects of number of prior catheter usages, duration of the manometric study, topographic location of the sensor (pharynx, UES, esophagus, LES, stomach), mean and maximum pressure exposure of the sensor, as well as random effects of subjects, individual catheters and sensors with an auto-regressive error structure to account for correlations between adjacent sensors (AR1). Based on the Loess curves, mean pressure exposure was log-transformed in the model.
“Thermal compenssation” corrective algorithm subtracts PD measurement of each sensor at the end of study from the entire in-vivo recording of that sensor. The accuracy of this approach relies on development of PD early in the recording, and maintaining a constant value throughout the study thereafter (within ± 2 mmHg of the measured PD at the end of study). The first sensor was chosen for the analysis of the trends in PD throughout the recording because the first sensor was always located in the pharynx, consistently recording in a compartment in equilibrium with atmospheric pressure. Unfortunately one cannot exactly measure changes of the baseline pressure in other compartments (UES, LES, esophagus and stomach) since they are not stable and fluctuate throughout recording. Plotting the baseline pressure changes of first sensor over time should give a reasonable estimate of trend in PD development and accuracy of “thermal compensation” algorithm in correcting the drift. One may safely assume that baseline pressure changes of first sensor throughout study closely represent the fluctuations of PD at least in pharynx (if more than ± 2 mmHg different from zero). The first sensor's pressure values measured every 1 second were extracted from all studies using a custom written software. Swallow related pharyngeal pressure changes were filtered out using a median value of a 25 second symmetric window.
Results
Manometric studies lasted 35 ± 14 minutes. Negative overall PD measurement was present only in twelve studies (2%). Majority of manometric studies (95%) showed a PD of more than 5 mmHg, which exceeded the reported accuracy of 1-2 mmHg for the system. The overall PD (average drift across all sensors) was 13 ± 5 mmHg, and the sensor with greatest amount of PD (peak PD) showed 23 ± 12 mmHg of drift. The frequency histograms showing duration of manometric studies, number of HRM catheter uses prior to each manometric study of interest, overall and peak PD of a manometric study are presented in Supplementary Figure 1A-D (n=536).
The topographic length of pharynx, UES, esophagus, LES and stomach were 4.5 ± 2 cm, 3.0 ± 1 cm, 20.5 ± 3 cm, 3.5 ± 1 cm and 4.5 ± 2.5 cm respectively. The peak PD sensors were located in the UES high-pressure zone 45% of the times (Example in Figure 1) and in the LES high-pressure zone 19% of the times. The pharynx showed the lowest PD amongst topographic regions of pressure recording and was significantly different from all other regions (p<0.0001, Figure 2A). UES showed the highest PD amongst topographic regions of pressure recording and was significantly different from all other regions (p<0.0001, Figure 2A). LES and stomach showed statistically similar PD, though significantly higher than esophageal PD (p<0.01).
Figure 2. Effect of topographic region of pressure recording and distinct manometry catheters on pressure drift (PD).
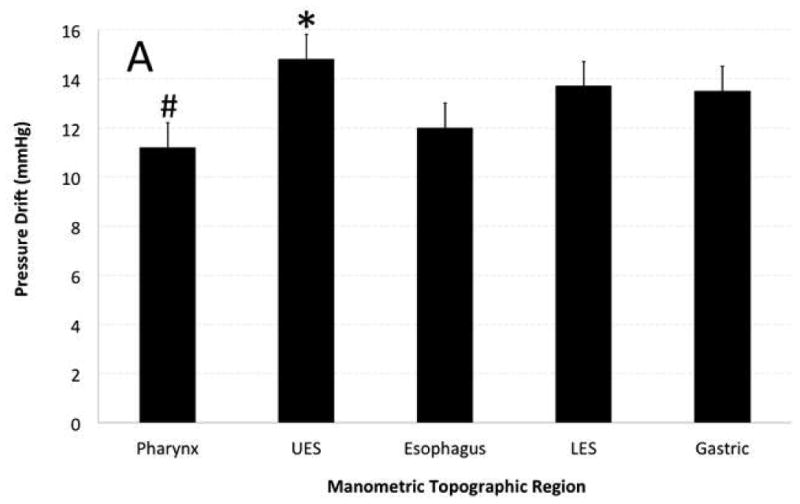
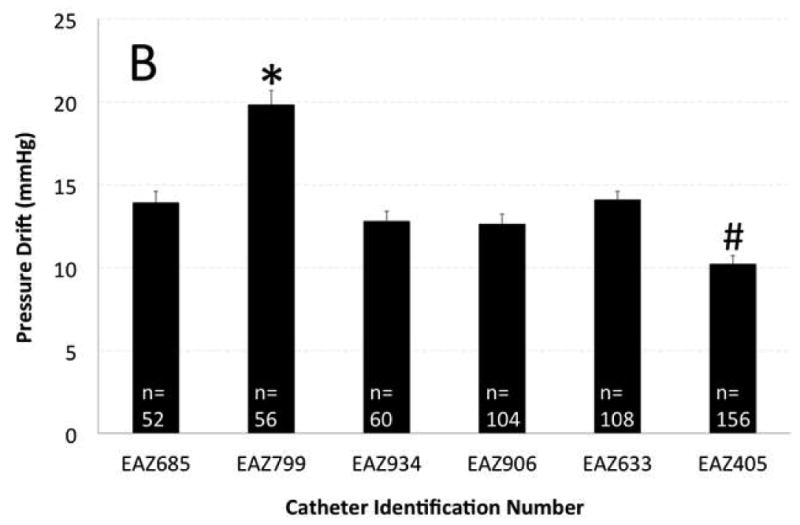
A) Topographic region of pressure recording showed significant effect on PD. UES showed highest and pharynx showed lowest amount of PD that was statistically different from other topographic regions. B) Catheter EAZ799 showed highest and catheter EAZ405 showed lowest PD than remainder of manometry catheters. Catheter EAZ 405 had the most clinical manometry use and EAZ799 was one of the less utilized manometry catheters.
The manometry catheter with highest clinical use showed the lowest overall PD amongst catheters whereas one of the manometry catheters with least clinical use showed significantly higher PD than others (p<0.0001, Figure 2B). Although four manometry catheters showed a comparable PD irrespective of their history of use, studies performed by catheters with history of more clinical use (>100 prior studies), showed smaller overall PD compared to less-used (<100 prior studies) catheters (p<0.05).
We correlated overall PD (average of all sensors) with duration and peak pressure exposure in a manometric study. PD showed statistically significant correlation with longer duration and peak pressure exposure during study but the observation confirmed only a modest effect (Figure 3A-B). However, increased number of prior uses of a catheter correlated inversely and substantially with observed overall PD (R2=25.5%, Figure 3C). Most importantly average pressure exposure of all sensors throughout a manometric study showed the strongest correlation with overall PD (R2 =58.7%, Figure 3D).
Figure 3. Correlation of overall pressure drift to duration of manometry study (A), peak pressure exposure of catheter (B), number of catheter uses (C) and average pressure exposure of catheter during manometry (D).
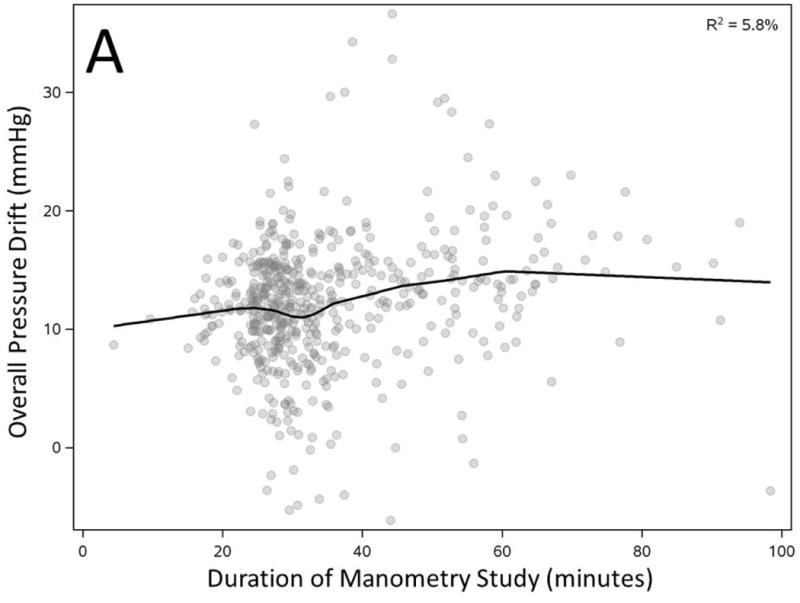
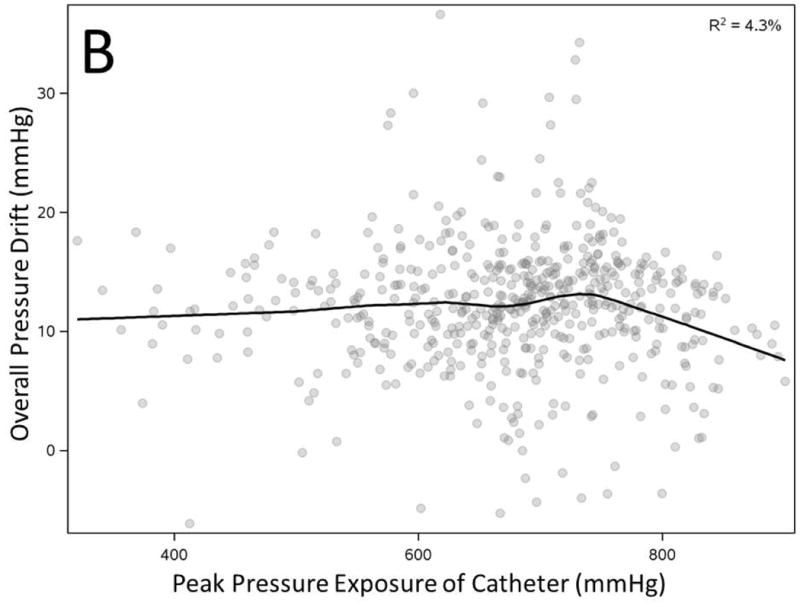
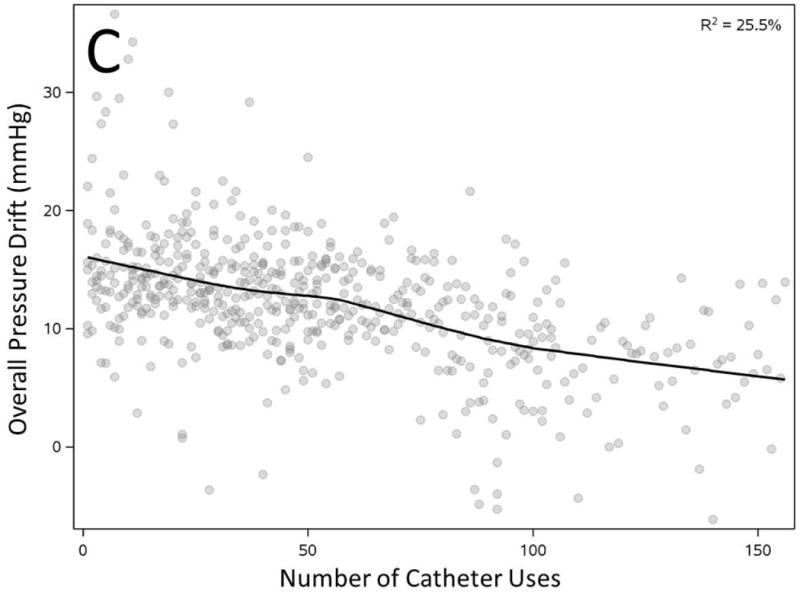
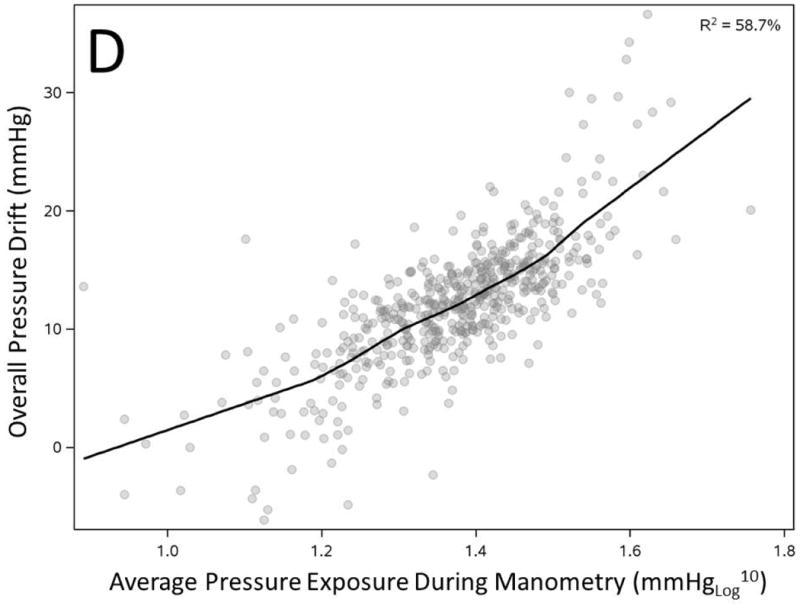
All factors showed statistically significant correlation with overall pressure drift (n=536, p<0.0001)
We then correlated the PD of each individual sensor with all of the above parameters. At the sensor level (536 × 36= 19296), average pressure exposure of a sensor throughout the study (R2 =35.3%, Supplementary Figure 2A), number of prior catheter uses (R2=15%, Supplementary Figure 2B), duration of study (R2 =3.8%, Supplementary Figure 2C), the topographic region the sensor was recording (R2 =3.2%, Supplementary Figure 2D) and peak pressure exposure of a sensor during a manometric study (R2 =1.5%, Supplementary Figure 2E) appeared to remain significant factors in determination of the PD (p <0.0001). All parameters then were evaluated in a mixed effect model to account for the interaction of various parameters and auto-correlation between adjacent sensors. Adjacent sensors during each study showed significant auto-correlation (r = 0.27, p <0.001). The average pressure exposure, number of prior catheter uses, topographic region and duration of study remained highly statistically significant, but peak pressure exposure of a sensor did not have any statistically significant effect in the multivariate model (Table -1). Average pressure exposure of a sensor was the most important predictor of PD. Each 10-fold increase in average pressure exposure (1 mmHg to 10 mmHg, or 10 mmHg to 100 mmHg) increased the PD by 13.1 ± 0.2 mmHg. Every 10 extra uses of the catheter reduced the PD by 0.43 ± 0.1 mmHg, while an additional 10 minutes of pressure recording increased the PD by 0.47 ± 0.1 mmHg.
Table-1.
| Predictor | Estimated Effect | Standard Error | P-Value |
|---|---|---|---|
| Average Pressure Exposure, log10 (mmHg) | 13.11 | 0.20 | < 0.0001 |
| Number of Catheter usages, 10 uses | -0.43 | 0.05 | < 0.0001 |
| Duration, 10 minutes | 0.47 | 0.11 | < 0.0001 |
| Topographic Region | |||
| Upper Esophageal Sphincter | − 2.18 | 0.17 | < 0.0001 |
| Lower Esophageal Sphincter | − 1.52 | 0.25 | < 0.0001 |
| Gastric | − 0.94 | 0.21 | < 0.002 |
| Esophagus | − 0.87 | 0.28 | < 0.0001 |
| Peak Pressure Exposure, 10 mmHg | − 0.00 | 0.00 | 0.28 |
We plotted the baseline pressure changes of first sensor over time to estimate the trend of PD development (swallow related changes were filtered out), and investigate accuracy of “thermal compensation” that assumes a constant linear PD for the entire study. The average baseline pressure of all first sensors of 536 studies increased in the initial 30-60s of recording and leveled around 12 mmHg for the remainder of recording (Figure 4A). However, careful analysis of the individual pressure tracings revealed a more nuanced pattern. The filtered baseline pressure remained within ± 2 mmHg of the final PD for only 60% of the time (11,181/18,760 minutes of total pressure recording). Only 113/536 of clinical manometry studies had the filtered baseline pressure measurements within ± 2 mmHg of the final measured PD for 90% of the recording time (Figure 4B).
Figure 4. Baseline pressure changes of the first pharyngeal sensor represent development of pressure drift trend throughout a manometry study.
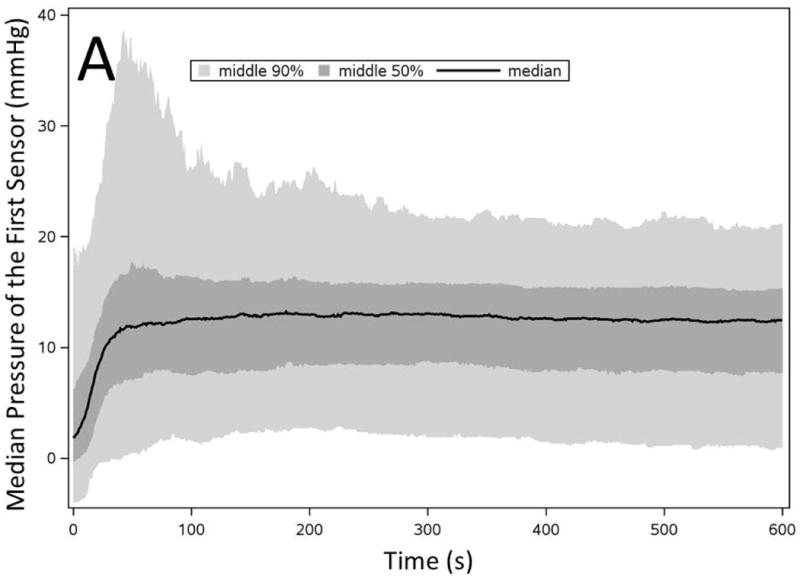
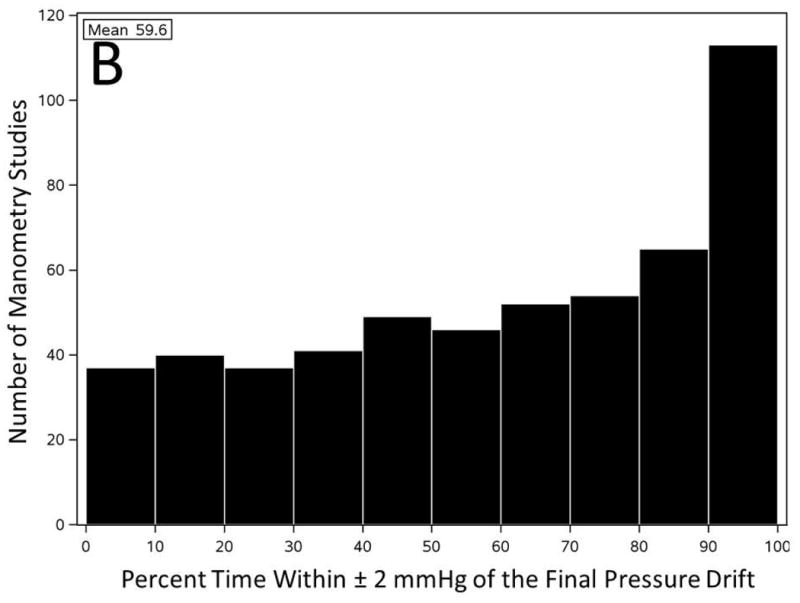
A) Filtered baseline pressure measurement of the first pharyngeal sensor throughout initial 600 seconds of all pressure recordings (n=536). B) Number of manometry studies categorized based on the percentage of time that first pharyngeal baseline pressure remained within ± 2 mmHg of the final PD throughout the entire recording.
Discussion
A non-negligible pressure drift (PD) at then end of manometry recording limits the accuracy of pressure measurement by Manoscan™ system. PD in the majority of manometric studies is more than 10 mmHg, and occasionally may even exceed 50 mmHg in the sensor with the greatest amount of PD. Average pressure exposure of a sensor during manometry is the most important factor in predicting the PD at the end of study. Since the sensors that record pressure in the sphincteric high-pressure zones are exposed to higher pressure, UES and LES are more prone to demonstrate PD. Duration of study and peak pressure exposure of a sensor throughout manometry may explain a small portion of the PD, although generally these are not the determining factors. “Thermal compensation” corrective algorithm offered in the analysis software is accurate within ± 2 mmHg only 60% of the time for pharyngeal sensors.
Esophageal HRM system by Sierra Scientific Instruments was the pioneer system (8) in combining a proprietary solid-state circumferential pressure sensing technology (9) along with a novel color topographic visualization display (10) (Manoscan™ and Manoview™ respectively). Some motility experts find intuitive representation of esophageal motility by color contour plots of HRM easier for interpretation and an improvement over conventional pressure tracings (11). Consequently clinical motility centers have increasingly adopted this HRM system for pressure recording, and it is estimated that more than a 1000 units are currently in operation around the world. Publication of several hundred articles using Manoscan™ over the past decade indicates broad utilization in research laboratories as well. However, contrary to the common perception, duration of pressure recording and temperature cannot explain variable PD in sensors within the same session of manometric recording, because all pressure sensors record for the same duration and within a similar temperature environment yet show variable PD. Variable PD within the same study motivated us to investigate other possible factors that may affect PD in clinical manometry studies.
Our data clearly show that extreme high-pressure exposure exhibited only a small effect on the amplitude of PD, therefore the likelihood that mishandling of the catheter and manual squeeze of a sensor during nasopharyngeal intubation plays a major role in development of PD appears low. Furthermore, excessive catheter use could not account for PD since more use of each manometry catheter was associated with reduced PD. In fact, reduced PD correlating with more uses of catheter implied a “break in” effect in our limited sample of 6 manometry catheters. At least within the warranty period of less than 200 uses, these catheters performed slightly more accurately over time and developed less PD.
The user guide provided by the manufacturer currently does not specify a duration limit for precise pressure recording within 1-2 mmHg of accuracy (7). However, representatives of the manufacturer informally discourage pressure recordings of more than 90 minutes with Manoscan ™ system. In our institution, we utilize a comprehensive clinical esophageal manometry protocol and the majority of our studies involve 10-70 minutes of pressure recording (>95% of studies). Based on our data, while one cannot attribute PD to only unusually lengthy research related pressure recordings, further studies may be needed to assess the magnitude of PD in short clinical recordings of less than 10 minutes duration. Considering the temporal boundaries of our clinical studies, between 10-70 minutes, the duration of pressure recording had only a small impact on PD in contrast to previous report of in-vitro recordings (6).
The present study distinctly shows for the first time that average pressure exposure of a given sensor during manometry is the strongest predictor of PD. Therefore the sensors that were located in UES and LES high-pressure zones were more likely to show PD at the end of study. The accuracy of measured pressure is especially critical in the upper and lower esophageal sphincters (UES and LES), where residual relaxation pressures are only a few mmHg (4, 5), and may interfere with clinical interpretation of study. Pressure sensors of the Manoscan™ system are capacitive transducers comprised of a pair of co-axially aligned conductive surface electrodes (9). The inner electrode is a rigid metalized surface and is separated from the outer deformable sensing membrane by an air gap (9). The capacitive impedance between two surface electrodes varies as pressure applied on the outer deformable sensing membrane changes the dimension of the air gap (9). The outer membrane basically is a very thin polyimide material that is coated on its inner surface by a precision etched copper plate. The copper coating could result in a metal yield effect under pressure deformation and increase hysteresis of the sensor. We speculate that continuous pressure exertion in UES and LES high-pressure zones may result in sustained distortion of the outer deformable sensing membrane, and cause the transducer to retain a “pressure memory artifact” that lingers even after the termination of manometry study as PD.
Currently available “thermal compensation” corrective algorithm in analysis software is inadequate in correcting the PD. That is the reason that motility experts frequently observe physiologically implausible positive or negative pressure bands throughout some studies. Careful investigation of the basal pressure trend in the first pharyngeal sensor shows that development of PD is variable throughout the recording even in the pharynx that is not exposed to constant pressure. In nearly 15% of the studies (77/536) the measured baseline pharyngeal pressure was only 20% of time within ± 2 mmHg of the final measured PD. This problem becomes even more complicated in the UES and LES where baseline pressure is unstable and sensors are exposed to pressure asymmetrically in a temporally unpredictable fashion. If PD was rarely seen in critical sphincter regions, or its amplitude was negligible within declared accuracy of the system, one could consider it merely an intellectual curiosity. However, a PD that is several times the magnitude of the normative range of deglutitive residual pressure in UES and LES regions (4, 5), clearly could impact the clinical interpretation. The first HRM classification of esophageal motor disorders described the normative esophageal pressure metrics exclusively based on measurements with the Manoscan™ system (2, 12). Comparative studies with other HRM systems have only shown moderate to good agreement between various HRM systems (13), and substantial differences exist in some of the commonly used normative pressure metrics (14). Currently it is unknown if other available HRM systems manifest other limitations in accuracy of their pressure measurement. Considering the pervasive effect of PD shown in this study, it is prudent to cautiously approach diagnoses that merely rely on automated numerical metrics. Unfortunately the quantitatively driven diagnostic scheme proposed in “Chicago Classification” may inadvertently augment the perplexing effect of PD by exclusive reliance on numerical metrics for diagnosis of esophageal motor disorders.
We acknowledge that current study has certain limitations. Data were not prospectively collected in modifiable monitored conditions (pressure, moisture, temperature, duration) to experimentally evaluate PD. However, designing such an in-vivo study in human subjects would be challenging. We suspect that retrospective evaluation of a large number of clinical manometry studies realistically reflects the limitations of the system in usual clinical settings. Clearly a more comprehensive in-vitro study considering pressure, time, moisture, and acidity variables will add to our basic knowledge about PD. In addition, clinical implications of observed PD in interpretation of manometry studies (with and without application of available corrective algorithms) await further investigation. For example, the impact of PD on clinical diagnoses of motility disorders such as esophageal outflow obstruction or cricopharyngeal dysfunction would be highly relevant to show consequences of PD in clinical practice. In addition, the crucial role of the interpreting physician in analysis of esophageal motor patterns need to be reexplored comparative consideration.
In summary, the present study is the first broad investigation of the pressure drift (PD) phenomenon in the Manoscan™ high-resolution manometry system. Contrary to common perception, temperature, duration, and even peak pressure exposure are not the principal determinants of PD during clinical manometry. The pressure drift strongly correlates with “average pressure exposure” of a sensor and is not adequately corrected by “thermal compensation” algorithm. Further studies are needed to investigate this phenomenon in a controlled laboratory environment and explore the extent of impact on clinical diagnosis.
Supplementary Material
Supplementary Figure 1- Histogram of parameters related to pressure drift (PD). A) “Overall PD”: majority of manometry studies showed overall PD of 10-20 mmHg. B) “Peak PD”: majority of manometry studies showed “peak PD” of more than 20 mmHg, and occasionally exceeded 50 mmHg. C) Duration of manometry was nearly typically less than 60 minutes. D) Number of catheter uses prior to each manometric study of interest. As expected fewer manometry studies were conducted by catheters with more than a hundred clinical utilization.
Supplementary Figure 2- Correlation of pressure drift of individual sensors to average pressure exposure of sensor during manometry (A), number of preceding uses of sensor (B), duration of pressure recording by sensor (C), topographic region of recording sensor (D) and lastly peak pressure exposure of the sensor throughout recording (E). All factors showed statistically significant correlation with pressure drift (n=19296, p<0.0001)
Acknowledgments
This project was supported by the National Center for Research Resources and Advancing Translational Sciences through grant numbers 8KL2TR000056 and 8UL1TR000055.
Footnotes
The authors have no conflict of interest to disclose.
Arash Babaei and Emery Lin had equal roles in the study concept, data acquisition, data analysis, interpretation of data, statistical analysis, drafting of the manuscript, and critical revision of the manuscript for important intellectual content. Aniko Szabo had a major role in interpretation of data and statistical analysis. Benson Massey contributed to the interpretation of data, drafting and critical revision of the manuscript.
References
- 1.Bredenoord AJ, Fox M, Kahrilas PJ, et al. Chicago classification criteria of esophageal motility disorders defined in high resolution esophageal pressure topography. Neurogastroenterology and motility : the official journal of the European Gastrointestinal Motility Society. 2012;24(Suppl 1):57–65. doi: 10.1111/j.1365-2982.2011.01834.x. [DOI] [PMC free article] [PubMed] [Google Scholar]
- 2.Pandolfino JE, Ghosh SK, Rice J, et al. Classifying esophageal motility by pressure topography characteristics: a study of 400 patients and 75 controls. The American journal of gastroenterology. 2008;103:27–37. doi: 10.1111/j.1572-0241.2007.01532.x. [DOI] [PubMed] [Google Scholar]
- 3.Sierra Scientific Instruments LA. ManoScan 360 TM System Technical Specifications. 2001-2013 [cited; Available from: [Google Scholar]
- 4.Pandolfino JE, Ghosh SK, Zhang Q, et al. Quantifying EGJ morphology and relaxation with high-resolution manometry: a study of 75 asymptomatic volunteers. American journal of physiology. Gastrointestinal and liver physiology. 2006;290:G1033–40. doi: 10.1152/ajpgi.00444.2005. [DOI] [PubMed] [Google Scholar]
- 5.Ghosh SK, Pandolfino JE, Zhang Q, et al. Deglutitive upper esophageal sphincter relaxation: a study of 75 volunteer subjects using solid-state high-resolution manometry. American journal of physiology. Gastrointestinal and liver physiology. 2006;291:G525–31. doi: 10.1152/ajpgi.00081.2006. [DOI] [PubMed] [Google Scholar]
- 6.Robertson EV, Lee YY, Derakhshan MH, et al. High-resolution esophageal manometry: addressing thermal drift of the manoscan system. Neurogastroenterology and motility : the official journal of the European Gastrointestinal Motility Society. 2012;24:61–4. e11. doi: 10.1111/j.1365-2982.2011.01817.x. [DOI] [PubMed] [Google Scholar]
- 7.Given Imaging I. User Reference Guide. 2001-2013 [cited; Available from: http://www.givenimaging.com/en-us/Innovative-Solutions/Product-Support/PublishingImages/5-001-874ManoScanQRG-ManoViewESOAnalysis-Ltr.pdf.
- 8.Clouse RE, Parks T, Haroian L, et al. Development and clinical validation of a solid- state high-resolution pressure measurement system for simplified and consistent esophageal manometry. The American Journal of Gastroenterology. 2003;98:S32–S33. [Google Scholar]
- 9.Parks T, Son J, inventors; Given Imaging, assignee . High resolution solid state pressure sensor. USA: 2004. [Google Scholar]
- 10.Clouse RE, Parks TR, inventors; Given Imaging, assignee . Analysis and Visualization Methods Using Manometry Data. USA: 2005. [Google Scholar]
- 11.Soudagar AS, Sayuk GS, Gyawali CP. Learners favour high resolution oesophageal manometry with better diagnostic accuracy over conventional line tracings. Gut. 2012;61:798–803. doi: 10.1136/gutjnl-2011-301145. [DOI] [PMC free article] [PubMed] [Google Scholar]
- 12.Kahrilas PJ, Ghosh SK, Pandolfino JE. Esophageal motility disorders in terms of pressure topography: the Chicago Classification. Journal of clinical gastroenterology. 2008;42:627–35. doi: 10.1097/MCG.0b013e31815ea291. [DOI] [PMC free article] [PubMed] [Google Scholar]
- 13.Kessing BF, Weijenborg PW, Smout AJ, et al. Water-perfused esophageal high-resolution manometry: normal values and validation. American journal of physiology. Gastrointestinal and liver physiology. 2014;306:G491–5. doi: 10.1152/ajpgi.00447.2013. [DOI] [PubMed] [Google Scholar]
- 14.Weijenborg PW, Kessing BF, Smout AJ, et al. Normal values for solid-state esophageal high-resolution manometry in a European population; an overview of all current metrics. Neurogastroenterology and motility : the official journal of the European Gastrointestinal Motility Society. 2014;26:654–9. doi: 10.1111/nmo.12314. [DOI] [PubMed] [Google Scholar]
Associated Data
This section collects any data citations, data availability statements, or supplementary materials included in this article.
Supplementary Materials
Supplementary Figure 1- Histogram of parameters related to pressure drift (PD). A) “Overall PD”: majority of manometry studies showed overall PD of 10-20 mmHg. B) “Peak PD”: majority of manometry studies showed “peak PD” of more than 20 mmHg, and occasionally exceeded 50 mmHg. C) Duration of manometry was nearly typically less than 60 minutes. D) Number of catheter uses prior to each manometric study of interest. As expected fewer manometry studies were conducted by catheters with more than a hundred clinical utilization.
Supplementary Figure 2- Correlation of pressure drift of individual sensors to average pressure exposure of sensor during manometry (A), number of preceding uses of sensor (B), duration of pressure recording by sensor (C), topographic region of recording sensor (D) and lastly peak pressure exposure of the sensor throughout recording (E). All factors showed statistically significant correlation with pressure drift (n=19296, p<0.0001)


