Abstract
The serine residue displays specific effects on the dissociations of peptide fragment cation-radicals of the z+• type which are produced by electron transfer dissociation. Energy-resolved collision-induced dissociation (ER-CID), time-resolved infrared multiphoton dissociation (TR-IRMPD), and single-photon UV photodissociation at 355 nm revealed several competitive dissociation pathways consisting of loss of OH radical, water, and backbone cleavages occurring at N-terminal and C-terminal positions relative to the serine residue. The activation modes using slow-heating and UV photon absorption resulted in different relative intensities of fragment ions. This indicated that the dissociations proceeded through several channels with different energy-dependent kinetics. The experimental data were interpreted with the help of electron structure calculations that provided fully optimized structures and relative energies for cis and trans amide isomers of the z4+• ions as well as isomerization, dissociation, and transition state energies. UV photon absorption by the z4+• ions was due to Cα-radical amide groups created by ETD that provided a new chromophore absorbing at 355 nm.
Keywords: infrared multiphoton dissociation, UV photodissociation, electron transfer dissociation, peptide ions of the z type, collision-induced dissociation
1. Introduction
Effects of amino acid residues on gas-phase peptide ion dissociations have been extensively studied for various ion activation modes. Aspartic acid [1–3], proline [4] and histidine [5] are known to affect collision-induced dissociations (CID) of even-electron ions by enhancing backbone cleavage in their vicinity. Proline [6] and histidine [7–10] have major effects on hampering peptide ion backbone dissociations induced by electron attachment such as electron capture [ECD, 11] and electron transfer dissociation [ETD, 12]. In contrast, the serine residue has been found not to be prominent in affecting low-energy CID or ECD of peptide ions [6] although effects on the high-energy (kiloelectronvolt) CID spectra [13] and dissociations of negative peptide ions [14] have been noted. Radical-driven dissociations of ternary copper complexes showed a dominant loss of formaldehyde which was specific for the serine residue [15].
Fragment ions formed by ECD or ETD presumably retain intact partial amino acid sequences and thus can be used to infer additional sequence information from their CID [16–18]. In particular, fragment ions of the z+• type have been addressed in detail as a matter of both survey [16–18] and mechanistic [19–21] studies. z+•-Type ions are formed by backbone cleavage of bonds between the amide nitrogens and the alpha carbon atoms of the adjacent amino acid residues and represent truncated and deaminated peptide cation-radicals extending from the C-terminus. z+•-Type ions represent a bridge between the chemistry of hydrogen-rich and hydrogen-deficient peptide cation-radicals; their structure and dissociations have been of much interest [22].
The amino acid residues that affect z+•-ion dissociations have been assigned to three categories [20]. The first type involves amino acids (Phe, Tyr, His, Trp, Val) that strongly promote backbone dissociations at positions two residues toward the C-terminus, forming zn−2+• fragment ions from zn+• precursors. The second type involves amino acids that undergo facile radical-induced side-chain dissociations such as loss of C3H7 from Leu or loss of SH from Cys. The third type involves z ions from amino acids in which backbone dissociations compete with side-chain losses, such as in Asp and Asn [20].
We now report an energy-resolved CID, time-resolved infrared multiphoton photodissociation (IRMPD) and UV photodissociation (UVPD) study of serine-containing z+• ions in which the serine residue promotes N-terminal backbone cleavages. This feature is related to radical reactions involving the serine side chain, as revealed by extensive electron structure calculations of isomer structures in addition to relative, transition-state, and dissociation energies that provide a comprehensive description of the cation-radical unimolecular chemistry.
2. Experimental
2.1 Materials and Methods
All peptides used in this work were custom-synthesized by NEOPeptide Laboratories (Cambridge, MA). ETD mass spectra were measured on a Thermo Fisher (San Jose, CA, USA) LTQ XL quadrupole linear ion trap (QLT) instrument, outfitted with a chemical ionization source for the production of fluoranthene anion radicals as ETD reagent, as described previously [23]. High-resolution ETD spectra were measured under the same conditions on a modified Orbitrap mass spectrometer [24] at nominal resolution of 60000. The typical data acquisition parameters were as follows: q value 0.25, ion-ion reaction time 100–200 ms, CID excitation time 30 ms. The LTQ XL mass spectrometer was modified to allow for the introduction of IR photons to the ion trapping region of the QLT [25]. For the energy-resolved experiments, CID normalized collision energies (NCE) of zero to 50 correspond roughly to supplemental AC excitation voltages of 0 to ~2.5 V. Infrared multiphoton dissociation was carried out by operating the laser in a mode whereby the laser was externally triggered via a TTL pulse from pin14 of the J1 connector. Laser power was set as indicated in the text.
UV photodissociation (UVPD) measurements were performed on another modified LTQ XL ETD mass spectrometer that was furnished with a pulsed E/O Q-switched Nd:YAG diode laser (EKSPLA NL301, Altos Photonics, Bozeman, MT) and a third harmonics generator providing up to 110 mJ/pulse at 355 nm with a 20 Hz pulse frequency and 3–6 ns pulse width. For the UVPD experiments, the laser power was set to 15–18 mJ/pulse. This ensured one-photon absorption, as established by a calibration that showed a linear ion depletion curve as a function of the laser power. Laser pulses were triggered by LabView software that received a signal from a TTL pulse from pin14 of the J1 connector on the LTQ console that was controlled from within the mass spectrometer data acquisition software (Xcalibur Version 3.7). ETD fragment ions were generated at 100–300 ms ion-ion interaction time, selected by mass, and stored in the ion trap for 400 ms while the laser was off. The trapped z4 ions were then irradiated by a variable number of laser pulses (0–7) during the 400 ms storage time, and the UVPD products were mass analyzed. A typical spectrum consisted of 50 accumulated UVPD scans. For comparison, low-level CID mass spectra at NCE =13 were recorded over a 400-ms excitation time.
2.2 Calculations
All electron structure calculations were performed using the Gaussian 09 suite of programs as described previously [26]. Ion geometries were optimized with density functional theory calculations using the hybrid B3LYP [27,28] and M06-2X [29] functionals in the spin-unrestricted format and the 6-31+G(d,p) basis set. The geometries in the Cartesian coordinate format (standard orientation) are available from the corresponding author upon request. The optimized structures were confirmed as local energy minima or first-order saddle points by harmonic frequency calculations. In addition, Møller-Plesset theory [30], UMP2(frozen core), with the 6-311++G(2d,p) basis set was used to obtain single-point energies, which were corrected for contribution of higher spin states by the standard spin annihilation procedure [31,32]. The UB3LYP and PMP2 single-point energies were averaged (B3-PMP2) to cancel small errors inherent to both approximations, as reported previously [33–35].
3. Results and discussion
3.1. z4 ion formation and dissociations
Electron transfer dissociation of the doubly charged (AASAR + 2H)2+ ion (m/z 238) forms a series of z1+•-z4+• backbone fragment ions (Figure S1, Supplementary Data). The spectrum also shows a prominent fragment ion at m/z 459 which is formed by loss of ammonia from charge-reduced (AASAR + 2H)+•. Such species are sometimes denoted as z+• -type fragment ions, provided the ammonia molecule was eliminated from the protonated N-terminus, which is typical for peptide ions containing lysine C-terminal residues [36]. However, there is evidence [37] that ammonia eliminated from arginine C-terminated peptide cation-radicals partly originates from the guanidine group, rendering the fragment ion structure uncertain.
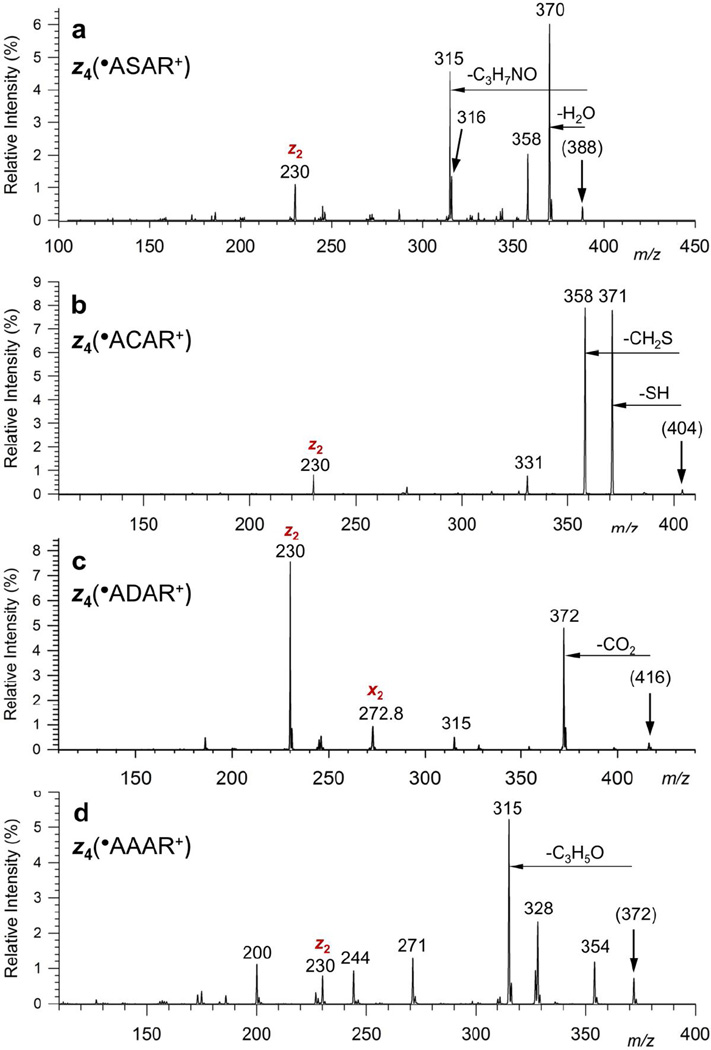
The z4 ion at m/z 388 was selected and subjected to either collisional activation or photoexcitation. The overall ETD-CID-MS3 mass spectrum is shown in Figure 1a. The spectrum contains a prominent fragment ion due to loss of water (m/z 370), which is accompanied by an m/z 371 ion by loss of OH radical. The other prominent fragment ions are at m/z 358 (loss of CH2O), 316 (loss of C3H6NO), 315 (loss of C3H7NO) and m/z 230 (z2). The identity of the neutral fragments was supported by accurate mass measurements in high-resolution ETD-CID-MS3 mass spectra that showed agreement with theoretical masses within ±0.0007 Da (Figure S2, Supplementary Data), allowing unambiguous neutral fragment assignment. The MS3 mass spectrum of the z4+• ion from AASAR is compared to those of z4+• ions from AACAR, AADAR, and AAAAR (Figure 1b, c, and d, respectively). These ions show residue-specific dissociations by loss of SH and CH2S from AACAD, CO2 from AADAR, and C2H3NO from AAAAR. The losses of OH, water, CH2O and C3HxNO (x = 6,7) are specific for the serine residue as they are nearly absent in the MS3 spectra of the other z4+• ions. The z4+• ion from AACAR shows a minor peak at m/z 331, which can be assigned to loss of a 73 Da molecule, presumably C3H7NO.
Figure 1.
CID-MS3 spectra of z4+• ions from ETD of (a) (AASAR + 2H)2+, (b) (AACAR + 2H)2+, (c) (AADAR + 2H)2+, and (d) (AAAAR + 2H)2+.
3.2. Energy-resolved CID
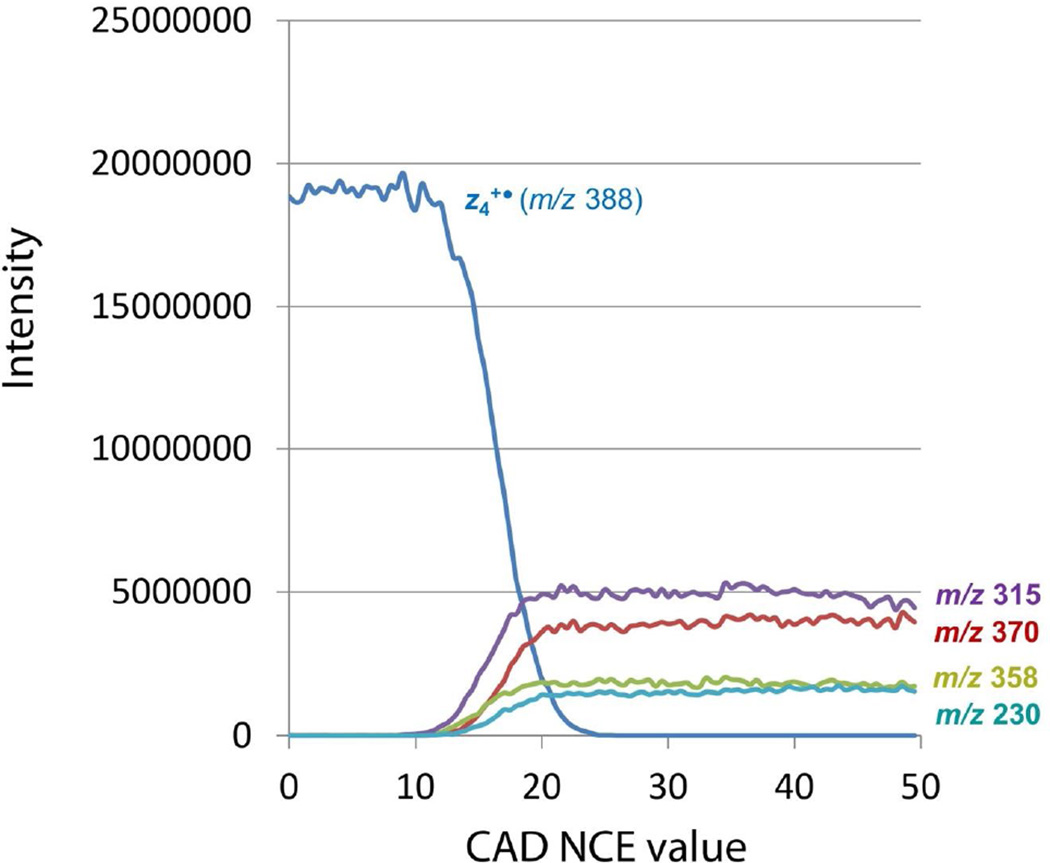
The energy-resolved intensities of the m/z 388 precursor and major fragment ions are plotted in Figure 2. The m/z 315 fragment ion shows the lowest energy onset at NCE ≈ 11 followed by a rapid increase of this ion intensity. The next threshold at NCE ≈ 12 belongs to the m/z 358 fragment ion (loss of CH2O), followed by a shallow curve of its increasing intensity. The m/z 370 (loss of water) and m/z 230 (z2+•) ions show indistinguishable onsets at NCE ≈ 13. Of these two, the loss of water fragment ion intensity shows a substantially steeper increase with the precursor ion excitation energy.
Figure 2.
Energy-resolved CID-MS3 mass spectra of mass-selected m/z 388 z4+• ion from ETD of (AASAR + 2H)2+.
Note that the CID-MS3 spectra were generated by resonant excitation of the m/z 388 ion, whereas the fragment ions formed from it were not accelerated for further collisional activation. Conversely, the fragment ions could lose internal energy by collisions with the He buffer gas in the linear ion trap. This is evidenced by CID-MS4 mass spectra of mass-selected MS3 fragment ions. Upon resonant excitation, the m/z 358 ion underwent major losses of water and CO2 giving fragment ions at m/z 340 and 314, respectively (Figure S3, Supplementary Data). These secondary fragments were weak or nearly absent in the CID-MS3 spectrum in Figure 1a, indicating that the m/z 358 ion did not have sufficient internal energy to dissociate when formed from the excited m/z 388 precursor or was cooled by collisions with He. Likewise, CID-MS4 of the abundant m/z 370 ion produced mainly m/z 341 and 313 ions which were weak in the CID-MS3 spectrum (Figure S4a, Supplementary Data). CID-MS4 of the m/z 315 ion showed a major loss of CO (27.9949 Da) providing the m/z 287 fragment ion (Figure S4b, Supplementary Data) which appears as a minor peak in the CID-MS3 spectrum (Figure 1a). Hence, the energy-resolved graph in Figure 2 chiefly represents the competitive rates of formation of the secondary fragments that are not substantially affected by consecutive dissociations.
3.3. Time-Resolved IRMPD
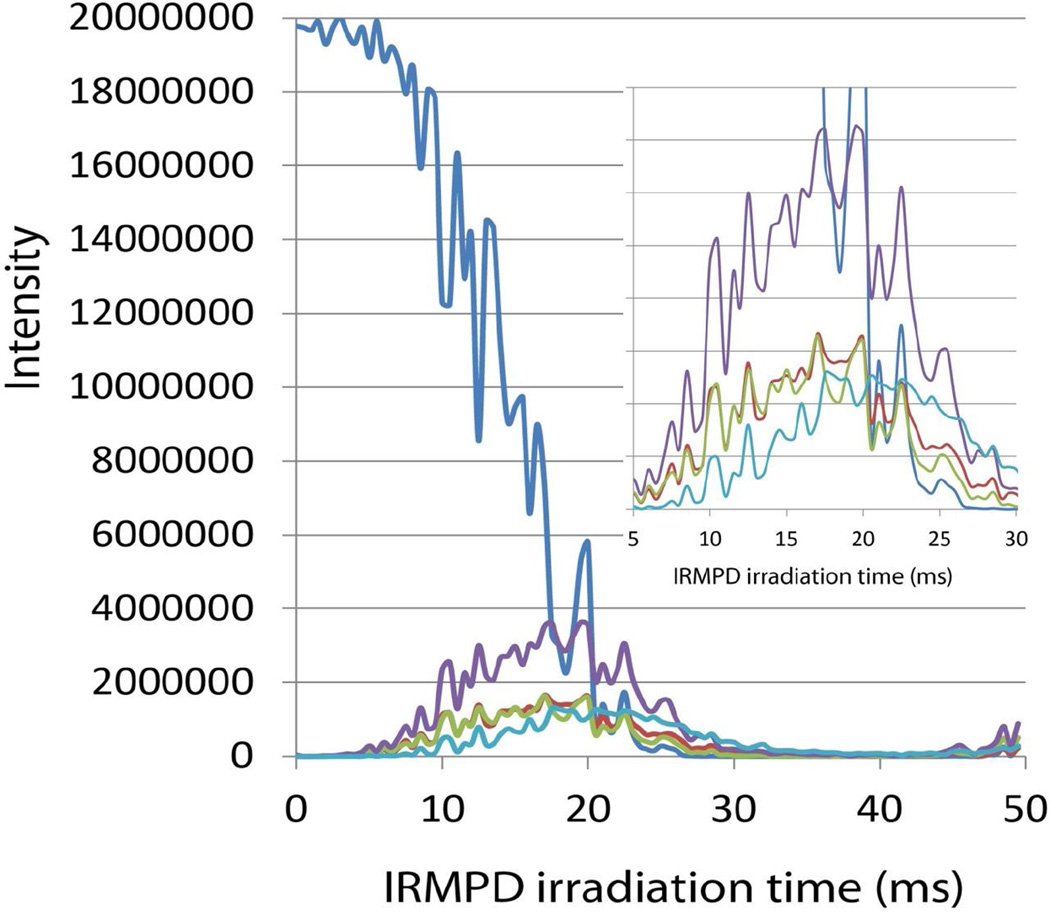
The fragment ion intensities produced by time-resolved IRMPD of z4+• showed a different pattern (Figure 3). The m/z 315 ion had the lowest energy onset appearing at the shortest (5 ms) irradiation time. The m/z 315 ion intensity showed a maximum at ca. 18–20 ms irradiation time and then gradually decreased. The m/z 358 and 370 photodissociation curves were nearly superimposable, showing similar onsets, maxima at ca. 18 ms, and decline at 30 ms irradiation time. The z2+• ion photodissociation curve showed a later onset at ca. 8 ms and persisted until 30 ms irradiation time. Note that all ions in the linear ion trap are exposed to the infrared laser beam and can undergo photodissociation if they absorb at the excitation line (934 cm−1). Hence, the time dependence curves reflect the competitive formation of the secondary fragments from the photoexcited z4+• precursor ion, as well as their photodissociative depletion. The relative rates of photodissociative depletion were investigated by CID-IRMPD-MS4 measurements. The ion of interest (m/z 370, 358, 315, or 230) was produced by ETD-CID-MS3, mass selected, and irradiated for 0–30 ms. The time-dependent photodissociative depletion curves were normalized to the initial ion intensity and plotted in Figure S5. The results showed that the fragment ions underwent photodissociative depletion at similar rates. This presumably reflects their similar absorbances at 934 cm−1. As discussed previously [23], peptide ions have several absorption bands in the 900–950 cm−1 region of the infrared spectrum as well as numerous bands in the 400–600 cm−1 region. Hence, IR molar absorption can involve fundamental, combination, and overtone modes that are difficult to identify and quantify. Overall, photoexcitation by IR photon absorption showed a dependence on the absorbed laser power that was similar to that for collisional excitation in that both resulted in a preferential formation of the m/z 315 fragment ion. Additional information obtained from the time-resolved photoexcitation measurements was that the photodissociation rate constants had to be greater than 35 s−1 in order to outcompete collisional cooling of the photoexcited z4+• ions.
Figure 3.
Time-resolved IRMPD curves for m/z 388, 370, 358, 315, and 230 ions. Inset shows a blown-up region of fragment ion intensities. Color coding as in Figure 2.
Single-Photon UV Photodissociation
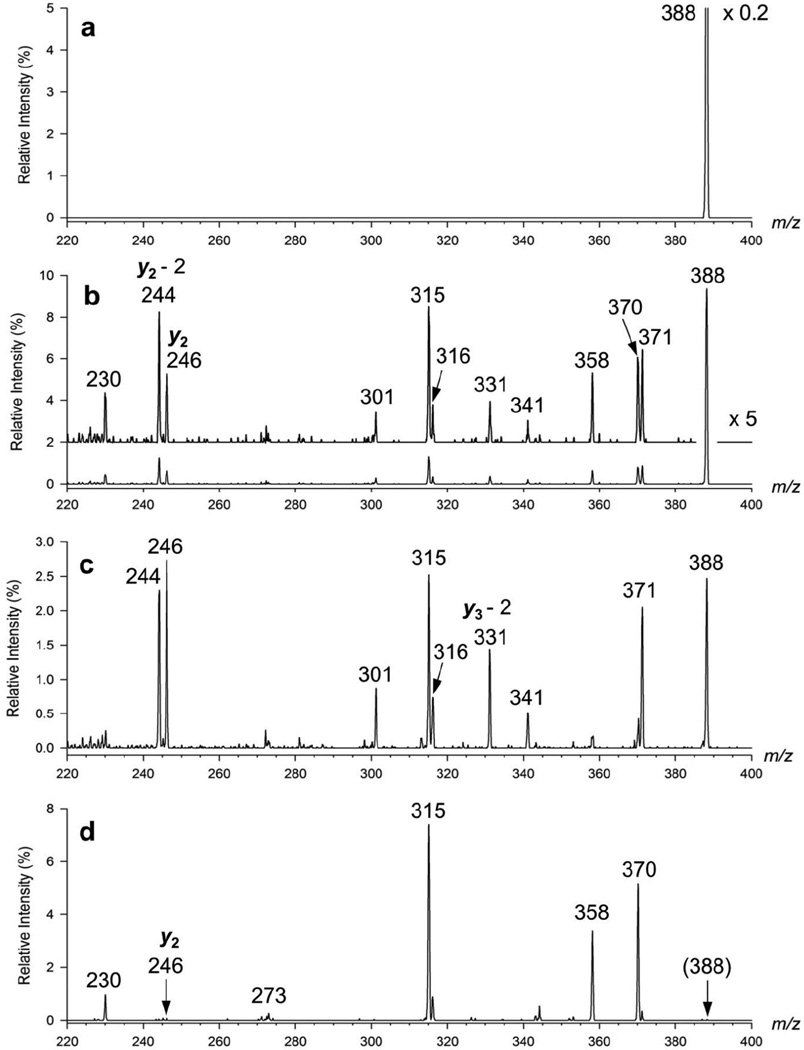
Mass selected z4+• ions were irradiated with a variable number of laser pulses from the Nd-YAG laser; 355 nm corresponds to a photon energy of 3.49 eV. The UVPD spectra together with reference spectra are shown in Figure 4. The reference spectrum in Figure 4a was obtained without collisional activation (NCE = 0) or photoexcitation (0 laser pulses) to verify that the trapped z4+• ions did not undergo any dissociations during the 400 ms storage time. The reference spectrum in Figure 4d was obtained with low-level CID (NCE = 13) for 400 ms and shows the same main fragment ion peaks as the Figure 1a spectrum that was obtained at 30 ms collisional activation.
Figure 4.
(a) Isolation spectrum of the •ASAR+ z4+• ion at 400 ms with no collisional activation (NCE = 0) and no photodissociation (0 laser pulses). (b) UVPD with 1 laser pulse at 15 mJ/pulse energy in 400 ms. (c) UVPD with 3 laser pulses at 15 mJ/pulse energy in 400 ms. (d) CID at NCE = 13 and 400 ms collisional excitation.
Figures 4b and 4c show the UVPD spectra of z4+• ions obtained with 1 and 3 laser pulses, respectively. Laser irradiation caused precursor ion dissociations, indicating that the z4+• ions had a chromophore group absorbing at 355 nm. Note that natural amino acid residues in peptide ions produced by electrospray do not absorb at 355 nm. Thus, the UVPD spectrum of the z4+• ions indicated that a new chromophore was created upon ETD. UVPD substantially changed the fragment ion relative intensities compared to those in the CID spectrum. For example, UVPD favored loss of the OH radical over loss of water, and also produced a higher ratio for the [m/z 316]/[m/z 315] fragment ion intensities. Also conspicuous is the formation by UVPD of a m/z 341 photofragment ion by loss of CH2O from the m/z 371 ion, and the formation of abundant y2 (m/z 246), (y2 – 2H) (m/z 244), and (y3 – 2H) (m/z 331) fragment ions. The spectra obtained with 3 or more laser pulses showed further depletion of some UVPD fragment ions. This chiefly affected the open-shell (cation-radical) photoproducts (m/z 370 and 358), indicating that they contained chromophore groups absorbing at 355 nm and underwent further photofragmentation. The fact that UVPD induced fragmentations at different positions of the z4+• ion side chain and backbone can be interpreted in two ways. One possible interpretation is that there are several z4+• ion isomers with different chromophore groups that undergo photodissociation from their excited electronic states. These isomers may be present in the z4+• ion population produced by ETD or can result from photoinduced isomerization. Distinction between these two possibilities can be made on the basis of the potential energy diagram that is discussed below. Alternatively, the 3.49 eV energy delivered by photon absorption can be converted by vibronic transitions to vibrational excitation of the radical ion ground-state to drive its dissociations. In any case, the internal energy distribution in the photoexcited ions is different from that in ions vibrationally excited in the slow-heating collisional activation regime.
3.4. Ion Structures and Dissociation Energetics
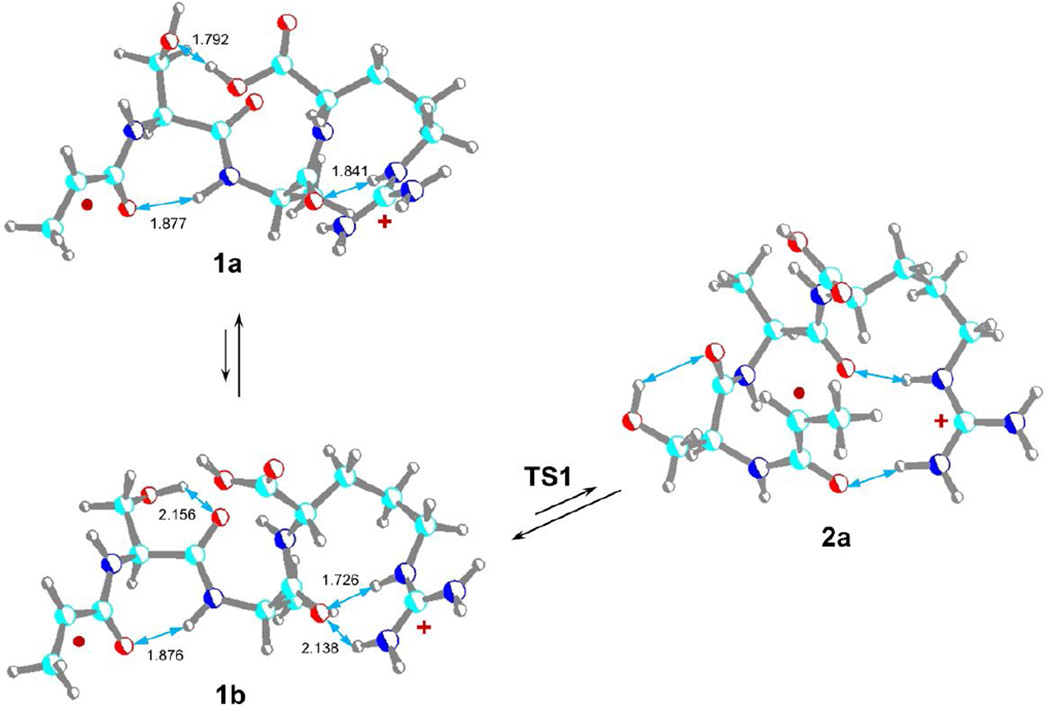
The z4+• ion geometry was modeled according to previously studied z4+• ions to capture the neutral dipole-dipole and ion-dipole interactions of the polar groups [23]. Structures of the all-trans amide ions 1a and 1b (Scheme 1) show a common pattern for an internal solvation of the charged guanidinium group by the proximate Ala4 amide oxygen [20,21], whereas the H-bonding patterns for the Ser hydroxyl group differ. These conformational changes resulted in very similar energies for the conformers (Table 1). The Ala1 Cα-radical center in structures 1a and 1b does not trigger β-fission reactions that would result in direct backbone cleavage. This is evidenced by the absence in the ER-CID or TR-IRMPD spectra of fragment ions resulting from the loss of H atoms (m/z 387) or CH3CH=C=O (m/z 332) that would be formed by β-fission reactions near the original radical center. To trigger radical reactions involving hydrogen atom transfer [16, 19, 20, 23, 38,39], the Ala1 Cα-radical center must be brought into the vicinity of potential hydrogen donors. This can be achieved at some energy cost by bending the all-trans amide backbone to position remote hydrogen atoms close to the Ala Cα-radical center [19, 20, 23]. However, an energetically more favorable pathway can be followed that involves rotation of the Ala1 amide into a cis-configuration (2a, Scheme 1). According to M06-2X energies, the transition state for this rotation (TS1) was only 45 kJ mol−1 relative to 1a to form a cis-amide isomer 2a at 17 kJ mol−1 relative to 1a. The combined B3LYP and PMP2 relative energies were 58 and 26 kJ mol−1 for TS1 and 2a, respectively (Table 1). The cis isomer 2a has the Ala1 Cα radical center accessible for hydrogen atoms on the neighboring serine side chain as well as at the Ser Cα position.
Scheme 1.
M06-2X/6-31+G(d,p) optimized structures of z4+• trans-amide (1a,1b) and cis-amide (2a) ions from AASAR. The atom color coding is as follows: Turquoise = C, blue = N, red = O, gray = H. Hydrogen bonds are indicated by blue arrows with distances given in Ångstrøms.
Table 1.
Relative Energies of z4+•Ions.
| Species/reaction | Relative Energya,b | |||
|---|---|---|---|---|
| B3LYPc | M06-2Xd | PMP2c | B3-PMP2e | |
| 1a | 0 | 0 | 0 | 0 |
| 1a → 1b | 3 | 15 | 5 | 4 |
| 1a → TS1 | 55 | 45 | 61 | 58 |
| 1a → 2a | 33 | 17 | 19 | 26 |
| 1a → TS2 | 108 | 102 | 93 | 100 |
| 1a → 3a | 39 | 31 | 30 | 34 |
| 1a → TS3 | 98 | 91 | 83 | 90 |
| 1a → 4a | −1 | 13 | 1 | 0 |
| 1a → TS4 | 87 | 118 | 106 | 96 |
| 1a → 5a | 43 | 64 | 68 | 56 |
| x2+• + C5H9NO | 102 | 153 | 149 | 125 |
| x2+• → TS5 | 59 | 89 | 81 | 70 |
| x2+• → z2+• + HN=C=O | −30 | 4 | 4 | −13 |
| 4a → TS6 | 70 | 94 | 102 | 86 |
| 4a →7a + CH3CH2CONH• | 76 | 160 | 141 | 108 |
| 4a → TS7 | 76 | 73 | 86 | 81 |
| 4a →8a | 62 | 48 | 104 | 83 |
| 4a →9a + CH3CH2CONH2 | 11 | 53 | 58 | 35 |
| 4a →9a + CH3CH2C(OH)=NH | 64 | 99 | 107 | 85 |
| 1a → TS8 | 134 | 139 | 113 | 124 |
| 1a → 10a | 16 | 15 | 13 | 15 |
| 1a → 11a | −17 | −7 | −17 | −17 |
| 1a → TS9 | 116 | - | 163 | 140 |
| 1a → 12a | 20 | - | 16 | 18 |
| 1a → TS10 | 114 | 144 | 144 | 129 |
| 1a → 13a | −4 | 16 | −8 | −6 |
| 1a → 14a + H2O | 31 | - | 35 | 33 |
| 1a → 15a + H2O | 21 | 49 | 26 | 24 |
| 1a → 16a + OH• | 130 | 150 | 131 | 130 |
In kJ mol−1.
Including zero-point energy corrections and referring to 0 K.
From single-point energy calculations with the 6-311++G(2d,p) basis set on B3LYP/6-31+G(d,p) optimized geometries.
From single-point energy calculations with the 6-311++G(2d,p) basis set on M06-2X/6-31+G(d,p) optimized geometries.
From averaged B3LYP and PMP2/6-311++G)2d,p) energies.
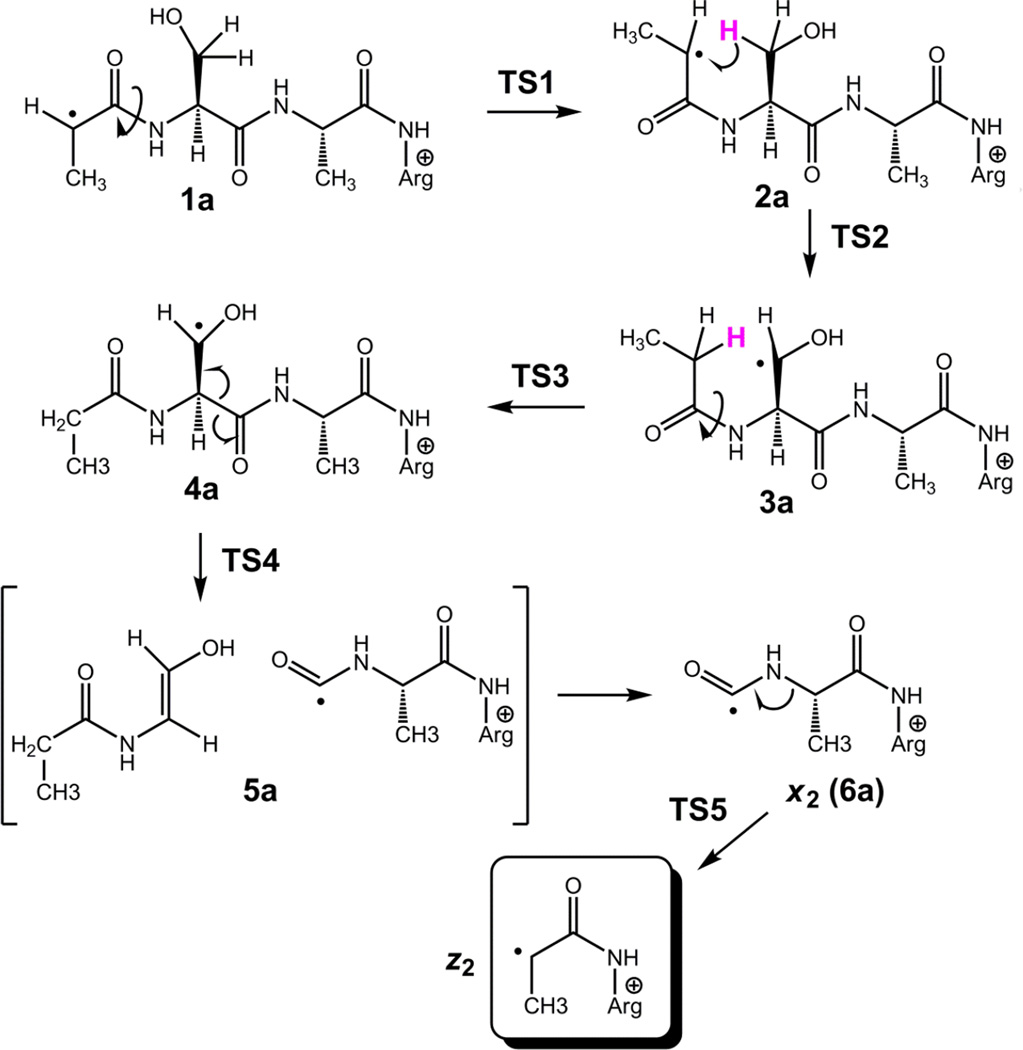
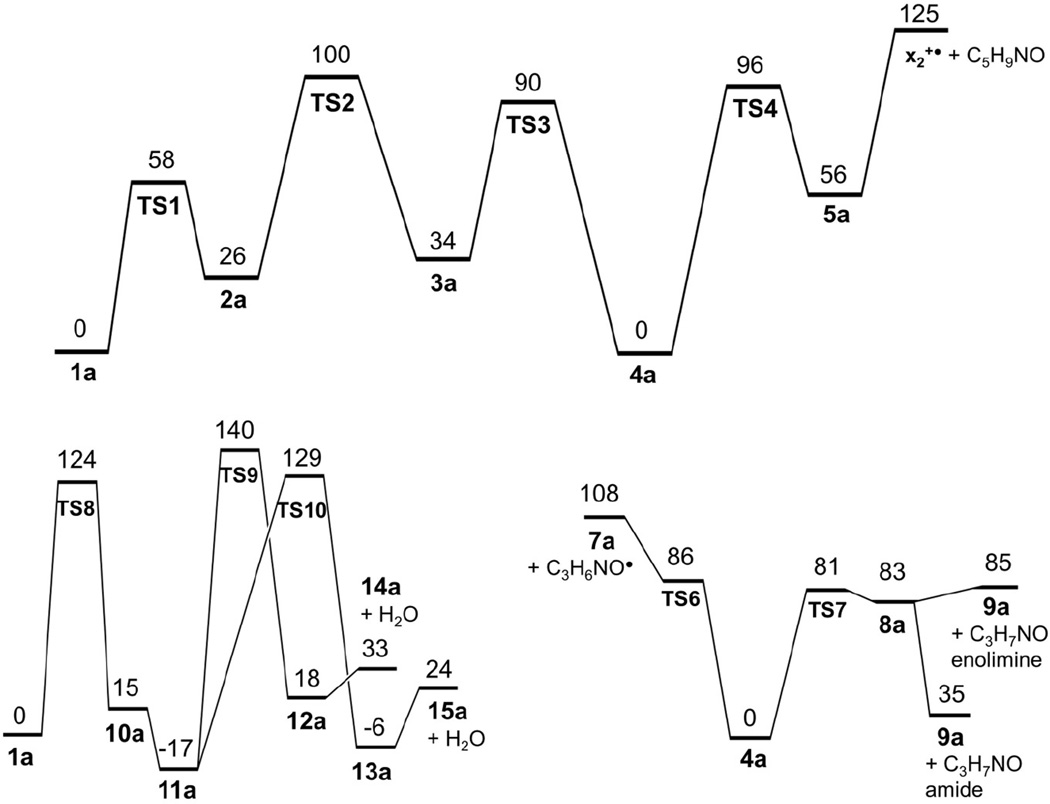
The reversible nature of the 1a → 1b → 2a isomerization must have an effect on the reaction kinetics by lowering the population of the reactive cis isomer 2a. Isomer 2a has a suitable geometry to undergo hydrogen migration from the serine β-position forming radical 3a which is only slightly less stable than 2a (Scheme 2). The hydrogen atom migration proceeds through TS2 which requires 74 kJ mol−1 relative to 2a. Radical 3a can further isomerize by facile amide group rotation (TS3) to achieve the lower-energy trans amide configuration in 4a which is slightly less stable than 1a. Thus, the highest point on the potential energy surface along this isomerization pathway is in TS2 (104 kJ mol−1 relative to 1a), as shown in the potential energy surface diagram (Figure 5, top panel). The β-radical in 4a activates the serine Cα–CO bond for homolytic cleavage. This can proceed through TS4, which is 96 kJ mol−1 above 4a, forming a complex (5a) of the incipient C5H9NO neutral fragment and the x2+• ion (6a). Complex 5a is held together by hydrogen bonding between the amide oxygen of the neutral fragment and the guanidine and amide radical protons of the charged moiety (Figure S6, Supplementary data). When formed, the x2+• ion can undergo facile elimination of HNCO [20] to form the m/z 230 z2+• ion which is detected in the CID mass spectrum. The calculated relative energies indicate that complex 5a is 56 kJ mol−1 above 4a, so the Cα–CO bond cleavage leading to its formation is reversible. The C5H9NO and x2+• fragment separation in 5a is 69 kJ mol−1 endothermic, bringing the dissociation threshold energy to 125 kJ mol−1 relative to 1a.
Scheme 2.
Formation of serine β-radical 3a and Ca–CO backbone cleavage leading to the z2+• ion at m/z 230. For fully optimized structures of all species, see Figure S6 in the Supplementary Data.
Figure 5.
Potential energy surface for isomerizations and dissociations of the •ASAR+ z4+• ion. Top panel: C-terminal backbone cleavage pathway leading to the x2+• ion formation. Bottom left panel: Dissociation pathway leading to the loss of water. Bottom right panel: N-terminal backbone cleavage pathway leading to the m/z 315 fragment ion formation. Energies are from combined B3LYP and PMP2/6-311++G(2d,p) calculations and include zero-point vibrational energy corrections.
We also addressed an analogous dissociation pathway proceeding from the cis-β-serine radical 3a. However, the pertinent transition states (TS4b) and intermediates (5b) were at higher energies than their trans-amide counterparts, and thus the cis-pathway was disfavored by energy.
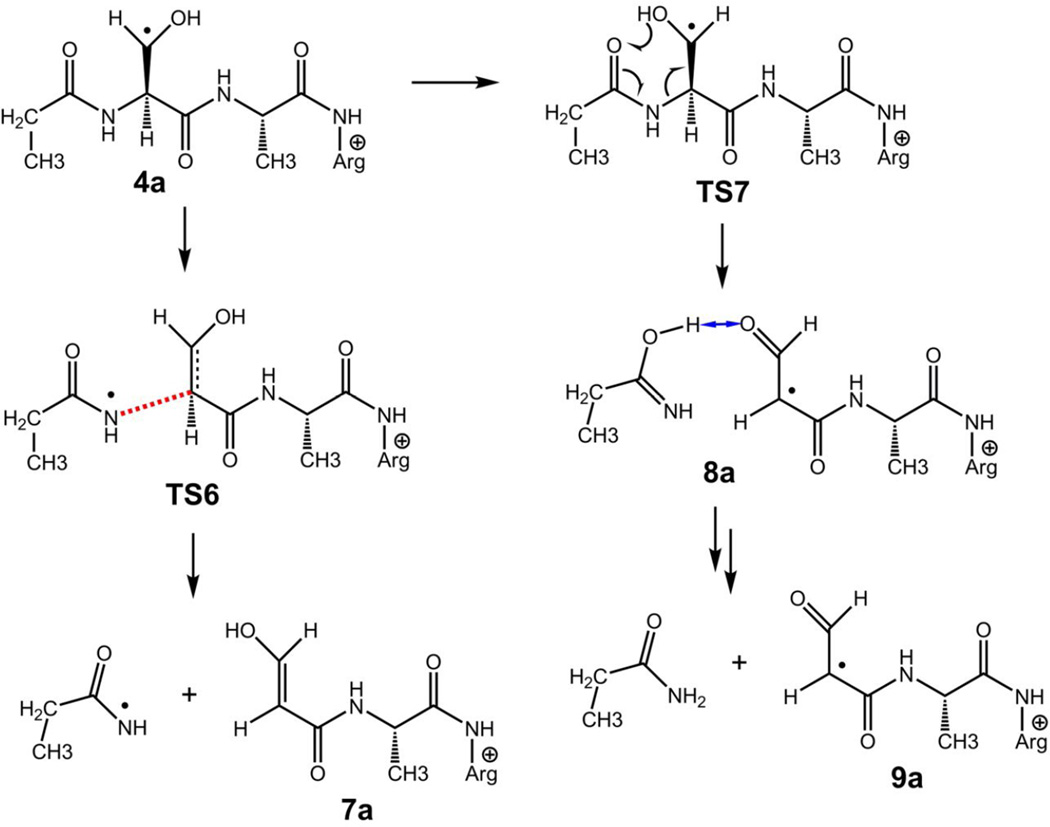
The trans-serine β-radical (4a) was presumed to weaken the adjacent N–Cα bond to promote an N-terminal backbone cleavage leading to the m/z 316 and 315 fragment ions (Scheme 3). The potential energy surface for these dissociations is shown in Figure 5, bottom right panel. Simple dissociation of the N–Cα bond can lead to a late transition state (TS6) resembling an ion-molecule complex of the propionamidyl radical with the m/z 316 fragment ion. The TS6 energy was 87–105 kJ mol−1 relative to 1a when calculated at different levels of theory. Subsequent dissociation to propionamidyl radical and the m/z 316 fragment ion (7a) had a threshold energy at 108 kJ mol−1 relative to 1a. In a competing reaction pathway, the N–Cα bond dissociation can be accompanied by a transfer of the Ser hydroxyl proton in TS7 leading to complex 8a. The TS7 energy (82–84 kJ mol−1 relative to 1a) was slightly lower than that for TS6. Complex 8a can endothermically dissociate to the m/z 315 ion (9a) and propionamide enolimine (85 kJ mol−1 relative to 1a), or undergo exothermic prototropic isomerization of the neutral moiety [40, 41], forming propionamide and 9a at 35 kJ mol−1 relative to 1a. The calculated TS and threshold energies qualitatively agree with the relative rate of formation of the m/z 316 and 315 fragment ions where the latter ion which requires lower TS and threshold energies is formed preferentially (Figure 1a).
Scheme 3.
N-terminal dissociations of β-radical 4a leading to the m/z 316 and 315 fragment ions. Bonds being broken are denoted by red broken lines. Hydrogen bonds are denoted by blue double-headed arrows. For fully optimized structures of all species, see Figure S7 in the Supplementary Data.
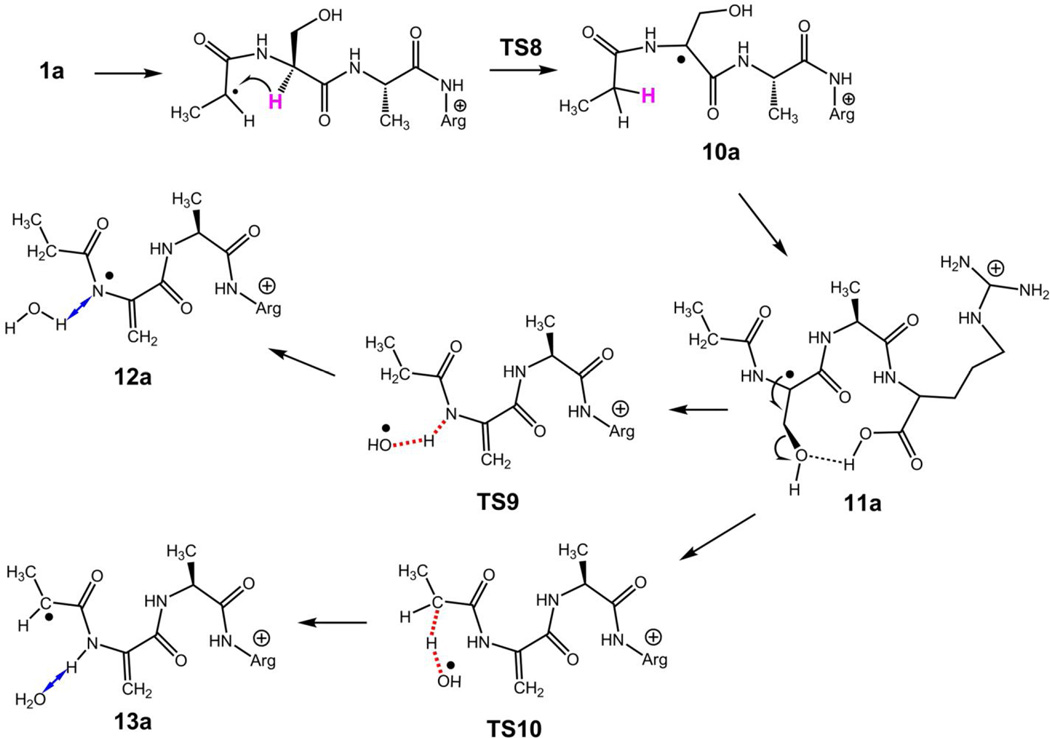
The very abundant loss of water from the z4+• ion from AASAR (Figure 1a) is unmatched in the ETD-CID-MS3 spectra of other z4+• ions (Figure 1b–d). Part of the water loss may involve the carboxyl or amide groups, as evidenced by the spectrum of the z4+• ion from AAAAR (Figure 1d) which loses water although it has no side-chain groups. However, the bulk of water loss from AASAR is likely to originate from the serine hydroxyl group. We investigated the radical-induced mechanisms for water loss. To activate the serine Cβ–OH bond, one can envision the formation of a Ser Cα-radical by hydrogen atom transfer in cis-amide isomer 2a (Scheme 4). The hydrogen migration requires a cis-amide group to be sterically feasible and proceed through TS8, which was calculated to be at 124 kJ mol−1 relative to 1a (Figure 5, bottom left panel). The resulting Ser Cα-radical (10a) is a cis-amide that can exist in different conformations. The cis-Ser Cα-radical (10a) can exothermically isomerize by facile N-terminal amide rotation forming a trans-amide isomer (11a) which is slightly more stable than 1a (Table 1), making the isomerization exothermic. Further radical-induced loss of water can proceed by transfer onto the hydroxyl group of the amide hydrogen atom concomitantly with cleavage of the Cβ–O bond. A potential energy surface mapping search (Figure 5, bottom left panel) found TS9 at 135 kJ mol−1 relative to 1a that corresponded to a transfer of the amide H atom to a loosely-bound OH radical. An independent search starting from a conformer of 11a found another TS (TS10) in which a loosely bound OH radical abstracted a hydrogen atom from the previously formed methylene group. The TS10 energy was at 124 kJ mol−1 relative to 1a which was lower than TS9. The H-atom transfer produced intermediate ion-molecule complexes (12a, 13a). The more stable 13a was at a slightly lower energy than 1a and close to the Cα-radical 11a. Loss of water from complex 13a to form the m/z 370 fragment ion (15a) required a low threshold energy of 24 kJ mol−1. Loss of water from the amidyl radical complex 12a then can produce an isomeric radical 14a.
Scheme 4.
Intermediates for loss of water from the z4+• ion 1a. Bonds being broken or formed are denoted by red broken lines. Hydrogen bonds are denoted by blue double-headed arrows. For fully optimized structures of all species, see Figure S8 in the Supplementary Data.
The energetics of the isomerization and dissociation pathways are collated in the potential energy diagrams (Figure 5). The top panel shows the potential energy surface (PES) for the trans-pathway to Cα–CO bond dissociation leading to the x2+• intermediate and yielding eventually the z2+• fragment ion at m/z 230. The lower left panel shows the PES for the pathways to radical-induced loss of water leading to the m/z 370 fragment ion. The lower right panel shows the PES for the N-terminal backbone cleavage leading to the m/z 316 and 315 ions. The PES diagrams show different features that presumably affect the isomerization and dissociation kinetics and determine the branching ratios for the fragment ion formation. The loss of water channels start from ion 1a and require an isomerization to the serine Cα radicals 10a and 11a. This isomerization is exothermic and thus not readily reversible, so a fraction of z4+• ions can accumulate as structure 11a after having passed TS8. A further dissociation of 11a through TS10 is likely to be irreversible, because the reverse formation of 11a from complex 13a cannot compete with the very facile loss of water forming 15a (Figure S8, Supplementary Data).
Loss of the OH radical from 11a presumably can also proceed through TS9 but excluding the hydrogen atom transfer or it can involve another loose transition state. The loss of OH had a threshold energy of 130 kJ mol−1 relative to 1a, forming the even-electron ion 16a (Figure S8, Supplementary Data). Such a relatively low dissociation energy of the serine Cβ–OH bond must be due to an activation by the adjacent Cα radical center in 10a or 11a. Note that the energy needed to drive the loss of OH can be readily supplied by absorption of a single 3.49-eV photon. The enhanced loss of OH upon UVPD is consistent with a loose transition state for this dissociation, as it is expected to be favored at higher internal energies of the z4+• ion. Conversely, this points to the Cα-radical amide group in 10a or 11a as the chromophore allowing photon absorption at 355 nm.
In contrast to the loss of water, the backbone cleavage dissociations require multiple isomerizations. The formation of the x2+• ion includes an endothermic dissociation in complex 5a which is kinetically hampered by the competing reverse formation of the serine β-radical 4a. The latter radical intermediate can undergo hydrogen transfer and backbone dissociation through TS7 forming the weakly bound complex 8a, which, in turn, can readily break apart to yield the m/z 315 ion (9a). The calculated thermochemical thresholds and rate-determining TS are compatible with the preferential formation of the m/z 315 ion relative to the x2+• ion. The z2+• ion (m/z 230) can be produced by loss of HN=C=O from the x2+• intermediate, but also by backbone cleavage in the m/z 370 ion, as evidenced by its MS4 spectrum (Figure S4a, Supplementary Data). The competition between the formation of the m/z 370 and m/z 315 ions is presumably due to the overall kinetics of consecutive and reverse steps on the pertinent PES (Figure 5). The PES leading to the m/z 370 ion includes TS that are at somewhat higher energies than those on the PES leading to the m/z 315 ion. However, the former PES has fewer steps which are barely reversible, so the overall kinetics is determined by the unidirectional reaction flux through TS8 and TS10. In contrast, the formation of the m/z 315 ion requires multiple reversible steps through TS1–TS3 to reach the key intermediate 4a. An exact evaluation of the energy-dependent branching ratios would require a complete analysis of the complex kinetic system using the calculated unimolecular rate constants. Although such calculations have been reported for peptide cation-radicals [19, 21, 23], the rate constants critically depend on the quality of the underlying potential energy surface. The calculated energies shown in Table 1 indicate a 7.1 kJ mol−1 root-mean square deviation (rmsd) between the entire B3-PMP2 and M06-2X data sets. The rmsd increases to 15.7 kJ mol−1 when only the TS transition energies are considered. These deviations are likely to affect the calculated rate constants, bringing uncertainty into the theoretically predicted branching ratios.
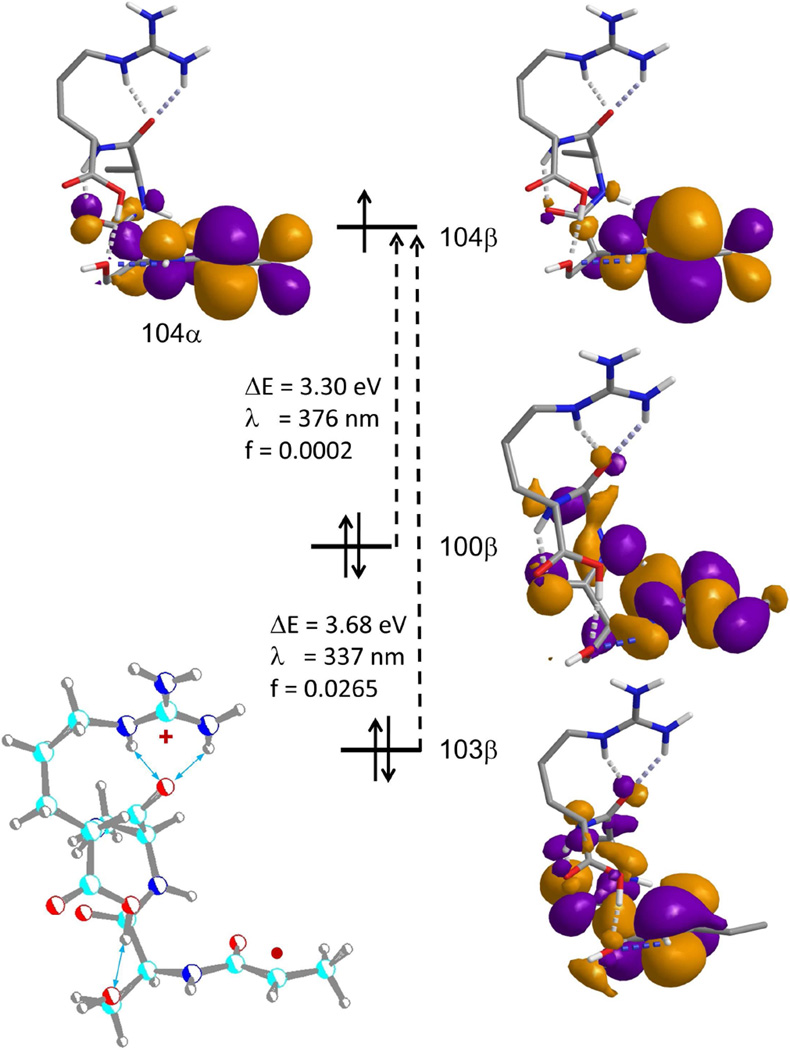
We also addressed the nature of the electronic transitions leading to absorption at 355 nm. Time-dependent DFT calculations [42] with M06-2X/6-311++G(2d,p) produced the excitation vectors and oscillator strengths for the lowest 15 transitions. The two lowest energy transitions occur in the region accessible by the 355 nm laser line, as depicted in Figure 6. The lowest-energy transition (λ = 376 nm) is due to a dipole forbidden excitation of an electron from an inner πy orbital to the semi-occupied pz orbital of the Cα radical. The next excitation (λ = 337 nm) concerns a dipole-allowed electron transfer from the N-terminal amide π orbital. This resembles an electron shift in the radical keto-enol system [21], where the electron excitation moves the spin density from the Cα-position to the amide oxygen. These excitations are localized within the amide Cα-radical group and can be expected to be also present in other peptide cation-radicals of the z+• type. Note that the peptides stored in the ion trap and subjected to photoexcitation have thermal internal energies, and so the UV absorption bands are likely to be broadened by the vibrational state population of the ground electronic state. Hence, the laser excitation wavelength does not have to fit the ion absorption maximum to cause photodissociation.
Figure 6.
Excited states of z4+• ion 1a from M06-2X/6-311++G(2d,p) TD-DFT calculations.
4. Conclusions
Energy-resolved CID, time-resolved IRMPD, and single-photon UVPD of z4+• ions from AASAR triggered several competitive dissociations consisting of loss of OH radical, water, and backbone cleavages involving the serine side chain. Comparison of slow-heating ion activation methods with single UV photon absorption allowed us to characterize the energy dependence of the competing dissociation channels and suggest plausible mechanisms. The finding that fragment ions generated by ETD of peptide ions are photoactive in the near UV region opens an avenue for further photodissociation structure studies of biomolecules.
Supplementary Material
Highlights.
Serine peptide cation-radicals of the z-type were studied
Energy-resolved collision-induced dissociations are reported
CID is compared withtime-resolved infrared multiphoton dissociation
z-type peptide cation-radicals undergo photodissociationat 355 nm
Structures and energies of intermediates and transition states were calculated
Acknowledgments
F. T. thanks the Chemistry Division of the National Science Foundation (Grant CHE-1055132) and the Klaus and Mary Ann Saegebarth Endowment for financial support. Research at the University of Wisconsin was supported by National Institutes of Health, grant R01 GM080148.
Footnotes
Publisher's Disclaimer: This is a PDF file of an unedited manuscript that has been accepted for publication. As a service to our customers we are providing this early version of the manuscript. The manuscript will undergo copyediting, typesetting, and review of the resulting proof before it is published in its final citable form. Please note that during the production process errors may be discovered which could affect the content, and all legal disclaimers that apply to the journal pertain.
Appendix A. Supplementary data
Supplementary material related to this article can be found in the online version at http://dx.doi.org/10.1016/j.ijms.2014
References
- 1.Yu W, Vath JE, Huberty MC, Martin SA. Anal. Chem. 1993;65:3015. doi: 10.1021/ac00069a014. [DOI] [PubMed] [Google Scholar]
- 2.Lee S-W, Kim HS, Beauchamp JL. J. Am. Chem. Soc. 1998;120:3188. [Google Scholar]
- 3.Qin J, Chait BT. J. Am. Chem. Soc. 1995;117:5411. [Google Scholar]
- 4.Vaisar T, Urban J. J. Mass Spectrom. 1996;31:1185. doi: 10.1002/(SICI)1096-9888(199610)31:10<1185::AID-JMS396>3.0.CO;2-Q. [DOI] [PubMed] [Google Scholar]
- 5.Tsaprailis G, Nair H, Zhong W, Kuppannan K, Futrell JH, Wysocki VH. Anal. Chem. 2004;76:2083. doi: 10.1021/ac034971j. [DOI] [PMC free article] [PubMed] [Google Scholar]
- 6.Savitski MM, Kjeldsen F, Nielsen ML, Zubarev RA. Angew. Chem. Int. Ed. 2006;45:5301. doi: 10.1002/anie.200601240. [DOI] [PubMed] [Google Scholar]
- 7.Xia Y, Gunawardena HP, Erickson DE, McLuckey SA. J. Am. Chem. Soc. 2007;129:12232. doi: 10.1021/ja0736764. [DOI] [PubMed] [Google Scholar]
- 8.Turecek F, Chung TW, Moss CL, Wyer JA, Ehlerding A, Holm AIS, Zettergren H, Nielsen SB, Hvelplund P, Chamot-Rooke J, Bythell B, Paizs B. J. Am. Chem. Soc. 2010;132:10728. doi: 10.1021/ja907808h. [DOI] [PubMed] [Google Scholar]
- 9.Turecek F, Panja S, Wyer JA, Ehlerding A, Zettergren H, Nielsen SB, Hvelplund P, Bythell B, Paizs B. J. Am. Chem. Soc. 2009;131:16472. doi: 10.1021/ja9050229. [DOI] [PubMed] [Google Scholar]
- 10.Chung TW, Tureček F. Int. J. Mass Spectrom. 2011;306:99. [Google Scholar]
- 11.Zubarev RA, Kelleher NL, McLafferty FW. J. Am. Chem. Soc. 1998;120:3265. [Google Scholar]
- 12.Syka JEP, Coon JJ, Schroeder MJ, Shabanowitz J, Hunt DF. Proc. Natl. Acad. Sci. U. S. A. 2004;101:9528. doi: 10.1073/pnas.0402700101. [DOI] [PMC free article] [PubMed] [Google Scholar]
- 13.Downard KM, Biemann K. J. Am. Soc. Mass Spectrom. 1993;4:874. doi: 10.1016/1044-0305(93)87005-W. [DOI] [PubMed] [Google Scholar]
- 14.Bilusich D, Bowie JH. Mass Spectrom. Rev. 2009;28:20. doi: 10.1002/mas.20206. [DOI] [PubMed] [Google Scholar]
- 15.Gatlin CL, Tureček F, Vaisar T. J. Mass Spectrom. 1995;30:1617. doi: 10.1002/jms.135. [DOI] [PubMed] [Google Scholar]
- 16.Liu J, Liang X, McLuckey SA. J. Proteome Res. 2008;7:130. doi: 10.1021/pr0703977. [DOI] [PubMed] [Google Scholar]
- 17.Xia Y, Han H, McLuckey SA. Anal. Chem. 2008;80:1111. doi: 10.1021/ac702188q. [DOI] [PubMed] [Google Scholar]
- 18.Swaney DL, McAlister GC, Wirtala M, Schwartz JC, Syka JEP, Coon JJ. Anal. Chem. 2007;79:477. doi: 10.1021/ac061457f. [DOI] [PMC free article] [PubMed] [Google Scholar]
- 19.Chung TW, Tureček F. J. Am. Soc. Mass Spectrom. 2010;21:1279. doi: 10.1016/j.jasms.2010.02.018. [DOI] [PubMed] [Google Scholar]
- 20.Chung TW, Hui R, Ledvina AR, Coon JJ, Turecek F. F. J. Am. Soc. Mass Spectrom. 2012;23:1336. doi: 10.1007/s13361-012-0408-9. [DOI] [PMC free article] [PubMed] [Google Scholar]
- 21.Ledvina AR, Chung TW, Hui R, Coon JJ, Turecek F. J. Am. Soc. Mass Spectrom. 2012;23:1351. doi: 10.1007/s13361-012-0409-8. [DOI] [PMC free article] [PubMed] [Google Scholar]
- 22.Turecek F, Julian RR. Chem. Rev. 2013;113:6691. doi: 10.1021/cr400043s. [DOI] [PubMed] [Google Scholar]
- 23.Ledvina AR, Coon JJ, Turecek F. F. Int. J. Mass Spectrom. 2014 doi: 10.1016/j.ijms.2014.02.015. xxx xxx (in press). [DOI] [PMC free article] [PubMed] [Google Scholar]
- 24.Vasicek LA, Ledvina AR, Shaw J, Griep-Raming J, Westphall MS, Coon JJ, Brodbelt JS. J. Am. Soc. Mass Spectrom. 2011;22:1105. doi: 10.1007/s13361-011-0119-7. [DOI] [PMC free article] [PubMed] [Google Scholar]
- 25.Ledvina AR, Beauchene NA, McAlister GC, Syka JEP, Schwartz JC, Griep-Raming J, Westphall MS, Coon JJ. J. J. Anal. Chem. 2010;82:10068–10074. doi: 10.1021/ac1020358. [DOI] [PMC free article] [PubMed] [Google Scholar]
- 26.Frisch MJ, Trucks GW, Schlegel HB, B H, Scuseria GE, Robb MA, Cheeseman JR, Scalmani G, Barone V, Mennucci B, Petersson GA, Nakatsuji H, Caricato M, Li X, Hratchian HP, Izmaylov AF, Bloino J, Zheng G, Sonnenberg JL, Hada M, Ehara M, Toyota K, Fukuda R, Hasegawa J, Ishida M, Nakajima T, Honda Y, Kitao O, Nakai H, Vreven T, Montgomery JA, Jr, Peralta JE, Ogliaro F, Bearpark M, Heyd JJ, Brothers E, Kudin KN, Staroverov VN, Kobayashi R, Normand J, Raghavachari K, Rendell A, Burant JC, Iyengar SS, Tomasi J, Cossi M, Rega N, Millam JM, Klene M, Knox JE, Cross JB, Bakken V, Adamo C, Jaramillo J, Gomperts R, Stratmann RE, Yazyev O, Austin AJ, Cammi R, Pomelli C, Ochterski JW, Martin RL, Morokuma K, Zakrzewski VG, Voth GA, Salvador P, Dannenberg JJ, Dapprich S, Daniels AD, Farkas O, Foresman JB, Ortiz JV, Cioslowski J, Fox DJ. Gaussian 09, Revision A.02. Wallingford CT: Gaussian, Inc.; 2009. [Google Scholar]
- 27.Becke AD. J. Chem. Phys. 1993;98:1372. [Google Scholar]
- 28.Becke AD. J. Chem. Phys. 1993;98:5648. [Google Scholar]
- 29.Zhao Y, Truhlar DG. Theor. Chem. Acc. 2008;120:215. [Google Scholar]
- 30.Møller C, Plesset MS. Phys. Rev. 1934;46:618. [Google Scholar]
- 31.Schlegel HB. J. Chem. Phys. 1986;84:4530. [Google Scholar]
- 32.Mayer I. Adv. Quantum Chem. 1980;12:189. [Google Scholar]
- 33.Tureček F. J. Phys. Chem. A. 1998;102:4703. [Google Scholar]
- 34.Polášek M, Tureček F. J. Am. Chem. Soc. 2000;122:9511. [Google Scholar]
- 35.Wolken JK, Yao C, Tureček F, Polce MJ, Wesdemiotis C. Int. J. Mass Spectrom. 2007;267:30–42. [Google Scholar]
- 36.Holm AIS, Hvelplund P, Kadhane U, Larsen MK, Liu B, Nielsen SB, Panja S, Pedersen JM, Skrydstrup T, Stochkel K, Williams ER, Worm ES. J. Phys. Chem. A. 2007;111:9641. doi: 10.1021/jp075943y. [DOI] [PubMed] [Google Scholar]
- 37.Jensen CS, Wyer JA, Houmoller J, Hvelplund P, Nielsen SB. Phys. Chem. Chem. Phys. 2011;13:18373. doi: 10.1039/c1cp21549c. [DOI] [PubMed] [Google Scholar]
- 38.Sun Q, Nelson H, Stolz B, Julian RR. J. Proteome Res. 2009;8:958. doi: 10.1021/pr800592t. [DOI] [PubMed] [Google Scholar]
- 39.Hao G, Gross SS. J. Am. Soc. Mass Spectrom. 2006;17:1725. doi: 10.1016/j.jasms.2006.07.026. [DOI] [PubMed] [Google Scholar]
- 40.Tureček F, Syrstad EA, Seymour JJ, Chen X, Yao C. J. Mass Spectrom. 2003;38:1093. doi: 10.1002/jms.527. [DOI] [PubMed] [Google Scholar]
- 41.Pepin R, Laszlo KJ, Peng B, Marek A, Bush MF, Tureček F. Phys. Chem. A. 2014;118:308–324. doi: 10.1021/jp411100c. [DOI] [PubMed] [Google Scholar]
- 42.Furche F, Ahlrichs A. J. Chem. Phys. 2002;117:7433–7447. [Google Scholar]
Associated Data
This section collects any data citations, data availability statements, or supplementary materials included in this article.


