

Abstract
Targeted drug delivery using epidermal growth factor peptide-targeted gold nanoparticles (EGFpep-Au NPs) is investigated as a novel approach for delivery of photodynamic therapy (PDT) agents, specifically Pc 4, to cancer. In vitro studies of PDT show that EGFpep-Au NP-Pc 4 is twofold better at killing tumor cells than free Pc 4 after increasing localization in early endosomes. In vivo studies show that targeting with EGFpep-Au NP-Pc 4 improves accumulation of fluorescence of Pc 4 in subcutaneous tumors by greater than threefold compared with untargeted Au NPs. Targeted drug delivery and treatment success can be imaged via the intrinsic fluorescence of the PDT drug Pc 4. Using Pc 4 fluorescence, it is demonstrated in vivo that EGFpep-Au NP-Pc 4 impacts biodistribution of the NPs by decreasing the initial uptake by the reticuloendothelial system (RES) and by increasing the amount of Au NPs circulating in the blood 4 h after IV injection. Interestingly, in vivo PDT with EGFpep-Au NP-Pc 4 results in interrupted tumor growth when compared with EGFpep-Au NP control mice when selectively activated with light. These data demonstrate that EGFpep-Au NP-Pc 4 utilizes cancer-specific biomarkers to improve drug delivery and therapeutic efficacy over untargeted drug delivery.
1. Introduction
According to estimates in 2012 by the National Cancer Institute, approximately 13.7 million people in the United States either have or survived cancer, and the overall lifetime risk of developing cancer is one in two for men and one in three for women.[1] Half a million people with cancer will die each year with an estimated yearly healthcare-associated cost of $201.5 billion.[1] Therefore, significant advances in both detection and treatment of cancer are absolutely necessary.
Of the many types of cancer, malignant glioma is among the deadliest forms: patients have a life expectancy of a little over a year, and those with recurring brain cancer survive less than 20 weeks.[2–4] The most common treatment involves surgical resection of the tumor followed by concomitant chemo-radiation and administration of temozolomide.[5,6] This treatment scheme can lead to systemic toxicity such as myelosuppression.[5–7] Therefore, there is a need for delivering therapeutics that can preferentially accumulate within the brain tumor and avoid normal brain tissue.[7]
Even though surgical resection of brain tumors remains the mainstay of treatment, most cases show that curative resection is not possible due to infiltrating growth of the tumor into normal brain parenchyma.[8] Photodynamic therapy (PDT) has been developed as an additional therapy to enhance surgical efficacy. Most PDT drugs have distinct fluorescence, which allows the drug's biodistribution to be tracked using optical imaging. This characteristic was exploited by Stummer et al.[9] to guide surgical resection of brain tumors. They have demonstrated that the PDT agent 5-aminolevulinic acid (5-ALA) leads to intracellular accumulation of fluorescent porphyrins, which can be used to monitor brain tumor margins, guide more complete surgical resections, and can be used for PDT of gliomas.[9,10]
Previous studies have shown that PDT drugs can induce DNA damage via peroxidation of unsaturated lipids and damage organelles such as mitochondria through the formation of reactive oxygen species [11–15] and also induce systemic antigen-specific, antitumor immune responses.[16] However, due to their hydrophobicity PDT agents exhibit poor solubility and are difficult to administer systemically.[17–20] Drug administration often requires scheduling one to several days prior to light therapy to allow both maximum accumulation in the tumor and for clearance in background tissues to occur.[21] A delivery design that can solubilize and systemically circulate the active drug payload while simultaneously providing specific uptake into tumors and clearance from the body would be ideal for PDT and could be used to impact surgical resections of brain tumors.[22,23]
Gold nanoparticles (Au NPs) have recently gained attention as suitable delivery platforms for hydrophobic drugs.[24–31] Au NPs can be designed to be small enough to pass through the blood–brain–tumor barrier (BBTB), to be excreted from the body, and to provide excellent biocompatibility; therefore, Au NPs provide an excellent alternative for delivery of drugs to brain tumors.[7,22,32–34] Both covalent and non-covalent drug delivery methods have been reported that take advantage of particle accumulation in solid tumors through the enhanced permeability and retention (EPR) effect.[22,31,32,35–38] Additionally, biocompatible surface coatings such as polyethylene glycol (PEG) provide a protective shell that increases hydrophilicity and biocompatibility, which can postpone or prevent the rapid clearance by the reticuloendothelial system (RES).[22,39–41] The PEG coating can be further functionalized with peptide sequences for active targeting.[40]
Targeted delivery offers the opportunity to increase the PDT efficacy to the cancer cells and minimize potential side effects to healthy tissues.[2,42] It is also known that transport across the BBTB can be assisted by the addition of targeting moieties such as the epidermal growth factor receptor (EGFR), which is commonly overexpressed in numerous cancers, including brain cancer.[2,7,40]
Our group has pioneered the use of Au NPs to deliver Pc 4, a second generation photosensitizer. We have previously demonstrated the first example of in vivo Pc 4 drug delivery and therapy using untargeted PEGylated Au NPs and were the first to show that these NPs could target Pc 4 to orthotopic brain tumors in a mouse model of glioblastoma multiforme (GBM).[22,23,43]
Here, we show in vitro studies that suggest the drug is released into cancer cells in a ligand-dependent manner, which also results in differences in intracellular Pc 4 accumulation and an enhanced PDT effect.[44] These differences apparently extend to in vivo studies by altering biodistribution of the targeted NPs. Finally, we demonstrate the efficacy of Pc 4-loaded targeted gold NPs as a PDT agent in vivo. By employing EGF peptide-modified Au NPs in combination with the PDT drug Pc 4, we are able to achieve targeting and therapy in subcutaneous tumor-bearing mice.
2. Results and Discussion
As shown in Figure 1A, 5-nm Au NPs are coated with PEG that increases biocompatibility of the particles while also allowing attachment of the EGF peptide. This arrangement creates a “sink” for hydrophobic Pc 4 molecules, which are noncovalently adsorbed onto the Au NP surface theoretically allowing release of intact active Pc 4 upon interaction with target cells and tissues. Our first step in these studies was to examine the uptake and accumulation of Pc 4 delivered by EGFpep-Au NP-Pc 4 or untargeted Au NP-Pc 4 in 9L.E29 cells, a cell line that overex-presses EGFR, the target for the peptide-modified NPs.
Figure 1.
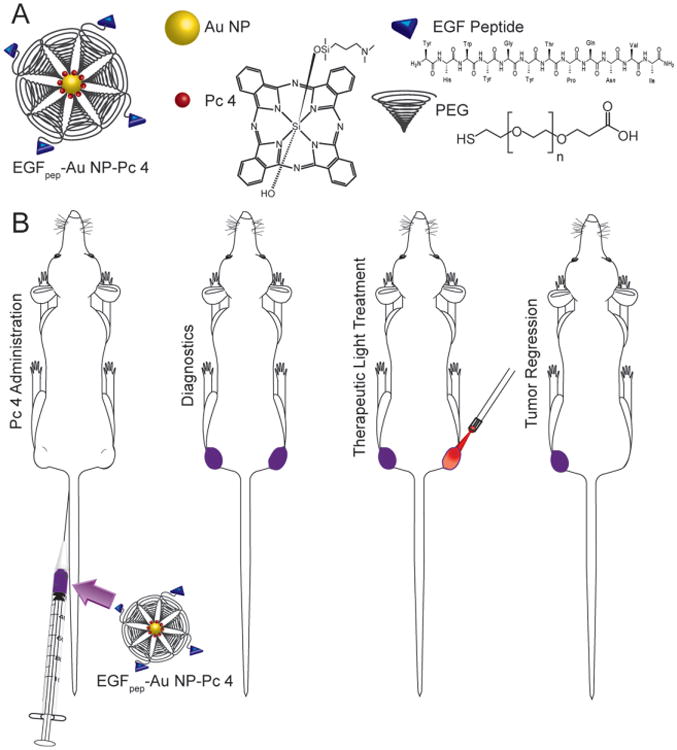
A) Diagram of the construction of EGFpep-Au NP-Pc 4. B) Procedure for photodynamic therapy with EGFpep-Au NP-Pc 4 using 672 nm laser light.
We have reported that Pc 4 which remains associated with the NP does not fluoresce due to quenching by the Au NP, likely resulting in inactivation of the PDT qualities of the drug. Furthermore, we have demonstrated consistently a good correlation between Pc 4 fluorescence and PDT efficacy here and in previous studies.[22,23,32,43] Therefore, to visualize release of active Pc 4 into cells we utilized fluorescence microscopy. Our first step in these studies was to investigate targeted NP delivery of free Pc 4 to cells in vitro. Fluorescence microscopy showed minimal cellular uptake of free Pc 4 delivered by Au NP-Pc 4 over a 24-h period (Figure 2A, left column), but significant uptake of free Pc 4 from EGFpep-Au NP-Pc at 4 and 24 h after incubation (right column). Preincubation with increasing concentrations of free EGF peptide (Figure S1, Supporting Information) suggested that EGFpep-Au NP-Pc 4 interacted with EGFRs to deliver increased amounts of Pc 4 via a ligand-dependent process.
Figure 2.
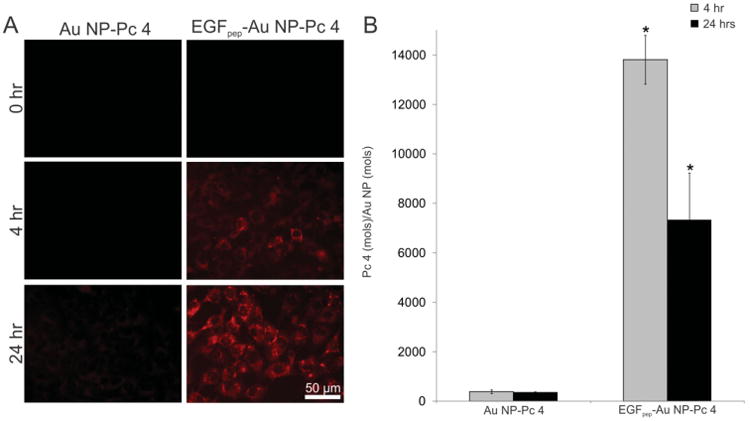
A) 9L.E29 cells were incubated with either EGFpep-Au NP-Pc 4, or Au NP-Pc 4 for 4 or 24 h and representative epi-fluorescence images were taken. Scale bars represent 50 μm. B) Pc 4 in the cells was extracted and quantified by UV–vis spectroscopy and calculated per mole of Au NP quantified by GFAAS analysis. Targeted Au NPs deliver more free Pc 4 per Au NP to cells than untargeted Au NPs, resulting in higher cell associated fluorescence by fluorescence microscopy. All graphical values are expressed as an average with error bars representing ±SD and N = 3 for each condition. Asterisks indicate statistical significance of the ratio of Pc 4 per Au NP from cells incubated with Au NP-Pc 4 with p values < 0.05 considered statistically significant.
We next quantified the total Au and Pc 4 (free and NP bound) associated with these cells by extraction of the cells as described previously in Cheng et al.[32] Extraction and quantification of both elemental gold and Pc 4 showed that delivery of Pc 4 by EGFpep-Au NP-Pc 4 produced an overall 35-fold increase of the amount of Pc 4 per Au NP delivered to cancer cells after 4 h (Figure 2B). Interestingly, similar amounts of total Pc 4, measured by chemical extraction of both free and Au NP-bound Pc 4, were observed when Pc 4 was delivered with either targeted or nontargeted NPs, with however, less cell associated Au NP accumulated when the delivery system was targeted to the EGFR (Figure S2, Supporting Information). This is not evident from fluorescence microscopy and suggests that targeting Pc 4 delivery with EGF-Au NPs significantly impacts the mechanism by which Pc 4 is delivered to the cells. Therefore, we hypothesize that delivering Pc 4 with the multivalent EGFpep-Au NP-Pc 4 serves to cause an interaction with the cells that allows for more robust release of free Pc 4 from NPs into cells. This results in the delivery of more free Pc 4 with less Au NP accumulation within the cells. We are currently investigating the mechanisms behind this hypothesis.
To determine subcellular localization of Pc 4 delivered from targeted NPs, we treated cells overexpressing EGFRs with either EGFpep-Au NP-Pc 4 or free Pc 4 (1 × 10⁻⁶ m), counterstained with antibodies against the discrete organelles of the cell, and visualized the co-localization using confocal fluorescence microscopy (Figure 3A). Free Pc 4 is known to localize mainly in mitochondria with some additional localization within lysosomes as confirmed here.[44] However, in cells treated with EGFpep-Au NP-Pc 4, more Pc 4 also localized within the early endosomes.[23]
Figure 3.
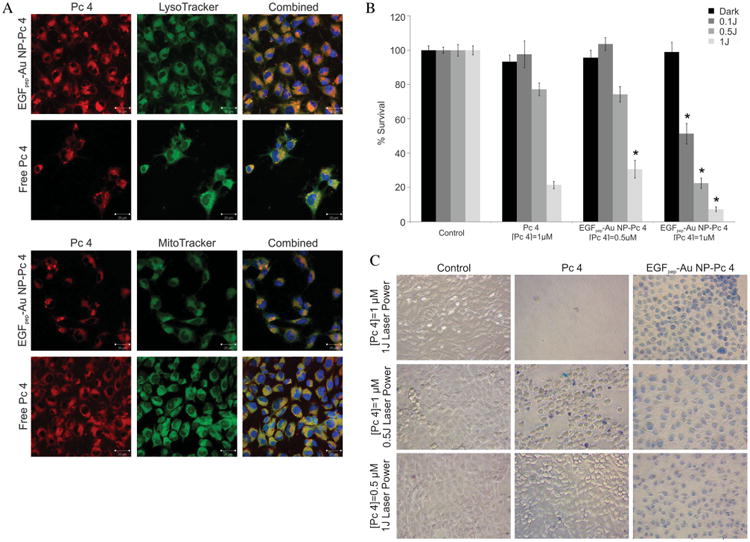
A) 9L.E29 cells were incubated with EGFpep-Au NP-Pc 4 or free Pc 4 [1 × 10⁻⁶ mol L−1 Pc 4] and counterstained with LysoTracker (lysosomes), or MitoTracker (mitochondria), and imaged with a laser scanning confocal microscope. Scale bars represent 20 μm. B) MTT assay shows cytotoxicity associated with EGFpep-Au NP-Pc 4 or free Pc 4 in the dark and under different light exposures. Percent survival was normalized to the control cells. All graphical values are expressed as an average with error bars representing ±SD and N = 12 for each condition. Asterisks indicate statistical significance of the percent survival of EGFpep-Au NP-Pc 4 incubated cells compared with cells incubated with free Pc 4 [1 × 10⁻⁶ mol L−1 Pc 4] with p values <0.05 considered statistically significant. C) A cell viability assay (Trypan blue staining) shows cytotoxicity associated with EGFpep-Au NP-Pc 4 or free Pc 4 under different light exposures and different concentrations of Pc 4. Images taken with a Leica DMIL inverted microscope with a 20× objective and a Nikon Coolpix 8400 camera.
We next determined the efficacy of the Pc 4 delivered to the cells by EGFpep-Au NP-Pc 4 by exposing them to light at the appropriate wavelength to activate Pc 4 and by varying both Pc 4 concentration and light fluency added to the cells. The dark toxicity and phototoxicity was evaluated by a MTT assay (Figure 3B). In the absence of light (dark toxicity), no cellular killing was observed during the incubation with either free Pc 4 or EGFpep-Au NP-Pc 4. However, when exposed to 1 J cm2 light over 90% of the cells treated with EGFpep-Au NP-Pc 4 ([Pc 4] = 1 × 10⁻⁶ m) were destroyed, greater than that observed for free Pc 4. The PDT effect of EGFpep-Au NP-Pc 4 on the cells could even be obtained at a very low fluence with nearly 50% of the cancer cells being killed at 0.1 J cm2 irradiation. At this fluence of light, free Pc 4 did not cause phototoxicity. We also varied the concentration of Pc 4 in the free form or delivered by targeted NPs. At 1 J cm2 light, EGFpep-Au NP-Pc 4 had the same phototoxic efficiency of free Pc 4 but at half the concentration of Pc 4 (0.5 × 10⁻⁶ m) (Figure 3B). This suggests that EGFpep-Au NP-Pc 4 maintains the PDT effect of Pc 4 at half the drug concentration, or improves the PDT effect at half the power of laser illumination and therefore is a more effective way to deliver the agent.
Cell viability assays using Trypan blue for EGFpep-Au NP-Pc 4-treated cells further illustrated this point (Figure 3C), showing not only an increase in the number of stained, dead cancer cells but also possibly different pathways of cell death. At 1 × 10⁻⁶ m of Pc 4 and 1 J cm2 of light, free Pc 4 caused most cancer cells to die very quickly and to lose adherence to the plate. The cancer cells incubated with EGFpep-Au NP-Pc 4 seemed to undergo a slower cell death causing the cells to swell, remain adherent to the plate, and stain uniformly with membrane-impermeant Trypan blue stain. At lower light fluency and concentrations of Pc 4, EGFpep-Au NP-Pc 4 was more effective at causing cell death. These data suggest that the delivery method and the resulting altered location within the cells significantly impact the efficacy of Pc 4 PDT.
Next, the biodistribution and clearance of both free Pc 4 and gold NPs resulting from IV administration of either Au NP-Pc 4 or EGFpep-Au NP-Pc 4 was evaluated in vivo over a 7 d period. Biodistribution of free Pc 4 and Au NPs delivered by EGFpep-Au NP-Pc 4 in vivo was visualized and quantified by quantitative fluorescence imaging (for free Pc 4) and graphite furnace atomic absorption spectroscopy (GFAAS) analysis (for Au NPs) of ex vivo dissected organs (Figure 4A). No untoward effects were observed in the animals as monitored by behavior and general appearance.
Figure 4.
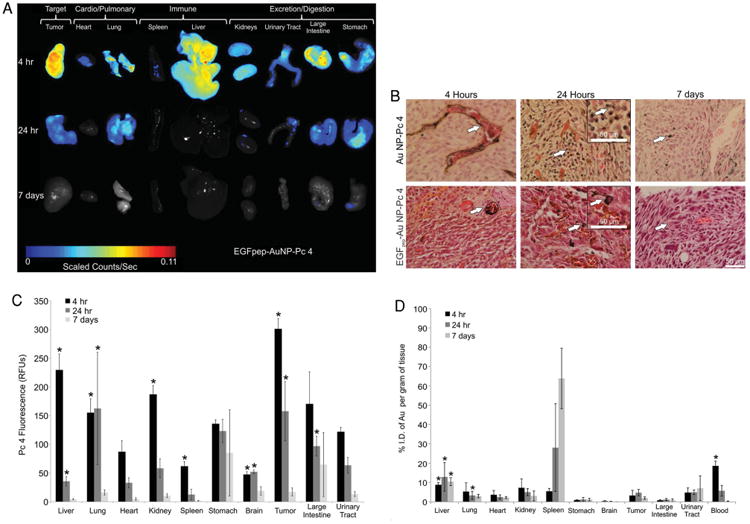
Mice were injected with Au NP-Pc 4 or EGFpep-Au NP-Pc 4 [1 mg kg−1 Pc 4], euthanized at 4 h, 24 h, or 7 d postinjection. Corresponding organs were dissected. A) Fluorescence imaging of ex vivo organs from mice injected with EGFpep-Au NP-Pc 4. Images were scaled evenly and overlayed on corresponding black and white pictures followed by cropping and reorganization to form Figure 4 A. B) Silver enhanced staining of ex vivo tumors for visualization of Au NPs. Scale bars represent 50 μm. Arrows point out silver-stained Au NPs. C) Ex vivo fluorescence biodistribution analysis for free Pc 4 content of EGFpep-Au NP-Pc 4 injected mice (in average RFUs); N ≥ 3. D) Ex vivo Au NP biodistribution, GFAAS analysis for Au NP content (%I.D. per gram of tissue) of EGFpep-Au NP-Pc 4 injected mice; N ≥ 3. All graphical values are expressed as an average with error bars representing ±SD. Asterisks indicate statistical significance of either average RFU (C) or %I.D. per gram of tissue (D) from Au NP-Pc 4-injected mice with p values <0.05 considered statistically significant.[43]
In previous studies, examining Pc 4 fluorescence from mice treated with untargeted Au NP-Pc 4 showed accumulation of Pc 4 in the large intestines, stomachs, and excretory tracts as early as 4 h after administration.[43] In comparison, when EGFpep-Au NP-Pc 4 was administered to animals, Pc 4 was differentially accumulated in the tumor and liver (Figure 4A). The presence of Au NPs in the tumor tissues was visualized using silver and H&E staining: 4 h after EGFpep-Au NP-Pc 4 administration, Au NPs were observed in livers and spleens (Figure S3, Supporting Information). Similar to untargeted Au NP-Pc 4, the Au NPs delivered by EGFpep-Au NP-Pc 4 were found to accumulate around the vasculature of the tumor at 4 h postinjection (Figure 4B). In contrast, at 24 h postinjection EGFpep-Au NP-Pc 4 showed an accumulation of Au NPs around the cancer cells' membranes in the tumor, while nontargeted NPs did not (Figure 4B). By 7 d postinjection, very few Au NPs were found in tumor tissues or surrounding vasculature for both targeted and untargeted NPs (Figure 4B).
Quantification of free Pc 4 and Au NPs for both targeted and untargeted NPs delivered to tissues revealed that the accumulation and kinetics varied for the two delivery methods.[43] For Pc 4 delivered by targeted NPs, there was a rapid accumulation of the drug at all sites tested with significant clearance by day 7 (Figure 4C). After 24 h, the fluorescence decreased significantly in all of the organs and 7 d after the injection, no obvious fluorescence could be observed, which indicated rapid excretion of the drug from the body. In contrast, Au NPs delivered by targeted NPs showed little uptake in stomachs, brains, and large intestines, and displayed clearance in most tissues by day 7 for both targeted and untargeted NPs (Figure 4D). Interestingly, however, spleens and urinary tracts showed an accumulation of the targeted NPs over time that was similar to that demonstrated previously for untargeted NPs, suggesting that these organs provide a robust clearance mechanism for both NP types (Figure 4D and Figure S3, Supporting Information).[43]
Comparison of the blood levels of gold for the targeted (Figure 4D and Figure S4, Supporting Information) to that measured previously for untargeted NPs at 4 h indicated that the targeting peptide altered blood clearance with 18.6% I.D. of Au mL−1 for EGFpep-Au NP-Pc 4 versus 12.1% I.D. of Au mL−1 for Au NP-Pc 4 remaining in the blood (p < 0.05).[43] These values were associated with differences in liver and spleen uptake: 14.2% I.D. of Au g−1 of the targeted Au NPs was taken up by the liver and the spleen (Figure 4D) versus 24.8% I.D. of Au g−1 of the untargeted Au NPs (p < 0.05), suggesting that targeting increased blood-retention of the Au NPs.[43]
While Au NPs were found in excretion organs such as the kidney, urinary tract, large intestine, and stomach, the Au NPs were also found in the urine and feces samples from the mice injected with EGFpep-Au NP-Pc 4 (Figure S4, Supporting Information). Urine content reflected blood content of the targeted NPs. A significant portion of the Au NPs remained circulating in the blood 4 h postinjection (18.6% I.D. of Au mL−1) and 4.9% I.D. of Au mL−1 of sample was detected in the urine. As the targeted NP accumulation in the blood dropped to 0.2% I.D. of Au mL−1 after 7 d, the Au NP accumulation in the urine decreased as well to 1.8% I.D. of Au mL−1 of sample. This indicated that the targeted NPs could be excreted by renal clearance, and that the clearance rate was correlated to the circulation of the Au NPs in the body. The existence of Au NPs in the stomach and large intestine indicated another important excretion pathway evidenced by an increase in the amount of Au NPs in the feces samples at 24 h.
To study how the differences in biodistribution between targeted and untargeted Au NPs affected PDT, animals were dosed with 1 mg kg−1 [Pc 4] of either targeted NPs with drug, untargeted NPs with drug or targeted NPs without drug and the effect on tumor growth was assessed by irradiating animals with light (150 J cm−2) 4 h after IV administration (Figure 5). (The time course for irradiation was empirically determined from Figure S5, Supporting Information.) For both targeted and untargeted NP delivery of Pc 4, the light-treated tumors showed immediate loss of fluorescence due to photobleaching of Pc 4 (Figure 5A). Swelling occurred within minutes around the treated site for both modes of Pc 4 delivery (Figure 5B,C). Between 24 h and 7 d, after both drug and light treatment tumors showed visible signs of tissue damage (Figure 5C).
Figure 5.
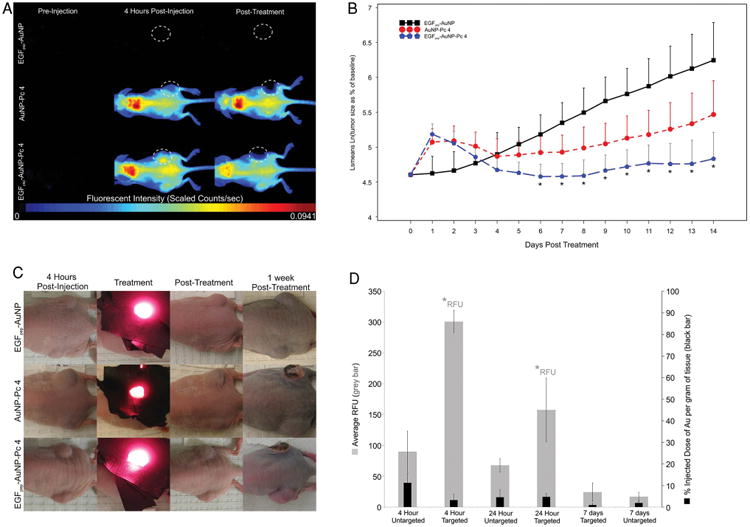
Mice were injected with either EGFpep-Au NP, Au NP-Pc 4, or EGFpep-Au NP-Pc 4 [1 mg kg−1 Pc 4] and treated 4 h later with 672 nm laser light (150 J cm−2). A) Representative fluorescence images of EGFpep-Au NP, Au NP-Pc 4, and EGFpep-Au NP-Pc 4-injected mice selected from original groups of N ≥ 3. The high fluorescence in the upper back of the animal is likely due to accumulation in the fatty region of the neck. White, dotted-lined circles show tumors that underwent PDT. B) Graph shows statistical summary of treatment study, y-axis is natural logarithm of tumor volume as a percent of original tumor volume and x-axis is time in days. Treatment occurs on day 0 at 4 h postinjection. All graphical values are expressed as an average with error bars representing 95% confidence intervals. Asterisks indicate statistical significance between mice treated with EGFpep-Au NP-Pc 4 or EGFpep-Au NP. C) Photographs of EGFpep-Au NP, Au NP-Pc 4, and EGFpep-Au NP-Pc 4-injected mice, before, during, immediately after, and 1 week after PDT treatment with laser light. Representative images were chosen from original groups of N ≥ 3 and are the same mice that appear in A (top left panel). D) Ex vivo tumor tissues were analyzed for free Pc 4 content by fluorescence imaging and for Au NP content by GFAAS; N ≥ 3. Graph shows Pc 4 fluorescence (RFU) and %I.D. of Au per gram of tissue in 9L.E29 tumors for EGFpep-Au NP-Pc 4 over time. The biodistribution for nontargeted NPs was determined earlier and a comparison to targeted NP biodistribution is derived here.[43] All graphical values are expressed as an average with error bars representing ±SD. Asterisks indicate statistical significance of either average RFU or %I.D. of Au per gram of tissue (as indicated) from Au NP-Pc 4-injected mice with p values <0.05 considered statistically significant.[43]
Only targeted delivery of Pc 4 yielded a statistically significant effect on the EGFR expressing tumors, decreasing their growth over the tested period compared with control-treated animals (EGFpep-Au NP-Pc 4 vs EGFpep-Au NP), Figure 5B. However, although the targeted delivery of Pc 4 consistently resulted in a decrease in tumor size compared with nontargeted delivery of Pc 4 (blue circles compared with red circles), this difference did not reach statistical significance. These results were in contrast to those observed in vitro, where cytotoxicity was statistically significant between targeted and untargeted delivery of Pc 4 (Figure S7, Supporting Information).
The significant difference in PDT efficacy between EGF-Au NP (control) and targeted delivery underscores the potency of Pc 4 delivered to tumors and indicates that light irradiation alone does not affect tumor growth or surrounding tissues, e.g., skin. The trend and lack of statistical significance between the PDT efficacy of targeted and untargeted NPs suggests that EPR may play a significant role in delivering these NPs to the tumors. Therefore, the 1 mg kg−1 dose of Pc 4 administered in these studies achieves near max therapeutic levels of Pc 4 within cells without dependence on targeting, i.e., nontargeted NPs achieve a close to maximum effective dose of the Pc 4 at the concentration administered. Since results confirmed that EGFpep-Au NP-Pc 4 showed a 3.3-fold increase in the amount of free Pc 4 delivered to the tumor in comparison to Au NP-Pc 4 as shown in the ex vivo tumor analysis (Figure 5D), it is likely that doses of NPs less than 1 mg kg−1 [Pc 4] might create a statistically significant therapeutic window for these agents. To test this, we conducted preliminary experiments to compare the delivery of lower doses of Pc 4 by targeted and untargeted NPs. Mice were injected with 0.5 mg kg−1 [Pc 4] of the particles and treated with a light dosage of 50 J cm−2. Necrosis was observed within the targeted tumors after resection and histologic staining, which was not observed for the untargeted tumors (Figure S6, Supporting Information). These preliminary results suggested that lower drug doses could be more effectively delivered by the targeted NPs and achieve a therapeutic effect not obtainable with untargeted NPs. Together, these results suggest that targeting Au NPs with EGF peptides serves to cause an interaction with the tumor cells that allows for a more robust transfer of Pc 4 into the tumor causing enhanced drug delivery and potentially efficacy. Further studies are now underway to fully understand the dose-response relationship for this delivery system.
3. Conclusions
Au NPs as delivery vehicles for noncovalently adsorbed drugs present a novel way to deliver hydrophobic drugs into tumor cells without requiring cellular uptake of the Au NPs.[22,23,32,43] Targeted NPs showed improvement over this system by taking advantage of ligand-dependent delivery. In vitro these targeted NPs resulted in decreased cellular uptake of Au NPs and, interestingly, an increase in free Pc 4 uptake in cancer cells. This delivery mechanism presumably served to present the targeted NPs to the cells, allowing them to adhere to the membranes of cells for longer periods of time resulting in increased amounts of Pc 4 delivered to tumor cells. We hypothesize that drug transfer is mediated by a hydrophobic interaction, whereby the cell membrane acts as a hydrophobic “sink” sequestering Pc 4 from the NPs that remain momentarily attached to the cell membrane. Targeting NPs to EGFRs also altered Pc 4 location within the cells including sequestration of the drug into early endosomes and improved delivery to lysosomes. This resulted in greater efficacy demonstrated by a reduction in the drug or light dosage needed to kill the cancer cells in comparison to free drug, consistent with previous reported results.[44] When EGFpep-Au NP-Pc 4 was administered in vivo, the Au NPs were targeted to EGFRs and the biodistribution of both Au NPs and Pc 4 was altered, while still allowing the Au NPs to be eventually excreted from the body. Targeted Au NPs were retained in the blood for longer, presumably increasing the exposure of tumor tissues to Pc 4 and ultimately leading to an enhanced in vivo drug uptake, and show a significantly enhanced PDT effect over mice treated with targeted NPs that do not contain Pc 4. Further work investigating how targeted NP delivery alters cellular distribution is now underway.
These results indicated that targeting Pc 4 to cancer-specific biomarkers gave better control over the bioavailability of Pc 4 and the release of Pc 4 into tumors. This will be of importance when transitioning to use EGFpep-Au NP-Pc 4 for treatment of orthotopic tumors, especially for postoperative tumor margin identification and destruction. Overall, the use of EGFpep-Au NP-Pc 4 resulted in an increased therapeutic efficacy in tumors in vivo. However, the effects on efficacy of variations in both light fluence and Pc 4 concentrations will need to be optimized going forward.
4. Experimental Section
Synthesis of Pc 4
Pc 4 was prepared as described earlier.[45]
Synthesis of the EGF Peptide YHWYGYTPQNVI-amide
The EGF peptide (YHWYGYTPQNVI-amide) was synthesized manually using Fmoc-protected amino acids (Peptides International, Louisville, KY) on Rink-amide CLEAR resin (Peptides International, Louisville, KY, 100–200 mesh size, 0.4 milliequiv. g−1) as previously reported.[23,46,47]. Fmoc amino acids (3 equiv.) were coupled to the elongating chain with HCTU (1H-benzotriazolium-1-[bis (dimethylaminomethylene)]-5-chlorohexafluorophosphate-(1-),3-oxide) (3 equiv.), 6-Cl-HOBt (1-hydroxy-6-chlorobenzotriazole) (3 equiv.), and diisoprorpylethylamine (DIPEA, 6 equiv.) in DMF (N′, N′-dimethylformamide). Fmoc-deprotection was achieved with 20% piperidine/DMF for 5 min incubation followed by 15 min incubation. Each coupling and deprotection cycle was followed by sequential washes with DMF (2 × 5 min), isopropanol (IPA, 1 × 5 min), and finally with methylene chloride (3 × 5 min). Each coupling and Fmoc-deprotection reactions were monitored with ninhydrin tests. Discrete polyethylene glycol units at the N-terminal end were introduced using Fmoc-8-amino-3,6-dioxaoctanoic acid (Peptides International). The peptides were labeled with biotin on-resin with biotin- N-hydroxysuccinimide (Chem-Impex International, Wood Dale, IL; 2 equiv.) and DIPEA (4 equiv.) for 1 h in DMF. The global orthogonal deprotection and cleavage from resin was achieved with incubation of dry resins in 95% trifluoroacetic acid (TFA), 2.5% water, and 2.5% triisopropylsilane for 3 h. The peptides were isolated with cold ether precipitation and centrifugation. The crude peptides were purified using reverse phase HPLC through a C-18 column (Luna, 5 micron, 100 A mesh, 250 mm × 10 mm, Phenomenex cat. no. 00G-4252-N0) against a linear gradient of 5%–90% or 20%–60% acetonitrile against 0.1% trifluoroacetic acid in water at a flow rate of 2.5 mL min−1. Isolated peaks were frozen and lyophilized to white flocculent powder. The peptides were characterized using MALDI mass spectrometry. Calculated for C75H98N18O10, expected molecular weight 1539.69; found 1540.12 [M+H]+.
Synthesis and Characterization of EGFpep-Au NP-Pc 4
Characterization of our targeted nanoparticle systems was presented previously.[23] Au NPs were synthesized based on a modified Brust–Schiffrin method.[48,49] The NPs were etched and shielded by the mixture of mPEG-SH (MW 5000) and HS-PEG-COOH (MW 3000) with 4:1 mole ratio for 48 h. The carboxyl-functionalized Au NPs were purified by centrifugation with 100 000 Dalton molecular weight cutoff filtration membranes.
The EGF peptide was attached on the carboxyl-functionalized NP surface through the amide bond. –COOH groups on the Au NPs were activated with EDC (1-ethyl-3-[3 dimethylaminopropyl] carbodiimide) and Sulfo-NHS (N-hydroxysulfosuccinimide) in MES [2-(morpholino) ethanesulfonic acid] buffer at pH 4.7 for 15 min at room temperature. Then, the buffer pH was increased immediately above 7 using concentrated PBS (phosphate-buffered saline). The Sulfo-NHS-activated NPs were well mixed with the EGF peptide at 1:1 mole ratio for 4 h at room temperature. Excess reactants were separated from the EGF peptide-functionalized Au NPs (EGFpep-Au NP-Pc 4) by centrifugation with 50 000 Dalton molecular weight cutoff membranes.
The purified EGFpep-Au NP-Pc 4 NPs were redissolved in chloroform and a 40-fold excess Pc 4 was added into the solution. After 48 h mixing at room temperature, the solvent was removed under vacuum. EGFpep-Au NP-Pc 4 NPs were suspended in aqueous solution and purified by centrifugation and 200 nm pore filters. EGFpep-Au NP-Pc 4 NPs were characterized by UV–vis spectroscopy, fluorescence spectroscopy, gel electrophoresis, DLS, and TEM. EGFpep-Au NP-Pc 4 NPs were characterized and were found to contain ≈30 Pc 4 molecules and ≈20 peptides per Au NP.[23]
Quantification of the Cellular Uptake of Au NPs and Pc 4
9L.E29 cells were cultured in 60 mm × 15 mm cell culture dishes and incubated with EGFpep-Au NP-Pc 4 or Au NP-Pc 4 conjugates for both 4 and 24 h, with three dishes per condition for each time point. The unbound conjugates were removed by three washes with PBS. Cells were removed by 0.25% trypsin–EDTA solution and the pellets were collected after centrifugation and counted. Pc 4 in the cells and from the bound or internalized Au NPs was extracted by ethyl acetate and quantified by UV–vis spectroscopy. After digesting the cells with 70% HNO3, internalized Au NPs were quantified by GFAAS, as previously reported.[43]
Cell Confocal Imaging Studies
9L.E29 cells were seeded on coverslips and incubated with EGFpep-Au NP-Pc 4 or free Pc 4 at 1 × 10⁻⁶ mol L−1 of Pc 4. For the LysoTracker and MitoTracker studies, live cells were washed three times with PBS, and stained with either LysoTracker (Invitrogen: Grand Island, NY; cat. no. L7526; 75 × 10−9 m) or MitoTracker (Invitrogen: Grand Island, NY; cat. no. M7514; 100 × 10−9 m) for 30 min. After staining, cells were washed three times with PBS and fixed using 2% paraformaldehyde and 0.1% glutaraldehyde in PBS. The coverslips were then mounted with aqueous mounting solution (containing DAPI). A laser scanning confocal microscopy setup (Zeiss; LSM 510 META) was used to capture the LysoTracker and MitoTracker fluorescent images.
Cell Viability and Phototoxicity of the EGFpep-Au NP-Pc 4
The average cell viability in the dark and under light exposure was evaluated by the MTT assay (Cell Proliferation Kit I by Roche) and visualized with a Trypan blue assay.[23] 9L.E29 rat glioma cancer cells engineered to overexpress EGFR were added 10 000 per well in three 96-well plates and incubated for 24 h at 37°C and 5% CO2. EGFpep-Au NP-Pc 4 and Pc 4 were incubated with the cells in the dark for 4 h at two different concentrations of 0.5 × 10⁻⁶ m and 1 × 10⁻⁶ m. After three times wash, one plate was put in the dark. The other two plates were irradiated under the light (>550 nm) at 0.5 and 1 J cm−2, respectively. These plates were incubated for another 24 h in the dark and then 10 μL yellow tetrazolium salt MTT-labeling reagent was added into each well. After 4 h incubation, the purple formazan crystals were formed by metabolically active cells. 100 μL of the solubilization solution per well was added to dissolve the cells and placed into the incubator overnight. The absorbance at 550 nm (the formazan salt) and 690 nm as the reference wavelength was measured by the Tecan infinite 200 microplate reader the next day. An additional and identical group of 96-well plates was incubated for 5 min with a 1:1 dilution of 0.4% Trypan blue in PBS and were then washed three times with PBS and imaged. N = 8 for each condition.
Tumor Implantation
Female athymic mice were obtained from the Athymic Animal Core Facility of the Cancer Research Center of Case Western Reserve University. Rat glioma 9L.E29 cancer cell lines engineered to overexpress EGF receptors were subcutaneously implanted in the flank of athymic mice (≈3 × 10⁵ cells per implant). The Flank tumors developed for 21 d prior to systemic injection. Animals were fed exclusively on a special rodent diet (Tekland 2018S; Harlan Laboratories, Inc.) to reduce auto-fluorescence. Animal experiments were performed according to policies and guidelines of the animal care and use committee at Case Western Reserve University (IACUC), as previously reported.[22]
Biodistribution Experiments and In Vivo Fluorescence Imaging
Mice with flank tumors were anesthetized with isoflurane and injected intravenously via the tail with either EGFpep-Au NP-Pc 4 or Au NP-Pc 4 at a dosage of 1 mg kg−1 of Pc 4 per total mouse body weight. Mice with flank tumors were imaged before injection (preinjection), immediately following injection (0 h), every hour after for 6 h (unless euthanized at 4 h), and every 24 h until mice were euthanized due to tumor size (unless euthanized at 24 h). Fluorescent multispectral images were obtained using the Maestro In Vivo Imaging System (PerkinElmer). Multispectral in vivo images were acquired under a constant exposure of 100 ms with a yellow filter acquisition setting of 630–850 nm in 2 nm increments. A Cy5 excitation filter (575–605 nm band-pass) and emission filter (645 nm long-pass) combination was used. Multispectral images were unmixed into their component spectra (Pc 4, autofluorescence, and background) and these component images were used to gain quantitative information in terms of average fluorescence intensity by creating regions of interest (ROIs) around the tumors in the Pc 4 component images. Maestro analysis began by creating postanalysis spectral libraries by imaging a mouse pre- and postinjection to obtain a Pc 4 signal from in vivo by subtraction of autofluorescence and background. The gold content was analyzed by GFAAS in a GTA-110 (Varian, Inc., Palo Alto, CA). Imaging, quantification, and analysis of Pc 4 and Au NPs were conducted as previously described.[22]
Histology Studies with Silver Enhancement Staining and H&E Staining
Tissue samples were fixed in 4% paraformaldehyde at room temperature and embedded in the paraffin blocks. The tissue blocks were cut into 20 μm sections and were deparaffinized. The tissue sections were gradually hydrated through a concentration series of ethanol (100%, 95%, 75%, and 50%) and placed in distilled water for 30 min. The tissue sections were stained with SPI-Mark silver enhancement kit (SPI Supplies Division of Structure Probe, Inc., West Chester, PA) to visualize the Au NPs by deposition of silver onto the gold particles by reduction through light microscopy. After washed by water, the sections were then co-stained with hematoxylin and eosin. Visualization and analysis were conducted as previously described.[22]
PDT Treatment of In Vivo Subcutaneous Tumors
Mice with flank tumors were anesthetized with isoflurane and injected intravenously via the tail with either EGFpep-Au NP-Pc 4 or Au NP-Pc 4 at the indicated concentration described in the figure legends. Dosage of the NPs is based off mass of Pc 4 per body weight of the mice (mg of drug per kg of body weight), with conventional dosage of Pc 4 being 1 mg kg−1.[50] For most studies three or more mice were used, as indicated. For PDT treatment, the tumors were first measured and the laser spot size or treatment area was adjusted to encompass the entire tumor and was checked for homogeneity by a power meter. Treatment area was based off the largest diameter and calculated using the formula for area of a circle ((diameter/2)2 × π). Black tape was used to cover the skin surrounding the flank tumor in order to prevent as much of the light as possible from reaching undesired areas. Once the treatment area was determined, the power was adjusted by multiplying the spot size area by a fluence of 0.1 W cm−2, consistent with previous studies.[22] Once the treatment area and power were determined, the treatment duration was calculated by multiplying the desired dosage in J cm−2 by the treatment area (cm2) and then dividing this by laser power (W) to achieve the treatment duration of 1500 s or 25 min for 150 J cm−2. The mice were imaged before injection (preinjection), immediately following injection (0 h), and every hour after up to 4 h. At this time, the mice were treated with their respective dosage of laser illumination (672 nm at either 50 or 150 J cm−2). A 672 nm diode was chosen as it was previously used with success in prior studies due to its proximity to the peak of Pc 4 absorbance (670 nm) and because of availability of laser diodes.[22,23,43] The mice were imaged posttreatment and allowed to recover. The mice were imaged a day after the injection and every 24 h until they were euthanized (unless euthanized at 24 h). Imaging and analysis were conducted as previously described.[23,43]
Statistical Analysis
Unless otherwise noted, all graphical values are expressed as an average ± SD. Statistical analysis was done on biodistribution results based on a two-tailed, unequal variance, Student's t- test, and p values <0.05 were considered statistically significant. Sample sizes were N = 5 for 24 h RFU values for liver, lung, heart, kidney, spleen, stomach, tumor, large intestine, and bladder; N = 5 for 24 h Au NP%I.D. g−1 values for lung, brain, and tumor; N = 4 for 24 h Au NP%I.D. g−1 values for urinary tract, and urine; otherwise in all other cases N = 3. Statistical analysis could not be performed on 4 h feces, and 7 d urine averages due to lack of available samples. Statistical analysis was done on the 2-week PDT treatment study ([1 mg kg−1 Pc 4] and 150 J cm−2) by comparing the size of treated tumors among the three groups at 14 time points (from day 1, after treatment, to 14 d posttreatment) where to better meet assumptions of the model, the natural logarithms of percent changes in tumor volume from baseline were analyzed. A repeated measures linear model with heterogeneous autoregressive covariance structure fitted using SAS Proc Mixed software was used. Estimated means of natural logarithm of percent change of treated tumors obtained from the model with 95% confidence intervals are plotted in Figure 5B. We tested pairwise comparisons among the three groups (EGFpep-Au NP vs Au NP-Pc 4, EGFpep-Au NP vs EGFpep-Au NP-Pc 4, or Au NP-Pc 4 vs EGFpep-Au NP-Pc 4) at each time point, using estimates obtained from the model. Hochberg's step-up procedure was used to control the Family-wise Error Rate, in relation to multiple testing. All tests are two-sided and adjusted p values from the Hochberg method less than 0.05 were considered as statistically significant.
Supplementary Material
Acknowledgments
J.D.M. and Y.C. contributed equally to this work. The authors thank Mr. James Faulk for assistance in gold GFAAS analysis. This work was supported by grant number 1R01EB012099 (to A.M.B.) from the National Institute of Biomedical Imaging and Bioengineering. This work was also supported by the BRTT Center for Targeted NPs for Imaging and Therapeutics at Case Western Reserve University (to C.B.), an ongoing center grant from the National Foundation for Cancer Research (to J.P.B.), and grant number K01EB006910 (to A.M.B.) from the National Institute of Biomedical Imaging and Bioengineering. The content is solely the responsibility of the authors and does not necessarily represent the official views of the National Institute of Biomedical Imaging and Bioengineering or the National Institutes of Health.
Footnotes
Supporting Information: Supporting Information is available from the Wiley Online Library or from the author.
Contributor Information
Joseph D. Meyers, Departments of Biomedical Engineering and Radiology, NFCR Center for Molecular Imaging, Case Western Reserve University, 11100 Euclid Ave., Cleveland, OH 44106, USA.
Dr. Yu Cheng, Department of Chemistry, NFCR Center for Molecular Imaging, Case Western Reserve University, 11100 Euclid Ave., Cleveland, OH 44106, USA.
Dr. Ann-Marie Broome, Email: broomea@musc.edu, Departments of Biomedical Engineering and Radiology, NFCR Center for Molecular Imaging, Case Western Reserve University, 11100 Euclid Ave., Cleveland, OH 44106, USA.
Dr. Richard S. Agnes, Departments of Biomedical Engineering and Radiology, NFCR Center for Molecular Imaging, Case Western Reserve University, 11100 Euclid Ave., Cleveland, OH 44106, USA
Dr. Mark D. Schluchter, Departments of Epidemiology and Biostatistics, NFCR Center for Molecular Imaging, Case Western Reserve University, 11100 Euclid Ave., Cleveland, OH 44106, USA
Seunghee Margevicius, Departments of Epidemiology and Biostatistics, NFCR Center for Molecular Imaging, Case Western Reserve University, 11100 Euclid Ave., Cleveland, OH 44106, USA.
Dr. Xinning Wang, Departments of Biomedical Engineering and Radiology, NFCR Center for Molecular Imaging, Case Western Reserve University, 11100 Euclid Ave., Cleveland, OH 44106, USA
Dr. Malcolm E. Kenney, Department of Chemistry, NFCR Center for Molecular Imaging, Case Western Reserve University, 11100 Euclid Ave., Cleveland, OH 44106, USA
Dr. Clemens Burda, Email: burda@case.edu, Department of Chemistry, NFCR Center for Molecular Imaging, Case Western Reserve University, 11100 Euclid Ave., Cleveland, OH 44106, USA.
Dr. James P. Basilion, Email: james.basilion@case.edu, Departments of Biomedical Engineering and Radiology, NFCR Center for Molecular Imaging, Case Western Reserve University, 11100 Euclid Ave., Cleveland, OH 44106, USA.
References
- 1.American Cancer Society. Cancer Facts and Figures 2013. American Cancer Society; Atlanta: 2013. [Google Scholar]
- 2.Sampson JH, Archer GE, Mitchell DA, Heimberger AB, Bigner DD. Semin Immunol. 2008;20:267. doi: 10.1016/j.smim.2008.04.001. [DOI] [PMC free article] [PubMed] [Google Scholar]
- 3.Koo Y, Reddy G, Bhojani M, Schneider R, Philbert M, Rehemtulla A, Ross B, Kopelman R. Adv Drug Delivery Rev. 2006;58:1556. doi: 10.1016/j.addr.2006.09.012. [DOI] [PubMed] [Google Scholar]
- 4.Svenson S, Prud'homme RK. Multifunctional Nanoparticles for Drug Delivery Applications Imaging, Targeting, and Delivery. Springer; New York: 2012. [Google Scholar]
- 5.Stupp R, Mason WP, van den Bent MJ, Weller M, Fisher B, Taphoorn MJB, Belanger K, Brandes AA, Marosi C, Bogdahn U, Curschmann J, Janzer RC, Ludwin SK, Gorlia T, Allgeier A, Lacombe D, Cairncross JG, Eisenhauer E, Mirimanoff RO. N Engl J Med. 2005;352:987. doi: 10.1056/NEJMoa043330. [DOI] [PubMed] [Google Scholar]
- 6.Cohen MH. Clin Cancer Res. 2005;11:6767. doi: 10.1158/1078-0432.CCR-05-0722. [DOI] [PubMed] [Google Scholar]
- 7.Sarin H, Kanevsky AS, Wu H, Brimacombe KR, Fung SH, Sousa AA, Auh S, Wilson CM, Sharma K, Aronova MA, Leapman RD, Griffiths GL, Hall MD. J Transl Med. 2008;6:80. doi: 10.1186/1479-5876-6-80. [DOI] [PMC free article] [PubMed] [Google Scholar]
- 8.Cutter JL, Cohen NT, Wang J, Sloan AE, Cohen AR, Panneerselvam A, Schluchter M, Blum G, Bogyo M, Basilion JP. PLoS ONE. 2012;7:e33060. doi: 10.1371/journal.pone.0033060. [DOI] [PMC free article] [PubMed] [Google Scholar]
- 9.Stummer W, Pichlmeier U, Meinel T, Wiestler OD, Zanella F, Reulen HJ. Lancet Oncol. 2006;7:392. doi: 10.1016/S1470-2045(06)70665-9. [DOI] [PubMed] [Google Scholar]
- 10.Stummer W, Beck T, Beyer W, Mehrkens JH, Obermeier A, Etminan N, Stepp H, Tonn JC, Baumgartner R, Herms J, Kreth FW. J Neurooncol. 2008;87:103. doi: 10.1007/s11060-007-9497-x. [DOI] [PubMed] [Google Scholar]
- 11.Dougherty TJ, Grindey GB, Fiel R, Weishaupt KR, Boyle DG. J Natl Cancer Inst. 1975;55:115. doi: 10.1093/jnci/55.1.115. [DOI] [PubMed] [Google Scholar]
- 12.Dougherty TJ, Gomer CJ, Henderson BW, Jori G, Kessel D, Korbelik M, Moan J, Peng Q. J Natl Cancer Inst. 1998;90:889. doi: 10.1093/jnci/90.12.889. [DOI] [PMC free article] [PubMed] [Google Scholar]
- 13.Oleinick NL, Morris RL, Belichenko I. Photochem Photobiol Sci. 2002;1:1. doi: 10.1039/b108586g. [DOI] [PubMed] [Google Scholar]
- 14.Girotti AW. J Photochem Photobiol B, Biol. 2001;63:103. doi: 10.1016/s1011-1344(01)00207-x. [DOI] [PubMed] [Google Scholar]
- 15.Hong IS, Greenberg MM. J Am Chem Soc. 2005;127:10510. doi: 10.1021/ja053493m. [DOI] [PMC free article] [PubMed] [Google Scholar]
- 16.Mroz P, Szokalska A, Wu MX, Hamblin MR. PLoS ONE. 2010;5:e15194. doi: 10.1371/journal.pone.0015194. [DOI] [PMC free article] [PubMed] [Google Scholar]
- 17.Konan YN, Gurny R, Allémann E. J Photochem Photobiol B, Biol. 2002;66:89. doi: 10.1016/s1011-1344(01)00267-6. [DOI] [PubMed] [Google Scholar]
- 18.Mazière JC, Morlière P, Santus R. J Photochem Photobiol B, Biol. 1991;8:351. doi: 10.1016/1011-1344(91)80111-t. [DOI] [PubMed] [Google Scholar]
- 19.Vannostrum C. Adv Drug Delivery Rev. 2004;56:5. [Google Scholar]
- 20.Kessel D. Adv Drug Delivery Rev. 2004;56:7. doi: 10.1016/j.addr.2003.10.002. [DOI] [PubMed] [Google Scholar]
- 21.Dolmans DEJGJ, Fukumura D, Jain RK. Nat Rev Cancer. 2003;3:380. doi: 10.1038/nrc1071. [DOI] [PubMed] [Google Scholar]
- 22.Cheng Y, Samia AC, Meyers JD, Panagopoulos I, Fei B, Burda C. J Am Chem Soc. 2008;130:10643. doi: 10.1021/ja801631c. [DOI] [PMC free article] [PubMed] [Google Scholar]
- 23.Cheng Y, Meyers JD, Agnes RS, Doane TL, Kenney ME, Broome AM, Burda C, Basilion JP. Small. 2011;7:2301. doi: 10.1002/smll.201100628. [DOI] [PMC free article] [PubMed] [Google Scholar]
- 24.Zeisser-Laboube M, Vargas A, Delie F. In: Nanotechnologies for the Life Sciences. Kumar CSSR, editor. Wiley-VCH Verlag GmbH & Co. KGaA; Weinheim, Germany: 2007. [Google Scholar]
- 25.Jain PK, Huang X, El-Sayed IH, El-Sayed MA. Acc Chem Res. 2008;41:1578. doi: 10.1021/ar7002804. [DOI] [PubMed] [Google Scholar]
- 26.Ghosh P, Han G, De M, Kim CK, Rotello VM. Adv Drug Delivery Rev. 2008;60:1307. doi: 10.1016/j.addr.2008.03.016. [DOI] [PubMed] [Google Scholar]
- 27.Chatterjee DK, Fong LS, Zhang Y. Adv Drug Delivery Rev. 2008;60:1627. doi: 10.1016/j.addr.2008.08.003. [DOI] [PubMed] [Google Scholar]
- 28.Paciotti GF, Myer L, Weinreich D, Goia D, Pavel N, McLaughlin RE, Tamarkin L. Drug Delivery. 2004;11:169. doi: 10.1080/10717540490433895. [DOI] [PubMed] [Google Scholar]
- 29.Boisselier E, Astruc D. Chem Soc Rev. 2009;38:1759. doi: 10.1039/b806051g. [DOI] [PubMed] [Google Scholar]
- 30.Hone DC, Walker PI, Evans-Gowing R, FitzGerald S, Beeby A, Chambrier I, Cook MJ, Russell DA. Langmuir. 2002;18:2985. [Google Scholar]
- 31.Hwu JR, Lin YS, Josephrajan T, Hsu MH, Cheng FY, Yeh CS, Su WC, Shieh DB. J Am Chem Soc. 2009;131:66. doi: 10.1021/ja804947u. [DOI] [PubMed] [Google Scholar]
- 32.Cheng Y, Samia AC, Li J, Kenney ME, Resnick A, Burda C. Langmuir. 2010;26:2248. doi: 10.1021/la902390d. [DOI] [PubMed] [Google Scholar]
- 33.Semmler-Behnke M, Kreyling WG, Lipka J, Fertsch S, Wenk A, Takenaka S, Schmid G, Brandau W. Small. 2008;4:2108. doi: 10.1002/smll.200800922. [DOI] [PubMed] [Google Scholar]
- 34.Sonavane G, Tomoda K, Makino K. Colloids Surf B Biointerfaces. 2008;66:274. doi: 10.1016/j.colsurfb.2008.07.004. [DOI] [PubMed] [Google Scholar]
- 35.Stuchinskaya T, Moreno M, Cook MJ, Edwards DR, Russell DA. Photochem Photobiol Sci. 2011;10:822. doi: 10.1039/c1pp05014a. [DOI] [PubMed] [Google Scholar]
- 36.Maeda H. Adv Enzyme Regul. 2001;41:189. doi: 10.1016/s0065-2571(00)00013-3. [DOI] [PubMed] [Google Scholar]
- 37.Ito S, Miyoshi N, Degraff WG, Nagashima K, Kirschenbaum LJ, Riesz P. Free Radic Res. 2009;43:1214. doi: 10.3109/10715760903271249. [DOI] [PubMed] [Google Scholar]
- 38.Oo MKK, Yang X, Du H, Wang H. Nanomedicine. 2008;3:777. doi: 10.2217/17435889.3.6.777. [DOI] [PubMed] [Google Scholar]
- 39.Langer R. Nature. 1998;392:5. [PubMed] [Google Scholar]
- 40.Torchilin VP. Adv Drug Delivery Rev. 2006;58:1532. doi: 10.1016/j.addr.2006.09.009. [DOI] [PubMed] [Google Scholar]
- 41.Peer D, Karp JM, Hong S, Farokhzad OC, Margalit R, Langer R. Nat Nanotechnol. 2007;2:751. doi: 10.1038/nnano.2007.387. [DOI] [PubMed] [Google Scholar]
- 42.Choi CHJ, Alabi CA, Webster P, Davis ME. Proc Natl Acad Sci. 2010;107:1235. doi: 10.1073/pnas.0914140107. [DOI] [PMC free article] [PubMed] [Google Scholar]
- 43.Cheng Y, Meyers JD, Broome AM, Kenney ME, Basilion JP, Burda C. J Am Chem Soc. 2011;133:2583. doi: 10.1021/ja108846h. [DOI] [PMC free article] [PubMed] [Google Scholar]
- 44.Rodriguez ME, Zhang P, Azizuddin K, Delos Santos GB, Chiu S, Xue L, Berlin JC, Peng X, Wu H, Lam M, Nieminen AL, Kenney ME, Oleinick NL. Photochem Photobiol. 2009;85:1189. doi: 10.1111/j.1751-1097.2009.00558.x. [DOI] [PMC free article] [PubMed] [Google Scholar]
- 45.Li YS, Kenney ME. US5763602. 1998
- 46.Li Z. FASEB J. 2005;19:1978. [Google Scholar]
- 47.Master AM, Qi Y, Oleinick NL, Gupta AS. Nanomedicine. 2011;8:655. doi: 10.1016/j.nano.2011.09.012. [DOI] [PMC free article] [PubMed] [Google Scholar]
- 48.Duan H, Nie S. J Am Chem Soc. 2007;129:2412. doi: 10.1021/ja067727t. [DOI] [PubMed] [Google Scholar]
- 49.Brust M, Walker M, Bethell D, Schiffrin DJ, Whyman R. J Chem Soc, Chem Commun. 1994:801. [Google Scholar]
- 50.Sekkat N, van den Bergh H, Nyokong T, Lange N. Molecules. 2011;17:98. doi: 10.3390/molecules17010098. [DOI] [PMC free article] [PubMed] [Google Scholar]
Associated Data
This section collects any data citations, data availability statements, or supplementary materials included in this article.