

Abstract
Translational research plays a vital role in understanding the underlying pathophysiology of human diseases, and hence development of new diagnostic and therapeutic options for their management. After creating an animal disease model, pathophysiologic changes and effects of a therapeutic intervention on them are often evaluated on the animals using immunohistologic or imaging techniques. In contrast to the immunohistologic techniques, the imaging techniques are noninvasive and hence can be used to investigate the whole animal, oftentimes in a single exam which provides opportunities to perform longitudinal studies and dynamic imaging of the same subject, and hence minimizes the experimental variability, requirement for the number of animals, and the time to perform a given experiment. Whole animal imaging can be performed by a number of techniques including x-ray computed tomography, magnetic resonance imaging, ultrasound imaging, positron emission tomography, single photon emission computed tomography, fluorescence imaging, and bioluminescence imaging, among others. Individual imaging techniques provide different kinds of information regarding the structure, metabolism, and physiology of the animal. Each technique has its own strengths and weaknesses, and none serves every purpose of image acquisition from all regions of an animal. In this review, a broad overview of basic principles, available contrast mechanisms, applications, challenges, and future prospects of many imaging techniques employed for whole animal imaging is provided. Our main goal is to briefly describe the current state of art to researchers and advanced students with a strong background in the field of animal research.
In translational research, the gap between in vitro experiments and their clinical applications is often bridged by investigating the animal models of various human diseases. The pathophysiology of an animal and its response to a therapeutic intervention are often studied using one imaging technique or other. Most imaging techniques can be employed to perform transverse as well as longitudinal analyses of whole animals and this minimize the experimental variability, shorten the time required for a given experiment, and enable meaningful expenditure of research resources. Whole animal imaging can be performed using a number of imaging techniques. Depending upon their primary applications, the techniques for whole animal imaging can be broadly classified into two categories: structural and molecular imaging techniques. Structural imaging techniques primarily provide high-resolution images in millimeter to micrometer range and include ultrasound (US) imaging, X-ray computed tomography (CT), and magnetic resonance imaging (MRI). Image formation in these techniques is based upon the principle of spatial difference in interactions of the tissues with sound waves, X-rays, and radiofrequency (RF) electromagnetic fields, respectively. The techniques of the second category are primarily employed for molecular imaging and can again be classified into two subcategories on the basis of the principle of image formation; in many ways, however, MRI and US share properties of both structural and molecular imaging. The first subcategory comprises of nuclear imaging techniques such as positron emission tomography (PET) and single photon emission computed tomography (SPECT), where the fundamental basis for image formation is detection of radiation emitted by injected radioactive tracers. The second subcategory consists of optical imaging techniques such as bioluminescence imaging (BLI), fluorescence imaging (FLI), and optical coherent tomography (OCT). The fundamental basis for image formation in BLI and FLI is capturing of a light photon emitted by a living microorganism or a fluorophore, respectively, from inside the animal. OCT exploits the difference in optical scattering properties of individual tissues for image formation. Individual imaging techniques provide different kinds of information regarding structure, metabolism, and physiology of an animal. Information provided by the individual techniques can be synergized by combining the images provided by them using an image registration mechanism.1,2
In this advanced review, an overview of the basic principle of image formation, contrast enhancement mechanisms, important applications, challenges, and future prospects of the techniques commonly employed for whole animal imaging is provided. Our main goal is to provide a brief description of the current state of art to the molecular biologists, biochemists, pathologists, geneticists, pharmacologists, and nuclear scientists who are working in the field of animal research. Information provided in this article would help these professionals in designing future experiments by considering the availability of these varied yet synergistic imaging techniques.
COMPUTED TOMOGRAPHY
Dedicated CT scanners employed for small animal imaging are a miniaturized version of clinical (human) CT scanners and are often called microcomputed tomogram (μCT) scanners.3 For μCT image acquisition, a number of X-ray beams of a known intensity are projected onto an imaging volume of interest from different rotation angles. The intensity of the X-rays passing through the volume is captured by an array of X-ray detectors placed around it. Multiple X-ray projections acquired at different rotation angles are combined to produce the final μCT image. The image contrast between different tissues in the volume is determined by the difference in their individual X-rays attenuation capacity.4 Knowledge of the intensity of the incident X-ray beam and that reaching the detectors allows the x-ray attenuating capacity of the tissue to be determined. Cardiorespiratory motion of the live animals during μCT image acquisition can be compensated by using prospective or retrospective respiratory and/or cardiac synchronization (i.e., gating).5,6 A similar technique is digital subtraction angiography (DSA), in which an extracellular contrast agent is injected intravenously and data are acquired before and after contrast administration to generate angiographic images. A projection image is obtained to display the distribution of the contrast agent by subtracting the precontrast image (i.e., a mask) from the post-contrast image.4 Tomographic DSA has also been described in the literature to obtain 3D spatial information from DSA projections using tomosynthesis.7
Contrast Agents
The μCT contrast agents increase the degree of X-ray attenuation in the region of their distribution, and hence improve the μCT image contrast. Bolus injection of a clinically used iodine-based contrast agent such as Isovue-370 has been employed for small animal μCT imaging. Oftentimes, the volume of agent injected, the heart rate, blood flow, short circulation time, and the physiologic efficiency of renal excretion limit the amount of time the agents reside in small animal tissue. Therefore, it is sometimes difficult to obtain a sufficient number of projections for μCT imaging following a bolus injection of these agents.8 Constant infusion of these contrast agents have been employed as an alternative to the bolus injection.6
New contrast agents with a relatively long vascular half-life are now available. Two iodinated triglycerides (glyceryl-2-oleoyl-1, 3-di-7-(3-amino- 2,4,6-triiodophenyl)-heptanoate; also called ITG-DHOG), Fenestra-VC and Fenestra-LC (iodine content 50 mg/ml) are currently employed as hepatobiliary-selective blood-pool contrast agents.9,10 Fenestra-VC is particularly useful for cardiac, tumor, and hepatobiliary imaging.5,11,12 Because of its rapid uptake by hepatocytes, Fenestra-LC has a very short blood-pool contrast enhancement time; however, it has found applications for spleen and hepatobiliary imaging.13 Iodine-containing contrast agents are limited by the fact that they cannot be conjugated with biologic markers, which limits their utility for localization of specific targets.8 This limitation of the iodine-containing contrast agents can be overcome by using nanoparticle-based contrast agents which can also be conjugated with biomarkers. Various nanoparticle-based contrast agents with a relatively long half-life such as polymer-coated gold nanoparticles,14 gadolinium-coated gold nanoparticles,15 Polyethylene glycol (PEG)-coated colloidal gold nanoparticles,16 polymer-coated Bismuth-sulphide nanoparticles,17 and antibody specific nanoprobes8 have been developed for vascular imaging. Liposomal contrast agents have a long half-life18 and a high affinity to microvascular fenestrations.19 E-selectin-labeled liposomal contrast agents can be used to image activated endothelial cells.20 Compounds such as tantalum21 and xenon22 have been employed as inhalation contrast agents.
Applications
μCT scanners can provide images at an almost cellular level of resolution3 and have been employed for cardiac, pulmonary, hepatic, splenic, renal, and tumor imaging and to study gene expression. Cardiac μCT images can be obtained with a temporal and spatial resolution of up to 100 μm and 10 ms, respectively, using prospective gating5 and up to 150 μm and 12 ms, respectively, using retrospective gating.6 Recently, a registration-based approach for 4D (three spatial dimensions and one temporal) cardiac μCT imaging using a combined prospective and retrospective gating approach has also been introduced.23 Various cardiac parameters can be calculated from dynamic μCT images by analyzing the left ventricular volumes at different time points of the cardiac cycle.5 Dynamic μCT cardiac imaging may be useful for understanding various pathologic processes such as left ventricular wall thickening 5 and temporal evaluation of myocardial infarction-induced cardiac remodeling.24 μCT imaging has also been employed to investigate cardiac phenotype and coronary artery patterning defects.25,26
Small animal pulmonary μCT images with a spatial resolution as high as 91 μm and 150 μm have been obtained using prospective 27 and retrospective 22 gating, respectively. μCT images acquired at different time points in the respiratory cycle can be used to calculate the respiratory lung volumes 22 and morphometric indices.17,22,28,29 μCT imaging has been employed to characterize pulmonary airways, pulmonary vasculature,30 microvascular permeability, and alveolar membrane edema,31 and for lung tumor analysis.32,33 Small animal models of diseases such as emphysema 34 and fibrosis 24 have been investigated using μCT imaging.
μCT imaging of the liver and spleen is usually performed following contrast agent administration.12,13,35 In vivo contrast-enhanced (CE) μCT images of liver with a spatial resolution as high as 44 μm have been produced and can be used to delineate tumors as small as 300 μm.36,37 μCT imaging can also be used to delineate the hepatic vasculature 38 and investigate the changes following ischemic/reperfusion injury.12 Iodinated liposomes are particularly useful for splenic μCT imaging because of the fact that they get degraded in the spleen. Red pulp of the spleen appears more radio-intense than white pulp in CE-μCT images as a result of concentration of phagocytes in the former.35
Renal μCT imaging is usually performed by in situ perfusion fixing and is particularly useful for glomerular analysis.39–41 Conventional-source μCT scanners provide renal images with a spatial resolution in the range of 10–20 μm that can be used to calculate the total renal, cortical, and medullary volumes, glomerular diameters and numbers, and vascular volume fractions.42,43 μCT images can also be used to visualize the 3D architecture of nephrons and renal blood vessels.42,43
In vivo μCT imaging of murine proximal tibial metaphysis has been performed with a spatial resolution as high as 20 × 20 × 26 μm3.44 However, most of the previous work for osteology applications of μCT imaging has been done via ex vivo analysis. In addition to bone mineral content and bone mineral density, μCT images can be employed to calculate morphometric indices.44–47 Longitudinal bone survey can also be performed in order to investigate the bone growth and unloading-related changes.44,48
μCT imaging is an important tool for longitudinal imaging of tumors (see Figure 1). μCT imaging has been used for hepatic 49 and pulmonary 50 tumor imaging. Gold nanoparticles conjugated with UM-A9 antibodies 8 and iodinated contrast agents such as Fenestra-VC 11 have also been employed for CE-μCT tumor imaging. E-selectin specific μCT imaging can be used to image activated vessel walls 20 and can be used for noninvasive monitoring of tumor angiogenesis.51 Multiple-contrast52 and negative-contrast53 μCT colonography has also been devised to trace morphologic lesions and tumors in the murine colon in vivo. μCT imaging has also been employed to image the expression of sodium-iodide symporter (a reporter gene) in mouse tumors.54 Perfusion DSA has been employed to investigate vasculature flow patterns.55,56 Pulmonary blood volume, blood flow, and mean transit times can be calculated from DSA images4,7,56 (see Figure 2). DSA has also been employed to study tumor angiogenesis.57 Tomographic DSA enables functional perfusion measurements in 4D.7
FIGURE 1.

Virtual in vivo μCT images of growing lung tumors. Axial microcomputed tomogram (μCT) images of the thorax of a mouse at the indicated time points are shown. μCT images of two lung adenocarcinomas (a–c) and (d–f) and a lung adenoma (g–i) acquired at different ages. Tumors observed in the lung are circled. (Image reproduced with permission from Ref 33. Copyright 2008 Wiley-Blackwell).
FIGURE 2.

Sixteen successive images (starting at second heartbeat post-injection) from a digital subtraction angiography (DSA) sequence with a 100 ms contrast injection (A). The reproducibility for (n = 5) 100 ms injections (volume injected 83.22 μL) is shown by mean and standard error at each heartbeat (B) in a region of the aortic arch. Note that mean peak value of contrast-to-noise ratio (CNR) is 10. (Image reproduced with permission from Ref 7. Copyright 2007).
Challenges and Future Prospects
In order to understand human disease processes on the small animal models, acquired images need to be scaled according to dimensions and physiology of the animal;4 hence, smaller volume elements (i.e., voxels) are required. Yet, the signal-to-noise ratio in the images is dependent on the number of X-ray photons passing through the voxel. As such, the X-ray exposure dose in μCT imaging of small animals can be high when compared to that in human imaging. In fact, as one might predict, higher X-ray exposure dose is detrimental to life expectancy of live animals, may alter phenotypic expression of genetically engineered animals, and can cause radiation-induced neoplasia.3 Various approaches such as application of contrast agents, prospective gating, reduced X-ray scatter, monochromatic X-ray beams, fewer projections, alternate filtering, and beam modulation according to imaging cross section can be employed to decrease X-ray exposure dose.5,58,59 Lastly, there are some daily practice challenges such as instrument availability, longer image acquisition times, and lower contrast agent availability that limit μCT utility.
The ability of μCT imaging to visualize the 3D architecture of basic functional units such as hepatic lobules and nephrons in vivo without physical disruption could help in further understanding the pathophysiology of various disease processes. Development of nanoparticles-based target-specific contrast agents would help in diagnosis of neoplastic lesions at the earlier stages. Newly developing refraction imaging techniques such as phase contrast imaging 60,61 can enable high-quality image acquisition with a potential reduction in the radiation exposure by as much as 10,000 fold.58
MAGNETIC RESONANCE IMAGING
Whole animal MRI can be performed on dedicated high-field MRI 62 and nuclear magnetic resonance (NMR) scanners as well as on clinical MRI scanners 63 using dedicated receiving coils.64 During MRI acquisition, nuclei with a nonzero magnetic moment produce a net magnetization when placed within a static magnetic field (B0) and are then excited by applying an RF excitation pulse. Following the excitation, the nuclei reemit RF waves that are spatially localized by applying magnetic field gradients of known magnitude and orientation.65 A variety of morphologic images with different contrasts can be acquired by selecting a suitable combination of imaging sequence parameters.66,67 In addition, various techniques such as contrast-enhanced (CE) MRI, perfusion MRI, functional MRI (fMRI), diffusion tensor imaging (DTI), and MR spectroscopy (MRS) can also be used to extract different kinds of information. CE-MRI involves image acquisition following injection of a gadolinium-based contrast agent. Two important CE-MRI techniques, dynamic contrast-enhanced (DCE) MRI 68 and dynamic susceptibility-contrast (DSC)-MRI69 can be used to quantify contrast agent concentration by combining T1 (e.g., gadolinium chelates) and T2* (e.g., iron oxide particles) agents with MR imaging acquisitions sensitive to the effects of these specific agents. Perfusion MRI can be performed by any of the two methods, arterial spin labeling perfusion MRI (ASL-MRI) and DSC-MRI, and is used for perfusion quantification (regional blood flow and volume, etc.)70 In ASL-MRI, the magnetization of a proton pool is labeled by applying a slice-selective RF pulse, and reduction of the signal in a T1–weighted image upon arrival of the magnetically labeled blood into the imaging volume is used for perfusion quantification.71,72 A comparative analysis of ASL- and DSC-MRI techniques for perfusion MRI can be found elsewhere.71 In fMRI, the activity-related neuronal activity changes in specific brain regions are indirectly and noninvasively analyzed. The concentration of oxyhemoglobin increases in the vicinity of neuronal excitation resulting in a signal increase in blood-oxygen-level-dependent MRI images.73 In DTI, the magnitude and direction of water diffusivity is analyzed by comparing multiple images acquired with gradient pulses applied in different directions.74 In this way, it is possible to map fiber direction information (e.g., brain white matter tracks). The fundamental basis for MRS is the shift in resonance frequencies of various paramagnetic atoms such as 1H, 31P, 13C, 19F, 17O, and 23Na as a result of the electronic environment of a given nuclei; for example, electronegative nuclei such as oxygen deshield detectable hydrogen nuclei of their respective electrons providing a different chemical shift from other electron-rich hydrogen nuclei (e.g., fat). With these and many othermolecular level differences, MRS provides the platform to explore the biochemistry of these atoms in vivo.75–77
Contrast Agents
Conventional MRI contrast agents influence the image contrast by reducing both the longitudinal (T1) as well as the transverse (T2) relaxation times of the water protons in their vicinity.78 In this way, the contrast agents provide a positive and a negative contrast to the T1- and T2-weighted images, respectively. Detailed information regarding the mechanism of action, magnetic and chemical properties, and biodistribution pattern of various MRI contrast agents can be found elsewhere.78 According to their magnetic properties, the MRI contrast agents can be classified as paramagnetic (e.g., gadolinium-based agents) or super-paramagnetic (e.g., iron oxide nanoparticles) agents.78,79 Depending upon their biodistribution pattern, different contrast agents can be employed to image specific regions of the animal body. For example, conventional, FDA-approved, MRI contrast agents, such as gadolinium chelates, are extracellular agents that quickly distribute into the blood pool and interstitium following their intravenous injection. These agents do not cross the intact blood–brain barrier, and have found applications for imaging of MR angiography and enhancement of lesions such as tumors.78 Blood-pool agents have a relatively large size and longer half-life in the blood than extracellular fluid (ECF) agents and include gadolinium complexes with albumin, polymers, etc.78 A number of organ-specific contrast agents are also available. Gadolinium-, manganese (Mn2+) - and super-paramagnetic iron oxide (SPIO)-based agents are available for hepatobiliary imaging.78,80 Ultra-small super-paramagnetic iron oxide (USPIO)- and gadolinium-based agents are available for lymph node and bone marrow imaging.78 Iron oxide nanoparticles are taken up by the monocyte-macrophage system and can be used as MRI markers of inflammatory and degenerative disorders characterized by enhanced phagocytic activity.79,80 Mn2+-based agents are particularly useful for neuroimaging.78 Mn2+ can enter the central nervous system neurons and upon neuronal excitation, gets released into the synaptic cleft. This phenomenon is used to extract information on the axonal transport and trans-synaptic activities. 81,82 (see Figure 3). Orally administered agents are available for gastrointestinal imaging.78 Oxygen83 and hyperpolarized gases such as 3He and 129Xe have been employed for pulmonary ventilation studies.84,85
FIGURE 3.
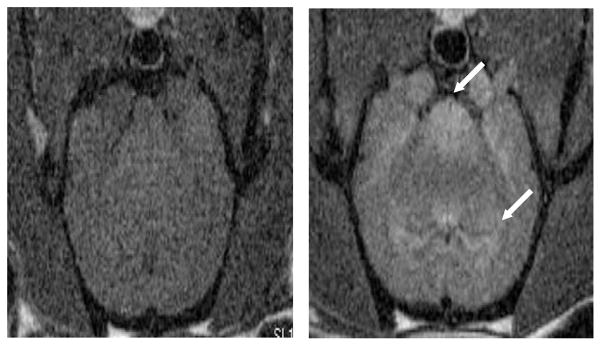
Axial magnetic resonance images of a normal adult male rat brain acquired before (left) and 24 h after (right) intraperitoneal injection of 45 mg/kg MnCl2. MnCl2 results in regions enhancement (arrows). Images were acquired with a conventional T1-weighted spin echo acquisition (TR/TE = 600/10 ms) at 7T.
A new generation of contrast agents consisting of an assembly of a contrastophore conjugate and a target-specific ligand are now being developed for molecular imaging.79,86 A number of carrier molecules such as antibodies, peptides, polysaccharides, aptamers, and synthetic compounds can be used to deliver the magnetic labels to the specific targets.79 Tagging of various gadolinium- and nanoparticles-based contrast agents have been performed to monitor the stem cells and immune cells in vivo.87 Investigators have also been able to insert magnetic reporter genes into the cells resulting in expression of iron-storage proteins to be detected on MRI images.88–90 A group of smart contrast agents, whose relaxivity varies depending upon various local factors such as temperature, pH, redox potential, enzymes, etc. have also been developed.78,91 Copper- 92 and zinc-responsive 93 contrast agents have also been developed.
Another MRI contrast mechanism, chemical exchange saturation transfer (CEST) originates from the chemical exchange of endogenous amide or hydroxyl protons or from exchangeable sites on exogenous CEST agents.94 Paramagnetic CEST (PARACEST) and hyperpolarized CEST (hyperCEST) are variations of CEST in which saturation transfer arises from presaturation of exchangeable protons on exogenous paramagnetic or hyperpolarized gas molecules, respectively.94
Applications
High-resolution (spatial resolution <100 μm) MRI, also called MR microscopy (MRM) has been performed in small animals (see Figure 4). A desired combination of a number of structural imaging (i.e., T1-, T2- and spin density-weighted, fat saturated and fluid attenuated, etc.), DTI, perfusion MRI, DCE-MRI, fMRI, and MRS of the region of interest can be performed in a single setting. A broad overview of applications of MRI for animal imaging can be found elsewhere.80,95–99 MRM provides relatively high-resolution images of brain because of the absence of cardiorespiratory movements.96 High-field MRM has recently been employed for murine brain imaging at a near single-cell layer resolution (30–40 μm) in vivo.62 DTI with high spatial and angular resolutions has been employed for fiber tractography in vivo.100,101 fMRI has found applications to analyze neuronal activity in normal102 and diseased rats.103 Mn2+-enhanced MRI has been employed for neural tract mapping, fMRI, and to investigate neuroarchitecture.82 Multiparametric MRI including perfusion MRI and diffusion-weighted imaging has been used to investigate small animal stroke models.104 Perfusion MRI and CE-MRI can be employed to investigate small animal brain tumor models.105,106
FIGURE 4.

High-resolution (500 × 100 × 100 μm) axial magnetic resonance imaging (MRI) image of dorsolateral prostate of transgenic mouse prone to prostate hyperplasia. Prostate region is outlined in green. The image was acquired by using rapid acquisition with refocused echoes (RARE) sequence (TR/TE = 5000/15 ms).
MRM has also been employed for cardiac,107 embryonic,108 and developmental109 studies. Perfusion fixation can be employed to obtain regional or whole-body high-resolution MRM images.96 3He-and 129Xe-enhanced MRM is employed to investigate pulmonary ventilation patterns.96 Morphologic phenotyping has also been performed by MRM.96 Longitudinal MRM studies can be performed to analyze the temporal evaluation of various tumor parameters such as the total volume, vascular permeability, water diffusion and blood oxygenation, etc. Magnetic tagging has been employed to analyze the cellular migration in the brain,110 heart,111 liver,112 and kidneys113 of small animals in vivo. Multiparametric MRI including DTI and perfusion MRI has been used to characterize the rat model of reperfused partial liver infarction114 and liver tumors.115,116 DCE-MRI is used to investigate the tumor microvasculature and can potentially be used as an imaging biomarker to measure anti-angiogenic effects of cancer treatments.68 Affects of interventional procedures such as photodynamic therapy on tumors can also be studied using DCE-MRI (see Figure 5).
FIGURE 5.
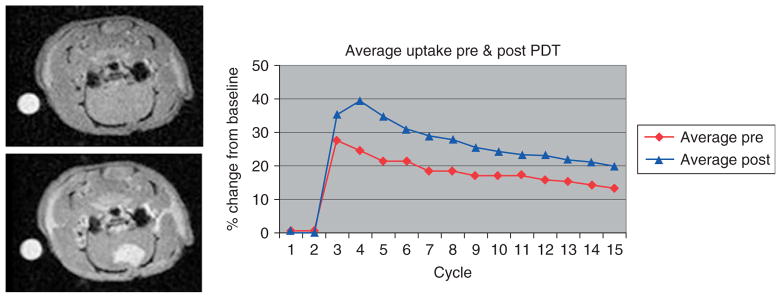
Estimation of affect of photodynamic therapy (PDT) on U87 glioma implant in a rat model using dynamic contrast-enhanced magnetic resonance imaging (DCE-MRI). DCE-MRI images of a U87 glioma implant in a rat model acquired before (left upper) and immediately after (left lower) intravenous injection of Gd-DTPA contrast agent. Analysis of the dynamic uptake (right) revealed that contrast uptake was increased as evidenced by higher peak signal level in MRI images acquired following PDT. The images were acquired using a fast low angle shot (FLASH) sequence (TR/TE = 200/3 ms).
Principle applications of MRS are for cancer therapy assessment and analysis of intrinsic metabolic pathways and drug metabolism.76,99,117 Molecular quantification down to the millimolar range can be performed.77,99 Because of its ability to detect molecules such as N-acetylaspartate, creatine, phosphocreatine, choline, lactate, inositols, alanine, glutamine, and glutamate, 1 H MRS has found applications to investigate the molecular pathways in vivo.77 Energy metabolism molecules such as phosphocreatine, adenosine tri-phosphate, phosphorylcholine, and inorganic phosphate (Pi) can be analyzed using 31P-MRS which makes it particularly useful to study tissue energetics.77 13C-MRS has relatively lower intrinsic sensitivity and is used to study compounds such as glycogen that are present in a high concentration inside the body.77 13C-labeling is employed to study metabolic pathways. 17O-MRS is used to investigate the oxygen metabolism. 19F-MRS is used to investigate 19F-containing drugs such as anesthetic agents, gene activity, pH, metal ion concentrations, oxygen tension, hypoxia, vascular flow, and vascular volume.118,119 Very high resolution MRS has also recently been performed to investigate the cellular protein content in vivo.120 Further details of various MRS applications can be found elsewhere.76,99,117
Challenges and Future Prospects
A very high development and maintenance cost of MRI and NMR scanners restrict their availability; oftentimes in vivo animal imaging systems are found in advanced centers only. The desire to obtain very high resolution images using MRM is particularly hindered by a steep reduction in the signal-to-noise ratio with reduced voxel size. The sensitivity of MRI techniques for functional and metabolic measurements is also relatively low when compared to PET and SPECT. Very long image acquisition times for the techniques such as MRS decrease the throughput of the animal research. At last, intrinsic cardiorespiratory movements of the animals are particularly a problem for imaging of the mobile organs.
MRI has an edge over the other imaging techniques because of its ability to provide a multiplicity of information by employing different imaging sequences. This makes MRI a versatile tool to define anatomy and pathophysiology of an animal single-handedly. Recent advances such as availability of MRI scanners with very high magnetic field and gradient strengths, MRI–PET scanners, dedicated small animal imaging microcoils, increased sensitivity of hyperpolarized gas imaging, and faster imaging mechanisms have revolutionized its applications. Development of nanoparticles-based target-specific contrast agents and innovative contrast mechanisms such as CEST is expected to further take small animal MRI research into a new horizon.
NUCLEAR IMAGING MODALITIES
Two main nuclear imaging modalities namely SPECT and PET are typically used for animal imaging. Dedicated PET121 and SPECT122 imaging systems have been developed for small animals. For image acquisition by these modalities, a radionuclide is injected into the body. The radionuclide distributes in the body based on its similarity to other compounds needed by the cells or tissues (e.g., bony phosphates, glucose, water, red blood cells). A SPECT radionuclide undergoes radioactive decay and emits gamma rays of a particular energy. The gamma rays are captured by an external camera to acquire a number of 2D projections from multiple angles which are combined together to form a 3D SPECT image.123,124 On the other hand, a PET radionuclide undergoes positive beta decay and emits a positron. The positron travels for a short distance (approximately, a few millimeters), annihilates with an electron to emit a pair of photons (energy 511 KeV) that travel nearly 180° apart and are detected by externally placed detectors. The photons coincidently detected by two opposing detectors define a line of response (LOR). The distribution pattern of the LORs is used to reconstruct a 3D image of the radioactivity distribution within the body.123,124
Radionuclides and Radiotracers
Extensive information regarding various PET radionuclides can be found elsewhere.125 Traditional 13N-, 11C-, and 15O-based radionuclides have a very short half-life (i.e., seconds or a few minutes) and can be used at the production site only; their short half-life prevents feasible transport to the remote imaging locations. 18F is the most commonly used PET radionuclid because of its low positron energy, ease of production, and relatively long half-life (50–100 min).126 Considerable effort has been made to develop nonstandard radionuclides with a long half-life to study time-consuming processes such as protein metabolism and cell proliferation.126,127 68Ge and 82Sr, have a relatively long half-life (270.8 and 25.3 days, respectively).126 Two As isotopes with a long half-life, 72As (26 h) and 74As (17.8 days), are also available.128,129 The radionuclides can be labeled to a ligand with affinity toward a particular target molecule inside the body for applications such as drug development and to study the pathophysiology of various diseases. Extensive information regarding the process of development and evaluation of a target-specific PET radionuclide can be found elsewhere.130 2-Deoxy-2-fluoro-D-glucose (FDG), a glucose analog, is a commonly used ligand.130–133 Radiolabeled-FDG enters the cells through the glucose transporters and gets phosphorylated by hexokinase. In tissues with low glucose 6-phosphatase, the phosphorylated FDG becomes trapped within the cells. [18F]FDG is the most commonly used agent in PET imaging.134 Its variant 6-deoxy-6-[18F]fluoro-D-glucose does not undergo intracellular phosphorylation and is used to image glucose transport dynamics135 (see Figure 6). 82RbCl is a potassium analog that is rapidly taken up by the muscle cells.136 Na[18F]fluoride is used for bone imaging.137 Radiolabeled bombesin and its derivatives have been explored for cancer PET imaging.138 PET radionuclides based upon thymidine kinase pathways, matrix metalloproteases are used for PET imaging of angiogenesis.139 Radiolabeled peptide conjugates for PET imaging of apoptosis140 and tumor protein metabolism138 have also been developed.
FIGURE 6.

Positron emission tomography (PET) images of a rat injected with 6-deoxy-6-[18F]fluoro-d-glucose ([18F]6FDG) and scanned during glucose clamp under fasting (left) and hyperinsulimic (right) conditions. The tissue concentration of [18F]6FDG was elevated in response to insulin stimulation (Images courtesy of Dr. Raymond Muzic, Case Western Reserve University, Cleveland, OH, USA).
Radiotracers based upon radioactive metals such as 99mTc, 111In, 188Re, 131I, 123I, 201Th, and 133Xe are often used for SPECT imaging. Specific radiotracers have been developed for SPECT imaging of individual receptors and transport systems in the brain.141 [99mTc]-Sestamibi142 and [111In]-pentetreotide143 have been employed for myocardial perfusion and neuroendocrine tumor imaging, respectively. 2-Nitroimidazole and nitric oxide derivatives have been used to image tumor hypoxia and inflammation-related changes, respectively.144 Radiolabeled bombesin and its derivatives have been explored for cancer SPECT imaging.138 Radiolabeled peptide conjugates for SPECT imaging of apoptosis,140 amyloid plaques,145 and tumor protein metabolism138 have been developed.
Applications
Nuclear imaging modalities can provide quantitative information regarding molecular concentrations by estimating the number of annihilation events or incident gamma photons in vivo. The sensitivity of a preclinical PET for the detection of annihilation events is 2–4% and provides images with a spatial resolution of 1–2 mm,123,146 whereas the sensitivity of a preclinical SPECT is approximately 0.3% and provides images with a spatial resolution of ≈0.5 mm.123,146 A broad comparative analysis of relative strengths and limitations of SPECT and PET can be found elsewhere.146,147 PET is 10 times as sensitive as SPECT. On the other hand, availability of large number of radionuclides, simultaneous imaging of multiple agents, cost-effectiveness, and adaptability to specific imaging situations are amongst the few advantages of SPECT. Overall, PET is advantageous over SPECT for drug development and cancer imaging.
PET offers sensitivity in the picomolar range. It has been employed to study myocardial gene expression and effect of its phenotypic expression on the cardiac parameters.148–150 Cardiac and respiratory gating has also been employed to improve image quality.150 Neurological applications of PET include monitoring of neurotransmitter function, molecular events in brain tumors, and angiogenic and gene therapies, among others.148,149 It is employed for tissue characterization, staging, and therapy control in oncology.148,149,151 Radioarsenic-labeled bavituximab can be used for PET imaging of solid tumor vasculature.152 Similarly, applications of SPECT have also been described for drug development, and brain and cardiac imaging.153,154 It has also been used for studies related to gene expression and cancer; however, PET is more preferred nowadays.153 Bone imaging has also been performed using SPECT. Nuclear imaging modalities have also been employed for imaging of atherosclerotic lesions,155 amyloid plaques of Alzheimer’s disease,156 and reporter gene imaging.157 A tumor can be differentiated from inflammation using various proliferation markers.158 Tumor radiosensitivity can also by monitored by investigating hypoxia and apoptosis.159
Challenges and Future Prospects
Although nuclear imaging modalities can be used to reveal molecular events, they are unable to provide any information regarding molecular structures. For characterization of molecular structures, other techniques such as high performance liquid chromatography (HPLC) need to be used. Further developments in detector technology and image reconstruction algorithms for nuclear imaging modalities are desired to overcome the limitations such as very low detection sensitivities and spatial resolutions. Development of highly target-specific ligands is desired to radiolabel the radionuclides. High costs for PET scanners and short half-life of radionuclides have limited small animal PET imaging to the advanced centers only. Very short half-life of PET radionuclides necessitates the presence of a cyclotron in vicinity of the PET imaging system. Pharmacologic constraints, and prerequisites and interspecies variations in metabolism and mass effects of PET ligands also remain a challenge for extension of results of the animal studies into the clinical practice.160
On their positive aspect, nuclear imaging modalities provide a uniform assay system to evaluate pharmacokinetics and pharmacodynamics of the candidate drugs and molecular probes in animal models. Dynamic data acquisition enables complete description of kinetics of new agents in a single animal. Development of new radionuclides and target-specific ligands is likely to play a major role in the understanding of mechanisms of diseases such as myocardial infarction, Parkinson’s disease, and Alzheimer’s disease and their management.157 Molecular information from these modalities can be combined with the structural and molecular information provided by CT and MRI. Image registration mechanisms, dual-modality imaging systems, and contrast agents are expected to give promising results in animal imaging as described in Section ‘New Frontiers in Multimodality Imaging.’
ULTRASOUND IMAGING
In US imaging, sound waves of a desired frequency (determined by factors including depth of the organ of interest and the desired spatial resolution) are applied from a transducer upon the animal body, a fraction of which gets reflected from the acoustic interfaces (created by difference in stiffness and density variations of the tissues). A part of the reflected waves is detected by the transducer. The intensity pattern of the reflected waves reaching the transducer is used to generate a US image.161,162 Different US imaging modes such as amplitude and brightness modes can be employed to construct 1D and 2D US images, respectively.163–165 A number of Doppler US techniques have also been developed in which frequency shift of the sound waves scattered from moving particles (such as blood) is used to determine the velocity of the moving particles.162,165 Finally, high intensity focused US (HIFU) is a technique in which a high intensity of US is imposed upon the region of interest that results in thermal heating (up to 60°, which leads to coagulation necrosis) and mechanical effects including cavitation and microstreaming at the focal point.166,167
Ultrasound Contrast Agents
US contrast agents (UCAs) enhance image contrast by increasing backscatter of the sound waves. Detailed description of physical interactions between the UCAs and various US imaging modes can be found elsewhere.168,169 A UCA typically consists of a gas core surrounded by a biocompatible stabilizing material such as a protein, lipid, or biopolymer.169,170 Unfortunately, because of their large size, the UCAs cannot cross from the vascular pool into the extravascular space and hence have applications for vascular pool imaging only. Nontargeted UCAs have been used as red cell tracers.171
Target-specific UCAs are developed by using various strategies such as surface property modifications or covalent linkage of targeting ligands.172 A number of inflammation-specific UCAs have been developed by targeting the leukocytes or inflammation-specific adhesion molecules.173 Markers such as vascular endothelial growth factor (VEGF) receptors have been exploited to develop angiogenesis-specific UCAs.173 Fibrin- 174 and platelet-targeted 175 UCAs have also been developed. Recently, stimulus-responsive UCAs have been developed to increase the blood half-life of a drug as well as for US targeting by incorporating a brush border to the lipid shell that protects the targeting ligands from opsonizing factors in the absence of sound waves. Once the UCA is bound to the target, it can be destroyed allowing for the drug payload to be delivered.176 The UCAs are a powerful tool for delivery because not only can they be targeted and monitored, but their insonation parameters can also be adjusted to induce oscillations that rupture the UCA, releasing the drug/gene payload.177–179
Sonoporation or cellular sonication is a technique that via application of the US in the presence of a UCA, transiently enhances local cell membrane permeability by creating pores in the cell membranes and microvasculature,173 which makes it a promising tool for image-guided drug and gene delivery into the cytoplasm. Large DNA particles as well as nanospheres of diameters up to 75 nm could enter a cell upon sonoporation.180
Applications
US using the sound waves of 20–40 MHz can provide images with a spatial resolution as high as 30 μm in small animals.173 In small animal imaging, the depth of penetration limitations associated with high-frequency US are not as problematic as they would be in human imaging. Molecular imaging of cardiovascular diseases is an established application of US and can also be monitored with contrast-enhanced US. Other pathophysiologic processes that can be monitored with contrast-enhanced US are atherosclerosis, angiogenesis, ischemia, inflammation, and thrombosis.171,172 For example, ICAM-1 and P-selectin targeted UCAs are used to evaluate transplant rejection and ischemia-induced chest pain, respectively. Atherogenesis-associated inflammatory changes can be exploited to characterize atheromatous plaques by US imaging. VCAM- and lipid-UCAs have been used to identify the atheromatous plaques in their early stages and ischemic-reperfusion injuries, respectively.171 Platelet- and fibrin-specific UCAs can be used to improve clot visualization.174,175 Ultrasound-induced increase in tPA activity has been exploited for stroke lysis.181 Tumor growth and its response to therapy can be monitored using angiogenesis-specific UCAs. Several techniques have been developed to monitor tumor neovascularization using US imaging182–184 (see Figure 7). US can also be used to differentiate tumor therapy-induced inflammatory changes from the residual tumor by using phosphotidyl serine (PS)-modified UCAs because of increased PS receptors at the inflammation site (see Figure 8). Contrast-enhanced US has also been employed to measure the regional blood flow.185 Detailed information regarding oncologic applications of HIFU can be found elsewhere.166 Pulsed-HIFU has been employed for targeted drug delivery.186–188 Sonoporation provides a safe alternative to viral vectors for delivering the nuclear acid material into a cell.177–179 Sonoporation has also been used to disrupt the blood–brain barrier for more efficient drug delivery to the central nervous system. The increased permeability lasts for approximately 4 h after sonication, and molecules up to 40 kDa can be transferred through the pores.189–191
FIGURE 7.
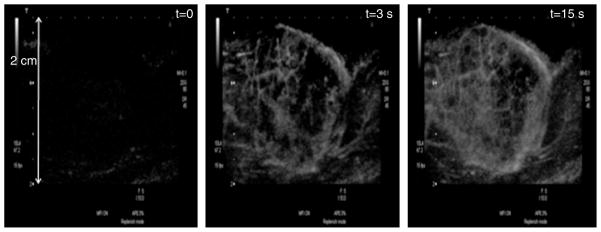
Contrast-enhanced US images of microvasculature of a rat tumor at different delay times after the US contrast agent (UCA) injection. The microvasculature can not be seen in the image acquired at the beginning of the UCA injection (left), whereas, it can be properly delineated in the images acquired after delay times of 3 (center) and 15 s (left) (Images courtesy of Dr. Agata Exner, Case Western Reserve University, Cleveland, OH, USA).
FIGURE 8.

Contrast-enhanced US images of a rat tumor obtained 7 days after performing the ablation therapy. Inflammatory region can readily be identified because of US contrast agent (UCA) targeting by phosphatidyl serine. The images were taken 12 min after injection of phosphatidyl serine UCAs. (Images courtesy of Dr. Agata Exner, Case Western Reserve University, Cleveland, OH, USA).
Noncontrast-enhanced US imaging has also found a few applications for small animals. For example, US elastography provides useful information regarding mechanical properties of the tissues and can be used to investigate suspicious mass lesions.192 Intravascular US elastography has been evaluated for characterization of atherosclerotic plaques and mural thrombi in rabbits.193 In vivo characterization of atherosclerotic plaques have also been performed using US.194
Challenges and Future Prospects
Operator dependence and challenges to provide whole-body images are the principle pitfalls of US. UCA applications in drug and gene delivery are limited by their relatively low loading capacity. Various strategies such as the utilization of a polymer shell have been employed to improve their loading capacity.179 Also, the UCAs are confined to the vascular compartment only and cannot be used for extravascular or intracellular imaging.173 On the other hand, primary advantage of the UCAs is that the signal generated from contrast-enhanced US will be a true indicator of the vascular bed. Noninvasive targeted drug and gene delivery by US can help in formulating new strategies for administration of drugs that would otherwise have a high incidence of adverse effects. US molecular imaging also has an edge over nuclear imaging techniques because of its relatively high spatial resolution, requirement of very low contrast dose, and absence of ionizing radiation exposure.
OPTICAL IMAGING TECHNIQUES
A number of optical imaging techniques have been developed in which the fundamental concept behind image formation is the detection of a photon emitted from inside the animal body by an external camera. In BLI, the photon is emitted upon metabolization of a substrate by a bioluminescent reporter enzyme.195,196 In FLI, a fluorophore gets excited by absorbing a photon, and releases another photon of comparatively higher wavelength while returning back to the ground state.195 OCT is based upon the physical principle similar to that of brightness mode of US imaging except that it uses light photons instead of sound waves.197
Optical Reporters
Firefly luciferase (Photinus pyralis; FLuc) (half-life ≈2 h) is the most widely used reporter enzyme for BLI.198,199 It catalyzes the formation of a luciferin–ATP complex, which gets oxidized leading to production of a cyclic peroxide compound that eventually becomes high-energy oxyluciferin. Oxyluciferin emits light photons of a broad spectrum (peak λmax ~ 560 nm).198,199 The light emission peaks ≈10–12 min after the luciferin injection and gradually decreases over next 60 min.200 Various ATP-independent luciferases such as sea pansy Renilla reniformis luciferase (RLuc),201 click beetle Pyrophorus plagiophthalamus, and marine copepod Gaussia princeps Luciferase (GLuc)202,203 have also been cloned. As compared to the firefly luciferase, ATP-independent luciferases can be easily fused with other proteins. However, their limited distribution, rapid kinetics, and higher background noise are a few limitations.199 Bacterial lux operons encode all proteins required for bioluminescence. Hence, lux operon-expressing bacteria do not require an exogenous substrate to produce light. This fact has been exploited to investigate bacterial pathogenesis; however, attempts to incorporate lux operons into mammalian cells have not been successful yet.199
Both endogenous (e.g., hemoglobin or collagen) as well as exogenous molecules can act as flourophores for FLI.199 An exogenous fluorophore molecule can be an organic dye,204 a fluorescent gene reporter,205 a fluorescent protein,206 or a quantum dot.207 Recently, smart probes, whose conformation changes upon binding to a target (which increases their fluorescence intensity), have also been developed.208,209 Fluorescent probes emitting light in the near infrared region (NIR) are now being produced to improve the depth of in vivo FLI.210,211 A number of green fluorescent proteins (GFPs) have been developed, which are useful in studying gene expression and protein interactions.212–215 In addition, red fluorescent proteins (RFPs) have also been developed.215 The fluorescent proteins can undergo various changes such as photoactivation, photoconversion, and photoswitching.215 Various mechanisms have also been described for contrast enhancement in OCT images.197,216
Applications
Optical imaging techniques can detect optical reporters in concentrations as low as picomolar to femtomolar ranges.199 Spatial localization of the optical signal can be performed by using other imaging modalities such as planar X-ray imaging. A broad overview of the applications of BLI for small animal imaging can be found elsewhere.196 Luciferase complementation can be used to monitor protein interactions and their disruption during intracellular signaling or in response to therapy.199,217,218 Interactions between drugs and their respective receptors can be studied using luciferase-based novel sensors.219,220 BLI can be used to study the proteosome function and its response to therapeutic drugs,221,222 gene expression, 223,224 and for T cell imaging 225 in vivo. Dynamic BLI has been employed for tumor drug development to study their effect on the neoplastic cells.226
NIR fluorescent probes have been used to detect protease activity in vivo and are powerful tools for spatial and temporal analyses of molecular mechanisms of disease activity.227,228 GFP-FLI can be applied for characterization of spatial and temporal dynamics of gene expression, protein localization, and protein–protein interactions in living cells.212,213 Fluorescence resonance energy transfer (FRET) is an established technique to study protein–protein interactions.215 Fluorescence signals from tumors can be quantified (see Figure 9). FLI has also been used to track tumor growth in real time229,230 to analyze tumor–host interactions and to study the tumor response to therapeutic agents.231 GFPs and RFPs are particularly useful for labeling of primary and metastatic tumor cells.231 FLI has several advantages over BLI for tumor imaging.231 Intravital microscopy can be performed at the single cell level231,232 and can be used for real-time tracking of tumor angiogenesis in vivo.231 Multiphoton laser scanning microscopy can also be performed to detect tumor angiogenesis in vivo through a window created on the skin surface.233 In vivo stem cell tracking has also been performed using FLI.234
FIGURE 9.
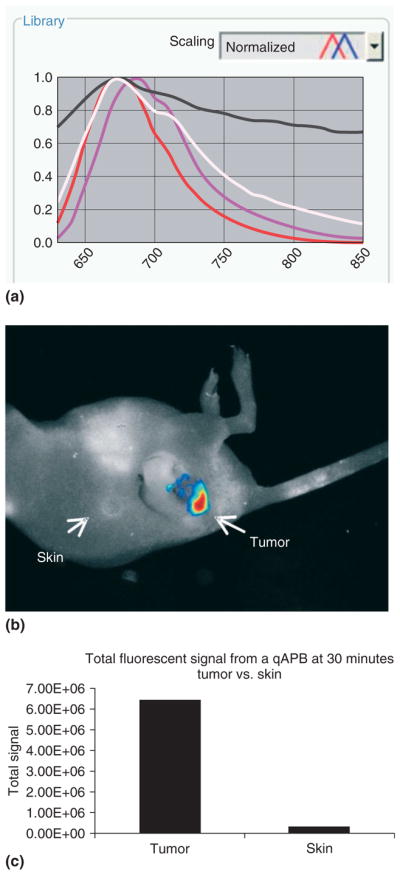
Spectral analysis can be performed to quantify tumor-specific probe activation using a Maestro™ small animal in vivo imaging system. Here, a quenched activity-based imaging probe was injected intravenously and labeled a tumor in vivo. Total fluorescent signal from the tumor and the normal skin is quantified. (a) Spectral curves for each fluorophore as well as for autofluorescence can be generated and saved into a spectral library. Individual curves: white, mouse body; black, imaging stage; red, probe in vivo; magenta, pure probe. (b) By using spectral decomposition and artificial coloration for each spectral curve, a composite image is obtained. A ‘hotmap’ of the probe in vivo shows total fluorescent intensity of the imaging probe within the tumor. (c) Regions of interest can be delineated manually for quantitative analysis of images. (Image courtesy of Jennifer Cutter, NFCR Center for Molecular Imaging, Case Western Reserve University, Cleveland, OH, USA).
OCT has been applied for gastrointestinal, ocular, and skin imaging. However, because of very low depth penetration, its applications are limited to superficial imaging only.197,235
Challenges and Future Prospects
Limited depth penetration, restricted image planes, and nonlinear relationships between signal intensity, tissue heterogeneity, and depth are a few limitations of optical imaging techniques. Although these techniques enable detection of molecules in concentrations within femtomolar ranges, the information provided by these techniques is qualitative. The use of GFPs can confound the experimental results by altering the transcription and translation rates of the cells.236 In addition, the surrounding protein cavity (steric hindrance) can also influence the fluorescence of the fluorophores.237 The major advantages of optical imaging techniques are their relatively low operational costs, simple imaging procedures, absence of ionization radiation exposure, quick image acquisition, and ability to image multiple animals repetitively over a long period of time. Recent development of fluorophores in the NIR range has allowed for imaging of tissues as deep as 7–14 cm.238 Intravital microscopy can also be used to image deeper tissues in vivo.231 Multispectral imaging has enabled separation and quantification of multiple fluorophores at the same time.239 Recent developments in BLI concentrate primarily on creating red-shifted luciferase reporter systems for more efficient light transmission through the tissues. Techniques for real-time BLI of moving rodents240 and dynamic BLI226,241 have also been developed in the recent past. Today, optical imaging is transforming the way investigators translate gene and protein expression into real-time events.
NEW FRONTIERS IN MULTIMODALITY IMAGING
In order to synergize the information provided by different kinds of images, images produced by two or more techniques are often combined together. There are two common options for combining the images. The first option is coregistration, or fusion, of images acquired from different imaging systems (e.g., MRI and PET, SPECT, and CT).242,243 This works well for rigid and relatively immobile organs such as the brain. However, for the thorax, abdomen, and pelvis, where organs are relatively more mobile and deformable, the process of registration of sequentially acquired images becomes more complicated. This leads to the second option: development of new imaging systems for simultaneous or sequential imaging of the same volume with minimal movement.243 Simultaneous imaging is also important for the analysis of dynamic processes such as contrast enhancement, where sets of information need to be acquired simultaneously at different point of times. Various dedicated dual-modality imaging systems have been designed for small animal imaging. In dedicated SPECT–CT154 and PET–CT244 (see Figure 10) systems, structural data from CT images are also used to generate attenuation correction maps for SPECT and PET image reconstruction, respectively. Dedicated SPECT–CT systems have found applications for oncology research,154 development of radiolabeled nanobodies245 and gene therapy vectors,246 and investigation of various disease models.247 PET–CT is principally employed for oncologic imaging.248 MRI compatible optical imaging systems have been developed.249 Dedicated PET–MRI,250 SPECT–MRI,251 and optical-PET252 systems have also been developed for small animal imaging. PET–MRI imaging would be particularly useful for animal research. It provides an opportunity to combine functional information from PET with anatomical as well as various other kinds of information (i.e., functional, metabolic, or perfusion) from MRI.253 Multimodality contrast agents are also being developed nowadays which enable analyses of the same event by multiple imaging techniques. A number of dual-modality probes have been described for in vivo molecular imaging.254,255 Multimodal contrast agents have been developed for corroboration of MRI with other modalities.15,256 A novel triple-modality reporter gene for whole-body fluorescent, bioluminescent, and nuclear imaging have been reported.257 Synergistically integrated nanoparticles are being projected as an excellent candidate to be multimodal probes for nanobiotechnology.258
FIGURE 10.

Simultaneous in vivo 18F-FDG-positron emission tomography (PET) and computed tomography (CT) scans of a mouse 50 min after injection of 8.5 MBq of [18F]FDG. Note the strong signal in the kidneys and bladder in the PET images (transverse slice in (b), coronal slice in (e)) and the corresponding position of the kidneys and bladder in the CT images (transverse slice in (a), coronal slice in (d)). The fused transverse slice is shown in (c) and the coronal slice in (f). The scan was acquired using 200 views within a total scan time of 18 min. (Reprinted with permission from Ref 259. Copyright 2002 IOP Publishing Ltd.).
CONCLUSION
Comparative analyses of the basic principle of image formation, image acquisition times, important applications, strengths, and limitations of the individual imaging techniques can be found elsewhere.1,2 Maximum spatial resolution, sensitivity, and tissue depth penetration of these techniques have been compared in another review.258 None of the imaging techniques are free of limitations or serves every purpose of image acquisition from all areas of the animal. PET and SPECT have very high sensitivity, down to picomolar and nanomolar concentrations, respectively. Superb sensitivity enables application of these imaging techniques for quantitative analysis of tumor cell metabolism. Availability of a variety of probes and strategies confer PET a high degree of versatility. The ability to detect multiple probes simultaneously and the availability of radioisotopes with longer half-life are some of advantages of SPECT over PET; however, they are limited in their spatial resolution.
Amongst structural imaging techniques, MRI provides images with high spatial resolution and can provide anatomical, functional, metabolic as well as molecular information in the same setting. Exposure to RF waves and magnetic fields does not affect animal pathophysiology to a significant extent. μCT also provides images with excellent spatial resolution and is particularly useful for imaging of bones and lungs. Although not typically a significant issue in clinical CT imaging, very high X-ray doses required for μCT imaging could decrease the life expectancy and confound the experimental results by altering the pathophysiology of the animals. Ultrasound is more applicable to analyze tissue physiology relatively close to the surface of the live animal in real time. Optical imaging techniques provide molecular sensitivity down to femtomolar ranges. BLI provides a relative measure of cell viability or cell function and has a high throughput. FLI is a versatile method that can perform multiplexed imaging by using multiple reporter wavelengths.1,2 Tomographic (i.e., image slices) techniques are only now emerging with BLI and FLI. However, low tissue depth penetration and qualitative nature of results are significant drawbacks of optical imaging techniques.
In conclusion, we provided a broad overview of various imaging techniques and their emerging applications for whole animal research. Information provided here is expected to provide an insight into the vast field of whole animal imaging to scientists involved in translational research. Translational research plays a vital role in translation of scientific research into practical applications (bench-to-bedside) and hence enables development of new techniques for management of human ailments. Overall, in vivo biomedical imaging techniques provide an important tool in the armamentarium of biomedical researchers today, and offer great potential for future impact on advancement of human society.
Acknowledgments
The authors acknowledge Drs Keith McCrae, Agata Exner, Raymond Muzic, David Dean, Xin Yu, Chris Flask, Bernadette Erokwu, and Joseph Molter from Case Center for Imaging Research (Case Western Reserve University, Cleveland, Ohio) for providing images.
References
- 1.Koo V, Hamilton PW, Williamson K. Non-invasive in vivo imaging in small animal research. Cell Oncol. 2006;28:127–139. doi: 10.1155/2006/245619. [DOI] [PMC free article] [PubMed] [Google Scholar]
- 2.Lyons SK. Advances in imaging mouse tumour models in vivo. J Pathol. 2005;205:194–205. doi: 10.1002/path.1697. [DOI] [PubMed] [Google Scholar]
- 3.Ritman EL. Small-animal CT - its difference from, and impact on, clinical CT. Nucl Instrum Methods Phys Res A. 2007;580:968–970. doi: 10.1016/j.nima.2007.06.040. [DOI] [PMC free article] [PubMed] [Google Scholar]
- 4.Badea CT, Drangova M, Holdsworth DW, Johnson GA. In vivo small-animal imaging using micro-CT and digital subtraction angiography. Phys Med Biol. 2008;53:319–350. doi: 10.1088/0031-9155/53/19/R01. [DOI] [PMC free article] [PubMed] [Google Scholar]
- 5.Badea CT, Fubara B, Hedlund LW, Johnson GA. 4-D micro-CT of the mouse heart. Mol Imaging. 2005;4:110–116. doi: 10.1162/15353500200504187. [DOI] [PubMed] [Google Scholar]
- 6.Drangova M, Ford NL, Detombe SA, Wheatley AR, Holdsworth DW. Fast retrospectively gated quantitative four-dimensional (4D) cardiac micro computed tomography imaging of free-breathing mice. Invest Radiol. 2007;42:85–94. doi: 10.1097/01.rli.0000251572.56139.a3. [DOI] [PubMed] [Google Scholar]
- 7.Badea CT, Hedlund LW, De Lin M, Mackel JS, Samei E, et al. Tomographic digital subtraction angiography for lung perfusion estimation in rodents. Med Phys. 2007;34:1546–1555. doi: 10.1118/1.2717384. [DOI] [PMC free article] [PubMed] [Google Scholar]
- 8.Popovtzer R, Agrawal A, Kotov NA, et al. Targeted gold nanoparticles enable molecular CT imaging of cancer. Nano Lett. 2008;8:4593–4596. doi: 10.1021/nl8029114. [DOI] [PMC free article] [PubMed] [Google Scholar]
- 9.Weichert JP, Longino MA, Bakan DA, et al. Polyiodinated triglyceride analogs as potential computed tomography imaging agents for the liver. J Med Chem. 1995;38:636–646. doi: 10.1021/jm00004a010. [DOI] [PubMed] [Google Scholar]
- 10.Weber SM, Peterson KA, Durkee B, et al. Imaging of murine liver tumor using microCT with a hepatocyte-selective contrast agent: accuracy is dependent on adequate contrast enhancement. J Surg Res. 2004;119:41–45. doi: 10.1016/S0022-4804(03)00357-3. [DOI] [PubMed] [Google Scholar]
- 11.Badea CT, Hedlund LW, De Lin M, Boslego Mackel JF, Johnson GA. Tumor imaging in small animals with a combined micro-CT/micro-DSA system using iodinated conventional and blood pool contrast agents. Contrast Media Mol Imaging. 2006;1:153–164. doi: 10.1002/cmmi.103. [DOI] [PubMed] [Google Scholar]
- 12.Chouker A, Lizak M, Schimel D, et al. Comparison of Fenestra VC Contrast-enhanced computed tomography imaging with gadopentetate dimeglumine and ferucarbotran magnetic resonance imaging for the in vivo evaluation of murine liver damage after ischemia and reperfusion. Invest Radiol. 2008;43:77–91. doi: 10.1097/RLI.0b013e318155aa2e. [DOI] [PubMed] [Google Scholar]
- 13.Henning T, Weber AW, Bauer JS, et al. Imaging characteristics of DHOG, a hepatobiliary contrast agent for preclinical microCT in mice. Acad Radiol. 2008;15:342–349. doi: 10.1016/j.acra.2007.10.007. [DOI] [PubMed] [Google Scholar]
- 14.Kattumuri V, Katti K, Bhaskaran S, et al. Gum arabic as a phytochemical construct for the stabilization of gold nanoparticles: in vivo pharmacokinetics and X-ray-contrast-imaging studies. Small. 2007;3:333–341. doi: 10.1002/smll.200600427. [DOI] [PubMed] [Google Scholar]
- 15.Alric C, Taleb J, Le Duc G, et al. Gadolinium chelate coated gold nanoparticles as contrast agents for both X-ray computed tomography and magnetic resonance imaging. J Am Chem Soc. 2008;130:5908–5915. doi: 10.1021/ja078176p. [DOI] [PubMed] [Google Scholar]
- 16.Cai QY, Kim SH, Choi KS, et al. Colloidal gold nanoparticles as a blood-pool contrast agent for X-ray computed tomography in mice. Invest Radiol. 2007;42:797–806. doi: 10.1097/RLI.0b013e31811ecdcd. [DOI] [PubMed] [Google Scholar]
- 17.Rabin O, Manuel Perez J, Grimm J, Wojtkiewicz G, Weissleder R. An X-ray computed tomography imaging agent based on long-circulating bismuth sulphide nanoparticles. Nat Mater. 2006;5:118–122. doi: 10.1038/nmat1571. [DOI] [PubMed] [Google Scholar]
- 18.Mukundan S, Jr, Ghaghada KB, Badea CT, et al. A liposomal nanoscale contrast agent for preclinical CT in mice. Am J Roentgenol. 2006;186:300–307. doi: 10.2214/AJR.05.0523. [DOI] [PubMed] [Google Scholar]
- 19.Ferrari M. Cancer nanotechnology: opportunities and challenges. Nat Rev Cancer. 2005;5:161–171. doi: 10.1038/nrc1566. [DOI] [PubMed] [Google Scholar]
- 20.Wyss C, Schaefer SC, Juillerat-Jeanneret L, et al. Molecular imaging by micro-CT: specific E-selectin imaging. Eur Radiol. 2009;19:2487–2494. doi: 10.1007/s00330-009-1434-2. [DOI] [PubMed] [Google Scholar]
- 21.Friedman PJ, Tisi GM. “Alveolarization” of tantalum powder in experimental bronchography and the clearance of inhaled particles from the lung. Radiology. 1972;104:523–535. doi: 10.1148/104.3.523. [DOI] [PubMed] [Google Scholar]
- 22.Lam WW, Holdsworth DW, Du LY, Drangova M, McCormack DG, et al. Micro-CT imaging of rat lung ventilation using continuous image acquisition during xenon gas contrast enhancement. J Appl Physiol. 2007;103:1848–1856. doi: 10.1152/japplphysiol.00009.2007. [DOI] [PubMed] [Google Scholar]
- 23.Badea CT, Schreibmann E, Fox T. A registration based approach for 4D cardiac micro-CT using combined prospective and retrospective gating. Med Phys. 2008;35:1170–1179. doi: 10.1118/1.2868778. [DOI] [PMC free article] [PubMed] [Google Scholar]
- 24.Detombe SA, Ford NL, Xiang F, Lu X, Feng Q, et al. Longitudinal follow-up of cardiac structure and functional changes in an infarct mouse model using retrospectively gated micro-computed tomography. Invest Radiol. 2008;43:520–529. doi: 10.1097/RLI.0b013e3181727519. [DOI] [PubMed] [Google Scholar]
- 25.Clauss SB, Walker DL, Kirby ML, Schimel D, Lo CW. Patterning of coronary arteries in wildtype and connexin43 knockout mice. Dev Dyn. 2006;235:2786–2794. doi: 10.1002/dvdy.20887. [DOI] [PubMed] [Google Scholar]
- 26.Badea CT, Bucholz E, Hedlund LW, Rockman HA, Johnson GA. Imaging methods for morphological and functional phenotyping of the rodent heart. Toxicol Pathol. 2006;34:111–117. doi: 10.1080/01926230500404126. [DOI] [PubMed] [Google Scholar]
- 27.Walters EB, Panda K, Bankson JA, Brown E, Cody DD. Improved method of in vivo respiratory-gated micro-CT imaging. Phys Med Biol. 2004;49:4163–4172. doi: 10.1088/0031-9155/49/17/023. [DOI] [PubMed] [Google Scholar]
- 28.Bolender RP, Hyde DM, Dehoff RT. Lung morphometry: a new generation of tools and experiments for organ, tissue, cell, and molecular biology. Am J Physiol. 1993;265:521–548. doi: 10.1152/ajplung.1993.265.6.L521. [DOI] [PubMed] [Google Scholar]
- 29.Shofer S, Badea C, Auerbach S, Schwartz DA, Johnson GA. A micro-computed tomography-based method for the measurement of pulmonary compliance in healthy and bleomycin-exposed mice. Exp Lung Res. 2007;33:169–183. doi: 10.1080/01902140701364458. [DOI] [PMC free article] [PubMed] [Google Scholar]
- 30.Molthen RC, Karau KL, Dawson CA. Quantitative models of the rat pulmonary arterial tree morphometry applied to hypoxia-induced arterial remodeling. J Appl Physiol. 2004;97:2372–2384. doi: 10.1152/japplphysiol.00454.2004. discussion 2354. [DOI] [PubMed] [Google Scholar]
- 31.Langheinrich AC, Leithauser B, Greschus S, et al. Acute rat lung injury: feasibility of assessment with micro-CT. Radiology. 2004;233:165–171. doi: 10.1148/radiol.2331031340. [DOI] [PubMed] [Google Scholar]
- 32.Cody DD, Nelson CL, Bradley WM, et al. Murine lung tumor measurement using respiratory-gated micro-computed tomography. Invest Radiol. 2005;40:263–269. doi: 10.1097/01.rli.0000160070.67270.05. [DOI] [PubMed] [Google Scholar]
- 33.Hori Y, Takasuka N, Mutoh M, et al. Periodic analysis of urethane-induced pulmonary tumors in living A/J mice by respiration-gated X-ray microcomputed tomography. Cancer Sci. 2008;99:1774–1777. doi: 10.1111/j.1349-7006.2008.00889.x. [DOI] [PMC free article] [PubMed] [Google Scholar]
- 34.Postnov AA, Meurrens K, Weiler H, et al. In vivo assessment of emphysema in mice by high resolution X-ray microtomography. J Microsc. 2005;220:70–75. doi: 10.1111/j.1365-2818.2005.01510.x. [DOI] [PubMed] [Google Scholar]
- 35.Montet X, Pastor CM, Vallee JP, et al. Improved visualization of vessels and hepatic tumors by microcomputed tomography (CT) using iodinated liposomes. Invest Radiol. 2007;42:652–658. doi: 10.1097/RLI.0b013e31805f445b. [DOI] [PubMed] [Google Scholar]
- 36.Kim HW, Cai QY, Jun HY, et al. Micro-CT imaging with a hepatocyte-selective contrast agent for detecting liver metastasis in living mice. Acad Radiol. 2008;15:1282–1290. doi: 10.1016/j.acra.2008.03.021. [DOI] [PubMed] [Google Scholar]
- 37.Graham KC, Detombe SA, MacKenzie LT, et al. Contrast-enhanced microcomputed tomography using intraperitoneal contrast injection for the assessment of tumor-burden in liver metastasis models. Invest Radiol. 2008;43:488–495. doi: 10.1097/RLI.0b013e318172f5b5. [DOI] [PubMed] [Google Scholar]
- 38.Wan SY, Ritman EL, Higgins WE. Multi-generational analysis and visualization of the vascular tree in 3D micro-CT images. Comput Biol Med. 2002;32:55–71. doi: 10.1016/s0010-4825(01)00034-8. [DOI] [PubMed] [Google Scholar]
- 39.Fortepiani LA, Ruiz MC, Passardi F, et al. Effect of losartan on renal microvasculature during chronic inhibition of nitric oxide visualized by micro-CT. Am J Physiol Renal Physiol. 2003;285:852–860. doi: 10.1152/ajprenal.00120.2003. [DOI] [PubMed] [Google Scholar]
- 40.Ortiz MC, Garcia-Sanz A, Bentley MD, et al. Microcomputed tomography of kidneys following chronic bile duct ligation. Kidney Int. 2000;58:1632–1640. doi: 10.1111/j.1523-1755.2000.00324.x. [DOI] [PubMed] [Google Scholar]
- 41.Garcia-Sanz A, Rodriguez-Barbero A, Bentley MD, Ritman EL, Romero JC. Three-dimensional microcomputed tomography of renal vasculature in rats. Hypertension. 1998;31:440–444. doi: 10.1161/01.hyp.31.1.440. [DOI] [PubMed] [Google Scholar]
- 42.Bentley MD, Ortiz MC, Ritman EL, Romero JC. The use of microcomputed tomography to study microvasculature in small rodents. Am J Physiol Regul Integr Comp Physiol. 2002;282:1267–1279. doi: 10.1152/ajpregu.00560.2001. [DOI] [PubMed] [Google Scholar]
- 43.Bentley MD, Jorgensen SM, Lerman LO, Ritman EL, Romero JC. Visualization of three-dimensional nephron structure with microcomputed tomography. Anat Rec (Hoboken) 2007;290:277–283. doi: 10.1002/ar.20422. [DOI] [PubMed] [Google Scholar]
- 44.David V, Laroche N, Boudignon B, et al. Noninvasive in vivo monitoring of bone architecture alterations in hindlimb-unloaded female rats using novel three-dimensional microcomputed tomography. J Bone Miner Res. 2003;18:1622–1631. doi: 10.1359/jbmr.2003.18.9.1622. [DOI] [PubMed] [Google Scholar]
- 45.Peyrin F, Salome M, Cloetens P, Laval-Jeantet AM, Ritman E, et al. Micro-CT examinations of trabecular bone samples at different resolutions: 14, 7 and 2 micron level. Technol Health Care. 1998;6:391–401. [PubMed] [Google Scholar]
- 46.Chappard C, Basillais A, Benhamou L, et al. Comparison of synchrotron radiation and conventional x-ray microcomputed tomography for assessing trabecular bone microarchitecture of human femoral heads. Med Phys. 2006;33:3568–3577. doi: 10.1118/1.2256069. [DOI] [PubMed] [Google Scholar]
- 47.Pattijn V, Van Cleynenbreugel T, Vander Sloten J, Van Audekercke R, Van der Perre G, et al. Structural and radiological parameters for the nondestructive characterization of trabecular bone. Ann Biomed Eng. 2001;29:1064–1073. doi: 10.1114/1.1424922. [DOI] [PubMed] [Google Scholar]
- 48.Barou O, Valentin D, Vico L, et al. High-resolution three-dimensional micro-computed tomography detects bone loss and changes in trabecular architecture early: comparison with DEXA and bone histomorphometry in a rat model of disuse osteoporosis. Invest Radiol. 2002;37:40–46. doi: 10.1097/00004424-200201000-00008. [DOI] [PubMed] [Google Scholar]
- 49.Leander P. A new liposomal contrast medium for CT of the liver. An imaging study in a rabbit tumour model. Acta Radiol. 1996;37:63–68. doi: 10.1177/02841851960371P113. [DOI] [PubMed] [Google Scholar]
- 50.Fushiki H, Kanoh-Azuma T, Katoh M, et al. Quantification of mouse pulmonary cancer models by microcomputed tomography imaging. Cancer Sci. 2009;100:1544–1549. doi: 10.1111/j.1349-7006.2009.01199.x. [DOI] [PMC free article] [PubMed] [Google Scholar]
- 51.Kiessling F, Greschus S, Lichy MP, et al. Volumetric computed tomography (VCT): a new technology for noninvasive, high-resolution monitoring of tumor angiogenesis. Nat Med. 2004;10:1133–1138. doi: 10.1038/nm1101. [DOI] [PubMed] [Google Scholar]
- 52.Choquet P, Calon A, Breton E, et al. Multiple-contrast X-ray micro-CT visualization of colon malformations and tumours in situ in living mice. C R Biol. 2007;330:821–827. doi: 10.1016/j.crvi.2007.08.002. [DOI] [PubMed] [Google Scholar]
- 53.Pickhardt PJ, Halberg RB, Taylor AJ, et al. Microcomputed tomography colonography for polyp detection in an in vivo mouse tumor model. Proc Natl Acad Sci U S A. 2005;102:3419–3422. doi: 10.1073/pnas.0409915102. [DOI] [PMC free article] [PubMed] [Google Scholar]
- 54.Brown SL, Freytag SO, Barton KN, et al. Reporter gene imaging using radiographic contrast from non-radioactive iodide sequestered by the sodium-iodide symporter. Contrast Media Mol Imaging. 2007;2:240–247. doi: 10.1002/cmmi.150. [DOI] [PubMed] [Google Scholar]
- 55.Kobayashi S, Hori M, Dono K, et al. In vivo real-time microangiography of the liver in mice using synchrotron radiation. J Hepatol. 2004;40:405–408. doi: 10.1016/j.jhep.2003.11.029. [DOI] [PubMed] [Google Scholar]
- 56.de Lin M, Ning L, Badea CT, Mistry NN, Qi Y, et al. A high-precision contrast injector for small animal x-ray digital subtraction angiography. IEEE Trans Biomed Eng. 2008;55:1082–1091. doi: 10.1109/TBME.2007.909541. [DOI] [PMC free article] [PubMed] [Google Scholar]
- 57.Siablis D, Liatsikos EN, Karnabatidis D, et al. Digital subtraction angiography and computer assisted image analysis for the evaluation of the antiangiogenetic effect of ionizing radiation on tumor angiogenesis. Int Urol Nephrol. 2006;38:407–411. doi: 10.1007/s11255-005-3617-3. [DOI] [PubMed] [Google Scholar]
- 58.Ritman EL. Vision 20/20: increased image resolution versus reduced radiation exposure. Med Phys. 2008;35:2502–2512. doi: 10.1118/1.2919112. [DOI] [PubMed] [Google Scholar]
- 59.Badea CT, Wetzel AW, Mistry N, Pomerantz S, Nave D, et al. Left ventricle volume measurements in cardiac micro-CT: the impact of radiation dose and contrast agent. Comput Med Imaging Graph. 2008;32:239–250. doi: 10.1016/j.compmedimag.2007.12.004. [DOI] [PMC free article] [PubMed] [Google Scholar]
- 60.Harding G, Kosanetzky J, Neitzel U. X-ray diffraction computed tomography. Med Phys. 1987;14:515–525. doi: 10.1118/1.596063. [DOI] [PubMed] [Google Scholar]
- 61.Beckmann F, Bonse U, Busch F, Gunnewig O. X-ray microtomography (microCT) using phase contrast for the investigation of organic matter. J Comput Assist Tomogr. 1997;21:539–553. doi: 10.1097/00004728-199707000-00006. [DOI] [PubMed] [Google Scholar]
- 62.Boretius S, Kasper L, Tammer R, Michaelis T, Frahm J. MRI of cellular layers in mouse brain in vivo. Neuroimage. 2009;47:1252–1260. doi: 10.1016/j.neuroimage.2009.05.095. [DOI] [PubMed] [Google Scholar]
- 63.Brockmann MA, Kemmling A, Groden C. Current issues and perspectives in small rodent magnetic resonance imaging using clinical MRI scanners. Methods. 2007;43:79–87. doi: 10.1016/j.ymeth.2007.07.001. [DOI] [PubMed] [Google Scholar]
- 64.Poirier-Quinot M, Ginefri JC, Girard O, Robert P, Darrasse L. Performance of a miniature high-temperature superconducting (HTS) surface coil for in vivo microimaging of the mouse in a standard 1. 5T clinical whole-body scanner. Magn Reson Med. 2008;60:917–927. doi: 10.1002/mrm.21605. [DOI] [PubMed] [Google Scholar]
- 65.McGowan JC. Basic principles of magnetic resonance imaging. Neuroimaging Clin N Am. 2008;18:623–636 x. doi: 10.1016/j.nic.2008.06.004. [DOI] [PubMed] [Google Scholar]
- 66.Bitar R, Leung G, Perng R, et al. MR pulse sequences: what every radiologist wants to know but is afraid to ask. Radiographics. 2006;26:513–537. doi: 10.1148/rg.262055063. [DOI] [PubMed] [Google Scholar]
- 67.Nitz WR, Reimer P. Contrast mechanisms in MR imaging. Eur Radiol. 1999;9:1032–1046. doi: 10.1007/s003300050789. [DOI] [PubMed] [Google Scholar]
- 68.Hylton N. Dynamic contrast-enhanced magnetic resonance imaging as an imaging biomarker. J Clin Oncol. 2006;24:3293–3298. doi: 10.1200/JCO.2006.06.8080. [DOI] [PubMed] [Google Scholar]
- 69.Keston P, Murray AD, Jackson A. Cerebral perfusion imaging using contrast-enhanced MRI. Clin Radiol. 2003;58:505–513. doi: 10.1016/s0009-9260(03)00130-2. [DOI] [PubMed] [Google Scholar]
- 70.Ostergaard L. Principles of cerebral perfusion imaging by bolus tracking. J Magn Reson Imaging. 2005;22:710–717. doi: 10.1002/jmri.20460. [DOI] [PubMed] [Google Scholar]
- 71.Liu TT, Brown GG. Measurement of cerebral perfusion with arterial spin labeling: part 1. Methods J Int Neuropsychol Soc. 2007;13:517–525. doi: 10.1017/S1355617707070646. [DOI] [PubMed] [Google Scholar]
- 72.Van Laar PJ, Van der Grond J, Hendrikse J. Brain perfusion territory imaging: methods and clinical applications of selective arterial spin-labeling MR imaging. Radiology. 2008;246:354–364. doi: 10.1148/radiol.2462061775. [DOI] [PubMed] [Google Scholar]
- 73.Brown GG, Perthen JE, Liu TT, Buxton RB. A primer on functional magnetic resonance imaging. Neuropsychol Rev. 2007;17:107–125. doi: 10.1007/s11065-007-9028-8. [DOI] [PubMed] [Google Scholar]
- 74.Mukherjee P, Berman JI, Chung SW, Hess CP, Henry RG. Diffusion tensor MR imaging and fiber tractography: theoretic underpinnings. Am J Neuroradiol. 2008;29:632–641. doi: 10.3174/ajnr.A1051. [DOI] [PMC free article] [PubMed] [Google Scholar]
- 75.Skoch A, Jiru F, Bunke J. Spectroscopic imaging: basic principles. Eur J Radiol. 2008;67:230–239. doi: 10.1016/j.ejrad.2008.03.003. [DOI] [PubMed] [Google Scholar]
- 76.Serkova NJ, Hasebroock KM, Kraft SL. Magnetic resonance spectroscopy of living tissues. Methods Mol Biol. 2009;520:315–327. doi: 10.1007/978-1-60327-811-9_22. [DOI] [PubMed] [Google Scholar]
- 77.Schaeffter T, Dahnke H. Magnetic resonance imaging and spectroscopy. Handb Exp Pharmacol. 2008;185:75–90. doi: 10.1007/978-3-540-72718-7_4. [DOI] [PubMed] [Google Scholar]
- 78.Geraldes CF, Laurent S. Classification and basic properties of contrast agents for magnetic resonance imaging. Contrast Media Mol Imaging. 2009;4:1–23. doi: 10.1002/cmmi.265. [DOI] [PubMed] [Google Scholar]
- 79.Burtea C, Laurent S, Vander Elst L, Muller RN. Contrast agents: magnetic resonance. Handb Exp Pharmacol. 2008;185:135–165. doi: 10.1007/978-3-540-72718-7_7. [DOI] [PubMed] [Google Scholar]
- 80.Modo M, Hoehn M, Bulte JW. Cellular MR imaging. Mol Imaging. 2005;4:143–164. doi: 10.1162/15353500200505145. [DOI] [PubMed] [Google Scholar]
- 81.Leergaard TB, Bjaalie JG, Devor A, Wald LL, Dale AM. In vivo tracing of major rat brain pathways using manganese-enhanced magnetic resonance imaging and three-dimensional digital atlasing. Neuroimage. 2003;20:1591–1600. doi: 10.1016/j.neuroimage.2003.07.009. [DOI] [PubMed] [Google Scholar]
- 82.Silva AC, Bock NA. Manganese-enhanced MRI: an exceptional tool in translational neuroimaging. Schizophr Bull. 2008;34:595–604. doi: 10.1093/schbul/sbn056. [DOI] [PMC free article] [PubMed] [Google Scholar]
- 83.Ohno Y, Hatabu H. Basics concepts and clinical applications of oxygen-enhanced MR imaging. Eur J Radiol. 2007;64:320–328. doi: 10.1016/j.ejrad.2007.08.006. [DOI] [PubMed] [Google Scholar]
- 84.Mai VM. Hyperpolarized gas and oxygen-enhanced magnetic resonance imaging. Methods Mol Med. 2006;124:325–345. doi: 10.1385/1-59745-010-3:323. [DOI] [PubMed] [Google Scholar]
- 85.McAdams HP, Hatabu H, Donnelly LF, Chen Q, Tadamura E, et al. Novel techniques for MR imaging of pulmonary airspaces. Magn Reson Imaging Clin N Am. 2000;8:205–219. [PubMed] [Google Scholar]
- 86.Yang JJ, Yang J, Wei L, et al. Rational design of protein-based MRI contrast agents. J Am Chem Soc. 2008;130:9260–9267. doi: 10.1021/ja800736h. [DOI] [PMC free article] [PubMed] [Google Scholar]
- 87.Budde MD, Frank JA. Magnetic tagging of therapeutic cells for MRI. J Nucl Med. 2009;50:171–174. doi: 10.2967/jnumed.108.053546. [DOI] [PMC free article] [PubMed] [Google Scholar]
- 88.Genove G, DeMarco U, Xu H, Goins WF, Ahrens ET. A new transgene reporter for in vivo magnetic resonance imaging. Nat Med. 2005;11:450–454. doi: 10.1038/nm1208. [DOI] [PubMed] [Google Scholar]
- 89.Cohen B, Ziv K, Plaks V, et al. MRI detection of transcriptional regulation of gene expression in transgenic mice. Nat Med. 2007;13:498–503. doi: 10.1038/nm1497. [DOI] [PubMed] [Google Scholar]
- 90.Zurkiya O, Chan AW, Hu X. MagA is sufficient for producing magnetic nanoparticles in mammalian cells, making it an MRI reporter. Magn Reson Med. 2008;59:1225–1231. doi: 10.1002/mrm.21606. [DOI] [PMC free article] [PubMed] [Google Scholar]
- 91.Zhao D, Jiang L, Mason RP. Measuring changes in tumor oxygenation. Methods Enzymol. 2004;386:378–418. doi: 10.1016/S0076-6879(04)86018-X. [DOI] [PubMed] [Google Scholar]
- 92.Que EL, Gianolio E, Baker SL, Wong AP, Aime S, et al. Copper-responsive magnetic resonance imaging contrast agents. J Am Chem Soc. 2009;131:8527–8536. doi: 10.1021/ja900884j. [DOI] [PubMed] [Google Scholar]
- 93.Major JL, Boiteau RM, Meade TJ. Mechanisms of ZnII-activated magnetic resonance imaging agents. Inorg Chem. 2008;47:10788–10795. doi: 10.1021/ic801458u. [DOI] [PMC free article] [PubMed] [Google Scholar]
- 94.Sherry AD, Woods M. Chemical exchange saturation transfer contrast agents for magnetic resonance imaging. Annu Rev Biomed Eng. 2008;10:391–411. doi: 10.1146/annurev.bioeng.9.060906.151929. [DOI] [PMC free article] [PubMed] [Google Scholar]
- 95.Tyszka JM, Fraser SE, Jacobs RE. Magnetic resonance microscopy: recent advances and applications. Curr Opin Biotechnol. 2005;16:93–99. doi: 10.1016/j.copbio.2004.11.004. [DOI] [PubMed] [Google Scholar]
- 96.Driehuys B, Nouls J, Badea A, et al. Small animal imaging with magnetic resonance microscopy. Ilar J. 2008;49:35–53. doi: 10.1093/ilar.49.1.35. [DOI] [PMC free article] [PubMed] [Google Scholar]
- 97.Kiessling F. Noninvasive cell tracking. Handb Exp Pharmacol. 2008;185:305–321. doi: 10.1007/978-3-540-77496-9_13. [DOI] [PubMed] [Google Scholar]
- 98.Pirko I, Fricke ST, Johnson AJ, Rodriguez M, Macura SI. Magnetic resonance imaging, microscopy, and spectroscopy of the central nervous system in experimental animals. Neuro Rx. 2005;2:250–264. doi: 10.1602/neurorx.2.2.250. [DOI] [PMC free article] [PubMed] [Google Scholar]
- 99.Rodriguez I, Perez-Rial S, Gonzalez-Jimenez J, et al. Magnetic resonance methods and applications in pharmaceutical research. J Pharm Sci. 2008;97:3637–3665. doi: 10.1002/jps.21281. [DOI] [PubMed] [Google Scholar]
- 100.Cohen-Adad J, Benali H, Hoge RD, Rossignol S. In vivo DTI of the healthy and injured cat spinal cord at high spatial and angular resolution. Neuroimage. 2008;40:685–697. doi: 10.1016/j.neuroimage.2007.11.031. [DOI] [PubMed] [Google Scholar]
- 101.Asanuma T, Doblas S, Tesiram YA, et al. Diffusion tensor imaging and fiber tractography of C6 rat glioma. J Magn Reson Imaging. 2008;28:566–573. doi: 10.1002/jmri.21473. [DOI] [PubMed] [Google Scholar]
- 102.Austin VC, Blamire AM, Grieve SM, et al. Differences in the BOLD fMRI response to direct and indirect cortical stimulation in the rat. Magn Reson Med. 2003;49:838–847. doi: 10.1002/mrm.10428. [DOI] [PubMed] [Google Scholar]
- 103.Tenney JR, Duong TQ, King JA, Ferris CF. FMRI of brain activation in a genetic rat model of absence seizures. Epilepsia. 2004;45:576–582. doi: 10.1111/j.0013-9580.2004.39303.x. [DOI] [PMC free article] [PubMed] [Google Scholar]
- 104.Chen F, Suzuki Y, Nagai N, et al. Rodent stroke induced by photochemical occlusion of proximal middle cerebral artery: evolution monitored with MR imaging and histopathology. Eur J Radiol. 2007;63:68–75. doi: 10.1016/j.ejrad.2007.01.005. [DOI] [PubMed] [Google Scholar]
- 105.Ulmer S, Reeh M, Krause J, et al. Dynamic contrast-enhanced susceptibility-weighted perfusion MRI (DSC-MRI) in a glioma model of the rat brain using a conventional receive-only surface coil with a inner diameter of 47 mm at a clinical 1. 5 T scanner. J Neurosci Methods. 2008;172:168–172. doi: 10.1016/j.jneumeth.2008.04.022. [DOI] [PubMed] [Google Scholar]
- 106.Claes A, Gambarota G, Hamans B, et al. Magnetic resonance imaging-based detection of glial brain tumors in mice after antiangiogenic treatment. Int J Cancer. 2008;122:1981–1986. doi: 10.1002/ijc.23306. [DOI] [PubMed] [Google Scholar]
- 107.Bucholz E, Ghaghada K, Qi Y, Mukundan S, Johnson GA. Four-dimensional MR microscopy of the mouse heart using radial acquisition and liposomal gadolinium contrast agent. Magn Reson Med. 2008;60:111–118. doi: 10.1002/mrm.21618. [DOI] [PMC free article] [PubMed] [Google Scholar]
- 108.Hogers B, Gross D, Lehmann V, et al. Magnetic resonance microscopy at 17. 6-Tesla on chicken embryos in vitro. J Magn Reson Imaging. 2001;14:83–86. doi: 10.1002/jmri.1155. [DOI] [PubMed] [Google Scholar]
- 109.Smith BR. Magnetic resonance microscopy in cardiac development. Microsc Res Tech. 2001;52:323–330. doi: 10.1002/1097-0029(20010201)52:3<323::AID-JEMT1016>3.0.CO;2-F. [DOI] [PubMed] [Google Scholar]
- 110.Modo M, Mellodew K, Cash D, et al. Mapping transplanted stem cell migration after a stroke: a serial, in vivo magnetic resonance imaging study. Neuroimage. 2004;21:311–317. doi: 10.1016/j.neuroimage.2003.08.030. [DOI] [PubMed] [Google Scholar]
- 111.Hendry SL, II, Van der Bogt KE, Sheikh AY, et al. Multimodal evaluation of in vivo magnetic resonance imaging of myocardial restoration by mouse embryonic stem cells. J Thorac Cardiovasc Surg. 2008;136:1028–1037. e1021. doi: 10.1016/j.jtcvs.2007.12.053. [DOI] [PubMed] [Google Scholar]
- 112.Evgenov NV, Medarova Z, Pratt J, et al. In vivo imaging of immune rejection in transplanted pancreatic islets. Diabetes. 2006;55:2419–2428. doi: 10.2337/db06-0484. [DOI] [PubMed] [Google Scholar]
- 113.Evgenov NV, Medarova Z, Dai G, Bonner-Weir S, Moore A. In vivo imaging of islet transplantation. Nat Med. 2006;12:144–148. doi: 10.1038/nm1316. [DOI] [PubMed] [Google Scholar]
- 114.Wu X, Wang H, Chen F, et al. Rat model of reperfused partial liver infarction: characterization with multiparametric magnetic resonance imaging, microangiography, and histomorphology. Acta Radiol. 2009;50:276–287. doi: 10.1080/02841850802647021. [DOI] [PubMed] [Google Scholar]
- 115.Wang H, Sun X, Chen F, et al. Treatment of rodent liver tumor with combretastatin a4 phosphate: non-invasive therapeutic evaluation using multiparametric magnetic resonance imaging in correlation with microangiography and histology. Invest Radiol. 2009;44:44–53. doi: 10.1097/RLI.0b013e31818e5ace. [DOI] [PubMed] [Google Scholar]
- 116.Wang H, Van de Putte M, Chen F, et al. Murine liver implantation of radiation-induced fibrosarcoma: characterization with MR imaging, microangiography and histopathology. Eur Radiol. 2008;18:1422–1430. doi: 10.1007/s00330-008-0904-2. [DOI] [PubMed] [Google Scholar]
- 117.Gillies RJ, Morse DL. In vivo magnetic resonance spectroscopy in cancer. Annu Rev Biomed Eng. 2005;7:287–326. doi: 10.1146/annurev.bioeng.7.060804.100411. [DOI] [PubMed] [Google Scholar]
- 118.Yu JX, Kodibagkar VD, Cui W, Mason RP. 19F: a versatile reporter for non-invasive physiology and pharmacology using magnetic resonance. Curr Med Chem. 2005;12:819–848. doi: 10.2174/0929867053507342. [DOI] [PubMed] [Google Scholar]
- 119.Yu JX, Cui W, Zhao D, Cui W, Mason RP. Non-invasive physiology and pharmacology using 19F magnetic resonance. In: Tressaud A, Haufe G, editors. Flourine and Health. Elsevier Science and Technology; 2008. pp. 198–276. [Google Scholar]
- 120.Selenko P, Wagner G. Looking into live cells with in-cell NMR spectroscopy. J Struct Biol. 2007;158:244–253. doi: 10.1016/j.jsb.2007.04.001. [DOI] [PubMed] [Google Scholar]
- 121.Constantinescu CC, Mukherjee J. Performance evaluation of an Inveon PET preclinical scanner. Phys Med Biol. 2009;54:2885–2899. doi: 10.1088/0031-9155/54/9/020. [DOI] [PMC free article] [PubMed] [Google Scholar]
- 122.Mitchell GS, Cherry SR. A high-sensitivity small animal SPECT system. Phys Med Biol. 2009;54:1291–1305. doi: 10.1088/0031-9155/54/5/013. [DOI] [PMC free article] [PubMed] [Google Scholar]
- 123.Rowland DJ, Cherry SR. Small-animal preclinical nuclear medicine instrumentation and methodology. Semin Nucl Med. 2008;38:209–222. doi: 10.1053/j.semnuclmed.2008.01.004. [DOI] [PubMed] [Google Scholar]
- 124.Cherry SR, Sorenson JA, Phelps ME. Physics in Nuclear Medicine. Philadelphia, PA: WB Saunders; 2003. [Google Scholar]
- 125.McQuade P, Rowland DJ, Lewis JS, Welch MJ. Positron-emitting isotopes produced on biomedical cyclotrons. Curr Med Chem. 2005;12:807–818. doi: 10.2174/0929867053507397. [DOI] [PubMed] [Google Scholar]
- 126.Qaim S. Decay data and production yields of some non-standard positron emitters used in PET. Q J Nucl Med Mol Imaging. 2008;52:111–120. [PubMed] [Google Scholar]
- 127.Lewis JS, Welch MJ, Tang L. Workshop on the production, application and clinical translation of “non-standard” PET nuclides: a meeting report. Q J Nucl Med Mol Imaging. 2008;52:101–106. [PMC free article] [PubMed] [Google Scholar]
- 128.Jennewein M, Hermanne A, Mason RP, Thorpe PE, Rosch F. A new method for the labelling of proteins with radioactive arsenic isotopes. Nucl Instrum Methods Phys Res A. 2006;569:512–517. [Google Scholar]
- 129.Jennewein M, Schmidt A, Novgorodov AF, Qaim SM, Rösch F. A no-carrier-added 72Se/72As radionuclide generator based on distillation. Radiochim Acta. 2004;92:245–249. [Google Scholar]
- 130.Serdons K, Verbruggen A, Bormans GM. Developing new molecular imaging probes for PET. Methods. 2009;48:104–111. doi: 10.1016/j.ymeth.2009.03.010. [DOI] [PubMed] [Google Scholar]
- 131.Lundqvist H, Tolmachev V. Targeting peptides and positron emission tomography. Biopolymers. 2002;66:381–392. doi: 10.1002/bip.10348. [DOI] [PubMed] [Google Scholar]
- 132.Miller PW, Long NJ, Vilar R, Gee AD. Synthesis of 11C, 18F, 15O, and 13N radiolabels for positron emission tomography. Angew Chem Int Ed Engl. 2008;47:8998–9033. doi: 10.1002/anie.200800222. [DOI] [PubMed] [Google Scholar]
- 133.Hutchins GD, Miller MA, Soon VC, Receveur T. Small animal PET imaging. Ilar J. 2008;49:54–65. doi: 10.1093/ilar.49.1.54. [DOI] [PubMed] [Google Scholar]
- 134.Aoki J, Inoue T, Tomiyoshi K, et al. Nuclear imaging of bone tumors: FDG-PET. Semin Musculoskelet Radiol. 2001;5:183–187. doi: 10.1055/s-2001-15678. [DOI] [PubMed] [Google Scholar]
- 135.Landau BR, Spring-Robinson CL, Muzic RF, Jr, et al. 6-Fluoro-6-deoxy-D-glucose as a tracer of glucose transport. Am J Physiol Endocrinol Metab. 2007;293:E237–E245. doi: 10.1152/ajpendo.00022.2007. [DOI] [PubMed] [Google Scholar]
- 136.Kaufmann PA. 82-Rubidium—the dawn of cardiac PET in Europe? Eur J Nucl Med Mol Imaging. 2007;34:1963–1964. doi: 10.1007/s00259-007-0632-x. [DOI] [PubMed] [Google Scholar]
- 137.Grant FD, Fahey FH, Packard AB, Davis RT, Alavi A, et al. Skeletal PET with 18F-fluoride: applying new technology to an old tracer. J Nucl Med. 2008;49:68–78. doi: 10.2967/jnumed.106.037200. [DOI] [PubMed] [Google Scholar]
- 138.Smith CJ, Volkert WA, Hoffman TJ. Radiolabeled peptide conjugates for targeting of the bombesin receptor superfamily subtypes. Nucl Med Biol. 2005;32:733–740. doi: 10.1016/j.nucmedbio.2005.05.005. [DOI] [PubMed] [Google Scholar]
- 139.Laking GR, Price PM. Positron emission tomographic imaging of angiogenesis and vascular function. Br J Radiol. 2003;76:S50–S59. doi: 10.1259/bjr/30399077. [DOI] [PubMed] [Google Scholar]
- 140.Lahorte CM, Vanderheyden JL, Steinmetz N, Van de Wiele C, Dierckx RA, et al. Apoptosis-detecting radioligands: current state of the art and future perspectives. Eur J Nucl Med Mol Imaging. 2004;31:887–919. doi: 10.1007/s00259-004-1555-4. [DOI] [PubMed] [Google Scholar]
- 141.Kung HF, Kung MP, Choi SR. Radiopharmaceuticals for single-photon emission computed tomography brain imaging. Semin Nucl Med. 2003;33:2–13. doi: 10.1053/snuc.2003.127296. [DOI] [PubMed] [Google Scholar]
- 142.Prvulovich E. Myocardial perfusion scintigraphy. Clin Med. 2006;6:263–266. doi: 10.7861/clinmedicine.6-3-263. [DOI] [PMC free article] [PubMed] [Google Scholar]
- 143.de Herder WW, Kwekkeboom DJ, Valkema R, et al. Neuroendocrine tumors and somatostatin: imaging techniques. J Endocrinol Invest. 2005;28:132–136. [PubMed] [Google Scholar]
- 144.De Ridder M, Van Esch G, Engels B, Verovski V, Storme G. Hypoxic tumor cell radiosensitization: role of the iNOS/NO pathway. Bull Cancer. 2008;95:282–291. doi: 10.1684/bdc.2008.0592. [DOI] [PubMed] [Google Scholar]
- 145.Kung MP, Zhuang ZP, Hou C, Kung HF. Development and evaluation of iodinated tracers targeting amyloid plaques for SPECT imaging. J Mol Neurosci. 2004;24:49–53. doi: 10.1385/JMN:24:1:049. [DOI] [PubMed] [Google Scholar]
- 146.Jansen FP, Vanderheyden JL. The future of SPECT in a time of PET. Nucl Med Biol. 2007;34:733–735. doi: 10.1016/j.nucmedbio.2007.06.013. [DOI] [PubMed] [Google Scholar]
- 147.Rahmim A, Zaidi H. PET versus SPECT: strengths, limitations and challenges. Nucl Med Commun. 2008;29:193–207. doi: 10.1097/MNM.0b013e3282f3a515. [DOI] [PubMed] [Google Scholar]
- 148.Riemann B, Schafers KP, Schober O, Schafers M. Small animal PET in preclinical studies: opportunities and challenges. Q J Nucl Med Mol Imaging. 2008;52:215–221. [PubMed] [Google Scholar]
- 149.Chatziioannou AF. Molecular imaging of small animals with dedicated PET tomographs. Eur J Nucl Med Mol Imaging. 2002;29:98–114. doi: 10.1007/s00259-001-0683-3. [DOI] [PubMed] [Google Scholar]
- 150.Yang Y, Rendig S, Siegel S, Newport DF, Cherry SR. Cardiac PET imaging in mice with simultaneous cardiac and respiratory gating. Phys Med Biol. 2005;50:2979–2989. doi: 10.1088/0031-9155/50/13/001. [DOI] [PubMed] [Google Scholar]
- 151.Reske SN, Kotzerke J. FDG-PET for clinical use. Results of the 3rd German Interdisciplinary Consensus Conference, “Onko-PET III”, 21 July and 19 September 2000. Eur J Nucl Med. 2001;28:1707–1723. doi: 10.1007/s002590100626. [DOI] [PubMed] [Google Scholar]
- 152.Jennewein M, Lewis MA, Zhao D, et al. Vascular imaging of solid tumors in rats with a radioactive arsenic-labeled antibody that binds exposed phosphatidylserine. Clin Cancer Res. 2008;14:1377–1385. doi: 10.1158/1078-0432.CCR-07-1516. [DOI] [PMC free article] [PubMed] [Google Scholar]
- 153.Acton PD, Kung HF. Small animal imaging with high resolution single photon emission tomography. Nucl Med Biol. 2003;30:889–895. doi: 10.1016/s0969-8051(03)00112-4. [DOI] [PubMed] [Google Scholar]
- 154.Franc BL, Acton PD, Mari C, Hasegawa BH. Small-animal SPECT and SPECT/CT: important tools for preclinical investigation. J Nucl Med. 2008;49:1651–1663. doi: 10.2967/jnumed.108.055442. [DOI] [PubMed] [Google Scholar]
- 155.Schillaci O, Danieli R, Padovano F, Testa A, Simonetti G. Molecular imaging of atheroslerotic plaque with nuclear medicine techniques. Int J Mol Med. 2008;22:3–7. [PubMed] [Google Scholar]
- 156.Mathis CA, Wang Y, Klunk WE. Imaging beta-amyloid plaques and neurofibrillary tangles in the aging human brain. Curr Pharm Des. 2004;10:1469–1492. doi: 10.2174/1381612043384772. [DOI] [PubMed] [Google Scholar]
- 157.Acton PD, Zhou R. Imaging reporter genes for cell tracking with PET and SPECT. Q J Nucl Med Mol Imaging. 2005;49:349–360. [PubMed] [Google Scholar]
- 158.Van Waarde A, Elsinga PH. Proliferation markers for the differential diagnosis of tumor and inflammation. Curr Pharm Des. 2008;14:3326–3339. doi: 10.2174/138161208786549399. [DOI] [PubMed] [Google Scholar]
- 159.Belkacemi Y, Tsoutsou P, Magne N, Castadot P, Azria D. Metabolic functional imaging for tumor radiosensitivity monitoring. Crit Rev Oncol Hematol. 2007;62:227–239. doi: 10.1016/j.critrevonc.2006.12.002. [DOI] [PubMed] [Google Scholar]
- 160.Ametamey SM, Honer M. Pharmacological prerequisites for PET ligands and practical issues in preclinical PET research. Ernst Schering Res Found Workshop. 2007:317–327. doi: 10.1007/978-3-540-49527-7_12. [DOI] [PubMed] [Google Scholar]
- 161.Smith J, Finnoff JT. Diagnostic and interventional musculoskeletal ultrasound: part 1. Fundamentals PM R. 2009;1:64–75. doi: 10.1016/j.pmrj.2008.09.001. [DOI] [PubMed] [Google Scholar]
- 162.Case TD. Ultrasound physics and instrumentation. Surg Clin North Am. 1998;78:197–217. doi: 10.1016/s0039-6109(05)70309-1. [DOI] [PubMed] [Google Scholar]
- 163.Rallan D, Harland CC. Ultrasound in dermatology—basic principles and applications. Clin Exp Dermatol. 2003;28:632–638. doi: 10.1046/j.1365-2230.2003.01405.x. [DOI] [PubMed] [Google Scholar]
- 164.Coatney RW. Ultrasound imaging: principles and applications in rodent research. Ilar J. 2001;42:233–247. doi: 10.1093/ilar.42.3.233. [DOI] [PubMed] [Google Scholar]
- 165.Lawrence JP. Physics and instrumentation of ultrasound. Crit Care Med. 2007;35:S314–S322. doi: 10.1097/01.CCM.0000270241.33075.60. [DOI] [PubMed] [Google Scholar]
- 166.Dubinsky TJ, Cuevas C, Dighe MK, Kolokythas O, Hwang JH. High-intensity focused ultrasound: current potential and oncologic applications. Am J Roentgenol. 2008;190:191–199. doi: 10.2214/AJR.07.2671. [DOI] [PubMed] [Google Scholar]
- 167.Haar GT, Coussios C. High intensity focused ultrasound: physical principles and devices. Int J Hyperthermia. 2007;23:89–104. doi: 10.1080/02656730601186138. [DOI] [PubMed] [Google Scholar]
- 168.Frinking PJ, Bouakaz A, Kirkhorn J, Ten Cate FJ, de Jong N. Ultrasound contrast imaging: current and new potential methods. Ultrasound Med Biol. 2000;26:965–975. doi: 10.1016/s0301-5629(00)00229-5. [DOI] [PubMed] [Google Scholar]
- 169.Qin S, Caskey CF, Ferrara KW. Ultrasound contrast microbubbles in imaging and therapy: physical principles and engineering. Phys Med Biol. 2009;54:R27–R57. doi: 10.1088/0031-9155/54/6/R01. [DOI] [PMC free article] [PubMed] [Google Scholar]
- 170.Quaia E. Microbubble ultrasound contrast agents: an update. Eur Radiol. 2007;17:1995–2008. doi: 10.1007/s00330-007-0623-0. [DOI] [PubMed] [Google Scholar]
- 171.Villanueva FS. Molecular imaging of cardiovascular disease using ultrasound. J Nucl Cardiol. 2008;15:576–586. doi: 10.1016/j.nuclcard.2008.05.005. [DOI] [PMC free article] [PubMed] [Google Scholar]
- 172.Piedra M, Allroggen A, Lindner JR. Molecular imaging with targeted contrast ultrasound. Cerebrovasc Dis. 2009;27(suppl 2):66–74. doi: 10.1159/000203128. [DOI] [PMC free article] [PubMed] [Google Scholar]
- 173.Schneider M. Molecular imaging and ultrasound-assisted drug delivery. J Endourol. 2008;22:795–802. doi: 10.1089/end.2007.9821. [DOI] [PubMed] [Google Scholar]
- 174.Klegerman ME, Zou Y, McPherson DD. Fibrin targeting of echogenic liposomes with inactivated tissue plasminogen activator. J Liposome Res. 2008;18:95–112. doi: 10.1080/08982100802118482. [DOI] [PubMed] [Google Scholar]
- 175.Martin M, Chung E, Goodall A, et al. Enhanced detection of thromboemboli with the use of targeted microbubbles. Stroke. 2007;38:2726–2732. doi: 10.1161/STROKEAHA.107.489435. [DOI] [PubMed] [Google Scholar]
- 176.Borden MA, Zhang H, Gillies RJ, Dayton PA, Ferrara KW. A stimulus-responsive contrast agent for ultrasound molecular imaging. Biomaterials. 2008;29:597–606. doi: 10.1016/j.biomaterials.2007.10.011. [DOI] [PMC free article] [PubMed] [Google Scholar]
- 177.Wang B, Siahaan T, Soltero R. Drug Delivery: Principles and Applications. New York: Wiley; 2005. [Google Scholar]
- 178.Sboros V. Response of contrast agents to ultrasound. Adv Drug Deliv Rev. 2008;60:1117–1136. doi: 10.1016/j.addr.2008.03.011. [DOI] [PubMed] [Google Scholar]
- 179.Tinkov S, Bekeredjian R, Winter G, Coester C. Microbubbles as ultrasound triggered drug carriers. J Pharm Sci. 2009;98:1935–1961. doi: 10.1002/jps.21571. [DOI] [PubMed] [Google Scholar]
- 180.Mehier-Humbert S, Bettinger T, Yan F, Guy RH. Plasma membrane poration induced by ultrasound exposure: implication for drug delivery. J Control Release. 2005;104:213–222. doi: 10.1016/j.jconrel.2005.01.007. [DOI] [PubMed] [Google Scholar]
- 181.Alexandrov AV. Ultrasound enhanced thrombolysis for stroke. Int J Stroke. 2006;1:26–29. doi: 10.1111/j.1747-4949.2005.00012.x. [DOI] [PubMed] [Google Scholar]
- 182.Rychak JJ, Graba J, Cheung AM, et al. Microultrasound molecular imaging of vascular endothelial growth factor receptor 2 in a mouse model of tumor angiogenesis. Mol Imaging. 2007;6:289–296. [PubMed] [Google Scholar]
- 183.Korpanty G, Carbon JG, Grayburn PA, Fleming JB, Brekken RA. Monitoring response to anticancer therapy by targeting microbubbles to tumor vasculature. Clin Cancer Res. 2007;13:323–330. doi: 10.1158/1078-0432.CCR-06-1313. [DOI] [PubMed] [Google Scholar]
- 184.Willmann JK, Lutz AM, Paulmurugan R, et al. Dual-targeted contrast agent for US assessment of tumor angiogenesis in vivo. Radiology. 2008;248:936–944. doi: 10.1148/radiol.2483072231. [DOI] [PMC free article] [PubMed] [Google Scholar]
- 185.Sullivan JC, Wang B, Boesen EI, D’Angelo G, Pollock JS, Pollock DM. Novel use of ultrasound to examine regional blood flow in the mouse kidney. Am J Physiol Renal Physiol. 2009;297:F228–F235. doi: 10.1152/ajprenal.00016.2009. [DOI] [PMC free article] [PubMed] [Google Scholar]
- 186.Dromi S, Frenkel V, Luk A, et al. Pulsed-high intensity focused ultrasound and low temperature-sensitive liposomes for enhanced targeted drug delivery and antitumor effect. Clin Cancer Res. 2007;13:2722–2727. doi: 10.1158/1078-0432.CCR-06-2443. [DOI] [PMC free article] [PubMed] [Google Scholar]
- 187.O’Neill BE, Vo H, Angstadt M, Li KP, Quinn T, Frenkel V. Pulsed high intensity focused ultrasound mediated nanoparticle delivery: mechanisms and efficacy in murine muscle. Ultrasound Med Biol. 2009;35:416–424. doi: 10.1016/j.ultrasmedbio.2008.09.021. [DOI] [PMC free article] [PubMed] [Google Scholar]
- 188.Hancock HA, Smith LH, Cuesta J, et al. Investigations into pulsed high-intensity focused ultrasound-enhanced delivery: preliminary evidence for a novel mechanism. Ultrasound Med Biol. 2009 doi: 10.1016/j.ultrasmedbio.2009.04.020. Epub ahead of print. [DOI] [PMC free article] [PubMed] [Google Scholar]
- 189.Vykhodtseva N, McDannold N, Hynynen K. Progress and problems in the application of focused ultrasound for blood-brain barrier disruption. Ultrasonics. 2008;48:279–296. doi: 10.1016/j.ultras.2008.04.004. [DOI] [PMC free article] [PubMed] [Google Scholar]
- 190.Raymond SB, Treat LH, Dewey JD, McDannold NJ, Hynynen K, et al. Ultrasound enhanced delivery of molecular imaging and therapeutic agents in Alzheimer’s disease mouse models. PLoS ONE. 2008;3:e2175. doi: 10.1371/journal.pone.0002175. [DOI] [PMC free article] [PubMed] [Google Scholar]
- 191.Sheikov N, McDannold N, Sharma S, Hynynen K. Effect of focused ultrasound applied with an ultrasound contrast agent on the tight junctional integrity of the brain microvascular endothelium. Ultrasound Med Biol. 2008;34:1093–1104. doi: 10.1016/j.ultrasmedbio.2007.12.015. [DOI] [PMC free article] [PubMed] [Google Scholar]
- 192.Zhi H, Xiao XY, Yang HY, et al. Semi-quantitating stiffness of breast solid lesions in ultrasonic elastography. Acad Radiol. 2008;15:1347–1353. doi: 10.1016/j.acra.2008.08.003. [DOI] [PubMed] [Google Scholar]
- 193.Maurice RL, Fromageau J, Cardinal MH, et al. Characterization of atherosclerotic plaques and mural thrombi with intravascular ultrasound elastography: a potential method evaluated in an aortic rabbit model and a human coronary artery. IEEE Trans Inf Technol Biomed. 2008;12:290–298. doi: 10.1109/titb.2008.917905. [DOI] [PubMed] [Google Scholar]
- 194.Van Herck J, De Meyer G, Ennekens G, Van Herck P, Herman A, et al. Validation of in vivo plaque characterisation by virtual histology in a rabbit model of atherosclerosis. EuroIntervention. 2009;5:149–156. doi: 10.4244/eijv5i1a23. [DOI] [PubMed] [Google Scholar]
- 195.Schulz RB, Semmler W. Fundamentals of optical imaging. Handb Exp Pharmacol. 2008:3–22. doi: 10.1007/978-3-540-72718-7_1. [DOI] [PubMed] [Google Scholar]
- 196.Zinn KR, Chaudhuri TR, Szafran AA, et al. Noninvasive bioluminescence imaging in small animals. Ilar J. 2008;49:103–115. doi: 10.1093/ilar.49.1.103. [DOI] [PMC free article] [PubMed] [Google Scholar]
- 197.Testoni PA. Optical coherence tomography. Scientific-World Journal. 2007;7:87–108. doi: 10.1100/tsw.2007.29. [DOI] [PMC free article] [PubMed] [Google Scholar]
- 198.de Wet JR, Wood KV, Helinski DR, DeLuca M. Cloning of firefly luciferase cDNA and the expression of active luciferase in Escherichia coli. Proc Natl Acad Sci U S A. 1985;82:7870–7873. doi: 10.1073/pnas.82.23.7870. [DOI] [PMC free article] [PubMed] [Google Scholar]
- 199.Luker GD, Luker KE. Optical imaging: current applications and future directions. J Nucl Med. 2008;49:1–4. doi: 10.2967/jnumed.107.045799. [DOI] [PubMed] [Google Scholar]
- 200.Paroo Z, Bollinger RA, Braasch DA, et al. Validating bioluminescence imaging as a high-throughput, quantitative modality for assessing tumor burden. Mol Imaging. 2004;3:117–124. doi: 10.1162/15353500200403172. [DOI] [PubMed] [Google Scholar]
- 201.Lorenz WW, McCann RO, Longiaru M, Cormier MJ. Isolation and expression of a cDNA encoding Renilla reniformis luciferase. Proc Natl Acad Sci U S A. 1991;88:4438–4442. doi: 10.1073/pnas.88.10.4438. [DOI] [PMC free article] [PubMed] [Google Scholar]
- 202.Venisnik KM, Olafsen T, Gambhir SS, Wu AM. Fusion of Gaussia luciferase to an engineered anti-carcinoembryonic antigen (CEA) antibody for in vivo optical imaging. Mol Imaging Biol. 2007;9:267–277. doi: 10.1007/s11307-007-0101-8. [DOI] [PubMed] [Google Scholar]
- 203.Tannous BA, Kim DE, Fernandez JL, Weissleder R, Breakefield XO. Codon-optimized Gaussia luciferase cDNA for mammalian gene expression in culture and in vivo. Mol Ther. 2005;11:435–443. doi: 10.1016/j.ymthe.2004.10.016. [DOI] [PubMed] [Google Scholar]
- 204.Kalchenko V, Shivtiel S, Malina V, et al. Use of lipophilic near-infrared dye in whole-body optical imaging of hematopoietic cell homing. J Biomed Opt. 2006;11:050507. doi: 10.1117/1.2364903. [DOI] [PubMed] [Google Scholar]
- 205.Contag CH, Jenkins D, Contag PR, Negrin RS. Use of reporter genes for optical measurements of neoplastic disease in vivo. Neoplasia. 2000;2:41–52. doi: 10.1038/sj.neo.7900079. [DOI] [PMC free article] [PubMed] [Google Scholar]
- 206.Shcherbo D, Merzlyak EM, Chepurnykh TV, et al. Bright far-red fluorescent protein for whole-body imaging. Nat Methods. 2007;4:741–746. doi: 10.1038/nmeth1083. [DOI] [PubMed] [Google Scholar]
- 207.Choi HS, Ipe BI, Misra P, Lee JH, Bawendi MG, et al. Tissue- and organ-selective biodistribution of NIR fluorescent quantum dots. Nano Lett. 2009;9:2354–2359. doi: 10.1021/nl900872r. [DOI] [PMC free article] [PubMed] [Google Scholar]
- 208.Morimoto S. In-vivo imaging of tumors with protease activated near-infrared fluorescent probes. Tanpakushitsu Kakusan Koso. 2007;52:1774–1775. [PubMed] [Google Scholar]
- 209.Alencar H, Funovics MA, Figueiredo J, Sawaya H, Weissleder R, et al. Colonic adenocarcinomas: near-infrared microcatheter imaging of smart probes for early detection–study in mice. Radiology. 2007;244:232–238. doi: 10.1148/radiol.2441052114. [DOI] [PubMed] [Google Scholar]
- 210.Shaner NC, Steinbach PA, Tsien RY. A guide to choosing fluorescent proteins. Nat Methods. 2005;2:905–909. doi: 10.1038/nmeth819. [DOI] [PubMed] [Google Scholar]
- 211.Klohs J, Wunder A, Licha K. Near-infrared fluorescent probes for imaging vascular pathophysiology. Basic Res Cardiol. 2008;103:144–151. doi: 10.1007/s00395-008-0702-7. [DOI] [PubMed] [Google Scholar]
- 212.Southward CM, Surette MG. The dynamic microbe: green fluorescent protein brings bacteria to light. Mol Microbiol. 2002;45:1191–1196. doi: 10.1046/j.1365-2958.2002.03089.x. [DOI] [PubMed] [Google Scholar]
- 213.Chudakov DM, Lukyanov S, Lukyanov KA. Fluorescent proteins as a toolkit for in vivo imaging. Trends Biotechnol. 2005;23:605–613. doi: 10.1016/j.tibtech.2005.10.005. [DOI] [PubMed] [Google Scholar]
- 214.Hadjantonakis AK, Nagy A. The color of mice: in the light of GFP-variant reporters. Histochem Cell Biol. 2001;115:49–58. doi: 10.1007/s004180000233. [DOI] [PubMed] [Google Scholar]
- 215.Muller-Taubenberger A, Anderson KI. Recent advances using green and red fluorescent protein variants. Appl Microbiol Biotechnol. 2007;77:1–12. doi: 10.1007/s00253-007-1131-5. [DOI] [PubMed] [Google Scholar]
- 216.Yang C. Molecular contrast optical coherence tomography: a review. Photochem Photobiol. 2005;81:215–237. doi: 10.1562/2004-08-06-IR-266. [DOI] [PMC free article] [PubMed] [Google Scholar]
- 217.Luker KE, Smith MC, Luker GD, Gammon ST, Piwnica-Worms H, et al. Kinetics of regulated protein-protein interactions revealed with firefly luciferase complementation imaging in cells and living animals. Proc Natl Acad Sci U S A. 2004;101:12288–12293. doi: 10.1073/pnas.0404041101. [DOI] [PMC free article] [PubMed] [Google Scholar]
- 218.Paulmurugan R, Gambhir SS. Novel fusion protein approach for efficient high-throughput screening of small molecule-mediating protein-protein interactions in cells and living animals. Cancer Res. 2005;65:7413–7420. doi: 10.1158/0008-5472.CAN-05-0588. [DOI] [PMC free article] [PubMed] [Google Scholar]
- 219.Paulmurugan R, Gambhir SS. An intramolecular folding sensor for imaging estrogen receptor-ligand interactions. Proc Natl Acad Sci U S A. 2006;103:15883–15888. doi: 10.1073/pnas.0607385103. [DOI] [PMC free article] [PubMed] [Google Scholar]
- 220.Zhang L, Lee KC, Bhojani MS, et al. Molecular imaging of Akt kinase activity. Nat Med. 2007;13:1114–1119. doi: 10.1038/nm1608. [DOI] [PubMed] [Google Scholar]
- 221.Luker GD, Pica CM, Song J, Luker KE, Piwnica-Worms D. Imaging 26S proteasome activity and inhibition in living mice. Nat Med. 2003;9:969–973. doi: 10.1038/nm894. [DOI] [PubMed] [Google Scholar]
- 222.Safran M, Kim WY, O’Connell F, et al. Mouse model for noninvasive imaging of HIF prolyl hydroxylase activity: assessment of an oral agent that stimulates erythropoietin production. Proc Natl Acad Sci U S A. 2006;103:105–110. doi: 10.1073/pnas.0509459103. [DOI] [PMC free article] [PubMed] [Google Scholar]
- 223.Wilsbacher LD, Yamazaki S, Herzog ED, et al. Photic and circadian expression of luciferase in mPeriod1-luc transgenic mice in vivo. Proc Natl Acad Sci U S A. 2002;99:489–494. doi: 10.1073/pnas.012248599. [DOI] [PMC free article] [PubMed] [Google Scholar]
- 224.Sadikot RT, Blackwell TS. Bioluminescence: imaging modality for in vitro and in vivo gene expression. Methods Mol Biol. 2008;477:383–394. doi: 10.1007/978-1-60327-517-0_29. [DOI] [PubMed] [Google Scholar]
- 225.Santos EB, Yeh R, Lee J, et al. Sensitive in vivo imaging of T cells using a membrane-bound Gaussia princeps luciferase. Nat Med. 2009;15:338–344. doi: 10.1038/nm.1930. [DOI] [PMC free article] [PubMed] [Google Scholar]
- 226.Zhao D, Richer E, Antich PP, Mason RP. Antivascular effects of combretastatin A4 phosphate in breast cancer xenograft assessed using dynamic bioluminescence imaging and confirmed by MRI. FASEB J. 2008;22:2445–2451. doi: 10.1096/fj.07-103713. [DOI] [PMC free article] [PubMed] [Google Scholar]
- 227.Funovics M, Weissleder R, Tung CH. Protease sensors for bioimaging. Anal Bioanal Chem. 2003;377:956–963. doi: 10.1007/s00216-003-2199-0. [DOI] [PubMed] [Google Scholar]
- 228.Grimm J, Kirsch DG, Windsor SD, et al. Use of gene expression profiling to direct in vivo molecular imaging of lung cancer. Proc Natl Acad Sci U S A. 2005;102:14404–14409. doi: 10.1073/pnas.0503920102. [DOI] [PMC free article] [PubMed] [Google Scholar]
- 229.Hama Y, Urano Y, Koyama Y, Choyke PL, Kobayashi H. Activatable fluorescent molecular imaging of peritoneal metastases following pretargeting with a biotinylated monoclonal antibody. Cancer Res. 2007;67:3809–3817. doi: 10.1158/0008-5472.CAN-06-3794. [DOI] [PubMed] [Google Scholar]
- 230.Veiseh M, Gabikian P, Bahrami SB, et al. Tumor paint: a chlorotoxin:Cy5. 5 bioconjugate for intraoperative visualization of cancer foci. Cancer Res. 2007;67:6882–6888. doi: 10.1158/0008-5472.CAN-06-3948. [DOI] [PubMed] [Google Scholar]
- 231.Hoffman RM. The multiple uses of fluorescent proteins to visualize cancer in vivo. Nat Rev Cancer. 2005;5:796–806. doi: 10.1038/nrc1717. [DOI] [PubMed] [Google Scholar]
- 232.Jain RK, Munn LL, Fukumura D. Dissecting tumour pathophysiology using intravital microscopy. Nat Rev Cancer. 2002;2:266–276. doi: 10.1038/nrc778. [DOI] [PubMed] [Google Scholar]
- 233.Brown EB, Campbell RB, Tsuzuki Y, et al. In vivo measurement of gene expression, angiogenesis and physiological function in tumors using multiphoton laser scanning microscopy. Nat Med. 2001;7:864–868. doi: 10.1038/89997. [DOI] [PubMed] [Google Scholar]
- 234.Boddington S, Henning TD, Sutton EJ, Daldrup-Link HE. Labeling stem cells with fluorescent dyes for non-invasive detection with optical imaging. J Vis Exp. 2008;14:3791/686. doi: 10.3791/686. [DOI] [PMC free article] [PubMed] [Google Scholar]
- 235.Fujimoto JG. Optical coherence tomography for ultra-high resolution in vivo imaging. Nat Biotechnol. 2003;21:1361–1367. doi: 10.1038/nbt892. [DOI] [PubMed] [Google Scholar]
- 236.Sacchetti A, Ciccocioppo R, Alberti S. The molecular determinants of the efficiency of green fluorescent protein mutants. Histol Histopathol. 2000;15:101–107. doi: 10.14670/HH-15.101. [DOI] [PubMed] [Google Scholar]
- 237.Maddalo SL, Zimmer M. The role of the protein matrix in green fluorescent protein fluorescence. Photochem Photobiol. 2006;82:367–372. doi: 10.1562/2005-04-11-RA-485. [DOI] [PubMed] [Google Scholar]
- 238.Weissleder R, Ntziachristos V. Shedding light onto live molecular targets. Nat Med. 2003;9:123–128. doi: 10.1038/nm0103-123. [DOI] [PubMed] [Google Scholar]
- 239.Levenson RM, Lynch DT, Kobayashi H, Backer JM, Backer MV. Multiplexing with multispectral imaging: from mice to microscopy. Ilar J. 2008;49:78–88. doi: 10.1093/ilar.49.1.78. [DOI] [PubMed] [Google Scholar]
- 240.Roncali E, Savinaud M, Levrey O, Rogers KL, Maitrejean S, et al. New device for real-time bioluminescence imaging in moving rodents. J Biomed Opt. 2008;13:054035. doi: 10.1117/1.2976426. [DOI] [PubMed] [Google Scholar]
- 241.Hillman EM, Moore A. All-optical anatomical co-registration for molecular imaging of small animals using dynamic contrast. Nat Photonics. 2007;1:526–530. doi: 10.1038/nphoton.2007.146. [DOI] [PMC free article] [PubMed] [Google Scholar]
- 242.Zanzonico PB, Nehmeh SA. Introduction to clinical and laboratory (small-animal) image registration and fusion. Conf Proc IEEE Eng Med Biol Soc. 2006;1:1580–1583. doi: 10.1109/IEMBS.2006.259649. [DOI] [PubMed] [Google Scholar]
- 243.Townsend DW. Dual-modality imaging: combining anatomy and function. J Nucl Med. 2008;49:938–955. doi: 10.2967/jnumed.108.051276. [DOI] [PubMed] [Google Scholar]
- 244.Liang H, Yang Y, Yang K, Wu Y, Boone JM, et al. A microPET/CT system for in vivo small animal imaging. Phys Med Biol. 2007;52:3881–3894. doi: 10.1088/0031-9155/52/13/015. [DOI] [PubMed] [Google Scholar]
- 245.Gainkam LO, Huang L, Caveliers V, et al. Comparison of the biodistribution and tumor targeting of two 99mTc-labeled anti-EGFR nanobodies in mice, using pinhole SPECT/micro-CT. J Nucl Med. 2008;49:788–795. doi: 10.2967/jnumed.107.048538. [DOI] [PubMed] [Google Scholar]
- 246.Raty JK, Liimatainen T, Huhtala T, et al. SPECT/CT imaging of baculovirus biodistribution in rat. Gene Ther. 2007;14:930–938. doi: 10.1038/sj.gt.3302934. [DOI] [PubMed] [Google Scholar]
- 247.Wietholt C, Roerig DL, Gordon JB, Haworth ST, Molthen RC, et al. Bronchial circulation angiogenesis in the rat quantified with SPECT and micro-CT. Eur J Nucl Med Mol Imaging. 2008;35:1124–1132. doi: 10.1007/s00259-007-0684-y. [DOI] [PMC free article] [PubMed] [Google Scholar]
- 248.Seemann MD, Beck R, Ziegler S. In vivo tumor imaging in mice using a state-of-the-art clinical PET/CT in comparison with a small animal PET and a small animal CT. Technol Cancer Res Treat. 2006;5:537–542. doi: 10.1177/153303460600500511. [DOI] [PubMed] [Google Scholar]
- 249.Allard M, Cote D, Davidson L, Dazai J, Henkelman RM. Combined magnetic resonance and bioluminescence imaging of live mice. J Biomed Opt. 2007;12:034018. doi: 10.1117/1.2745298. [DOI] [PubMed] [Google Scholar]
- 250.Judenhofer MS, Wehrl HF, Newport DF, et al. Simultaneous PET-MRI: a new approach for functional and morphological imaging. Nat Med. 2008;14:459–465. doi: 10.1038/nm1700. [DOI] [PubMed] [Google Scholar]
- 251.Goetz C, Breton E, Choquet P, Israel-Jost V, et al. SPECT low-field MRI system for small-animal imaging. J Nucl Med. 2008;49:88–93. doi: 10.2967/jnumed.107.044313. [DOI] [PubMed] [Google Scholar]
- 252.Alexandrakis G, Rannou FR, Chatziioannou AF. Effect of optical property estimation accuracy on tomographic bioluminescence imaging: simulation of a combined optical-PET (OPET) system. Phys Med Biol. 2006;51:2045–2053. doi: 10.1088/0031-9155/51/8/006. [DOI] [PMC free article] [PubMed] [Google Scholar]
- 253.Wehrl HF, Judenhofer MS, Wiehr S, Pichler BJ. Preclinical PET/MR: technological advances and new perspectives in biomedical research. Eur J Nucl Med Mol Imaging. 2009;36(suppl 1):S56–S68. doi: 10.1007/s00259-009-1078-0. [DOI] [PubMed] [Google Scholar]
- 254.Lee S, Chen X. Dual-modality probes for in vivo molecular imaging. Mol Imaging. 2009;8:87–100. [PubMed] [Google Scholar]
- 255.Jennings LE, Long NJ. Two is better than one’—probes for dual-modality molecular imaging. Chem Commun (Camb) 2009:3511–3524. doi: 10.1039/b821903f. [DOI] [PubMed] [Google Scholar]
- 256.Daldrup-Link HE, Rudelius M, Metz S, et al. Cell tracking with gadophrin-2: a bifunctional contrast agent for MR imaging, optical imaging, and fluorescence microscopy. Eur J Nucl Med Mol Imaging. 2004;31:1312–1321. doi: 10.1007/s00259-004-1484-2. [DOI] [PubMed] [Google Scholar]
- 257.Ponomarev V, Doubrovin M, Serganova I, et al. A novel triple-modality reporter gene for whole-body fluorescent, bioluminescent, and nuclear noninvasive imaging. Eur J Nucl Med Mol Imaging. 2004;31:740–751. doi: 10.1007/s00259-003-1441-5. [DOI] [PubMed] [Google Scholar]
- 258.Cheon J, Lee JH. Synergistically integrated nanoparticles as multimodal probes for nanobiotechnology. Acc Chem Res. 2008;41:1630–1640. doi: 10.1021/ar800045c. [DOI] [PubMed] [Google Scholar]
- 259.Goertzen AL, Meadors AK, Silverman RW, Cherry SR. Simultaneous molecular and anatomic imaging of the mouse in vivo. Phys Med Biol. 2002;47:4315–4328. doi: 10.1088/0031-9155/47/24/301. [DOI] [PubMed] [Google Scholar]