

Abstract
In an fMRI study we tried to establish whether the areas in the human brain that are involved in the understanding of actions are homologous with the inferior parietal cortex (area PFG) in macaque monkeys. Cells have been described in area PFG that discharge differentially depending upon whether the observer sees food being brought to the mouth or a small object being put in a container. In our study the observers saw videos in which the use of different objects was demonstrated in pantomime; and after viewing the videos, the subject had to pick the object that was appropriate to the pantomime. We found a cluster of activated voxels in parietal areas PFop and PFt and this cluster was greater in the left hemisphere than in the right. We suggest a mechanism that could account for this asymmetry, relate our results to handedness and suggest that they shed light on the human syndrome of apraxia. Finally, we suggest that during the evolution of the hominids, this same pantomime mechanism could have been used to ‘name’ or request objects.
INTRODUCTION
Two keys to understanding the inferior parietal cortex of primates come from anatomical and physiological studies of macaque monkeys. The first is that the area provides the sensory information that is necessary for reaching for food, grasping it and then bringing it to the mouth. The second is that it provides the sensory information that is necessary for one animal to benefit from seeing another animal doing so.
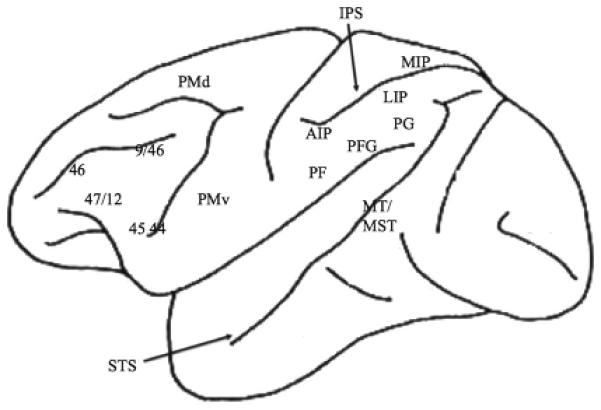
In the macaque monkeys there are three divisions of the inferior parietal cortex, PF, PFG and PG (Pandya and Seltzer, 1982). Area PG is interconnected with MIP; this lies in the superior parietal cortex, in the upper bank of the intraparietal sulcus (IPS). Area PFG is interconnected with area AIP; this lies anteriorly in the IPS (Rozzi et al., 2006). The function of these areas can be illustrated by describing three phases in feeding.
The first involves reaching towards the food, before contact has been made. Lesions of that include PG and LIP in the intraparietal sulcus lead to severe misreaching for pieces of food as visual targets (Rushworth et al., 1997a). However, the guidance of the limb also requires proprioceptive signals, and area MIP receives a proprioceptive input to the shoulder (Prevosto et al., 2009). Superior parietal lesions that include MIP impair the proprioceptive guidance of the hand; this can be tested by requiring that the movements be made in the dark (Rushworth et al., 1997c).
The second phase involves the period just before contact is made with the food. Visual information about the size and shape of the object is needed to shape the hand before contact. This 3-D information is transmitted from the caudal part of the IPS to AIP (Sakata et al., 1997). Inactivation of AIP impairs the pre-shaping of the fingers before the food is felt (Fogassi et al., 2001).
The final phase involves moving the hand with the food in it. The natural course of action involves bringing the food to the mouth. Many cells in the inferior parietal area PF respond to stimulation of the mouth (Rozzi et al., 2008); and there are cells in the area PFG that respond to the combined stimulation of the hand and mouth (Yokochi et al., 2003).
However, it is important to note that many cells in PFG respond differentially depending on where the item is put. Bonini et al. (2011) trained monkeys to put food in their mouth but to put a small metal object in a container. Many cells in area PFG responded differentially depending on the goal. The word ‘goal’ is used here to mean the location, not the outcome. One role of the parietal cortex is to supply the sensory information to confirm that that goal has been reached. However, as we have documented elsewhere (Passingham and Wise, 2012), prefrontal mechanisms are needed to specify which goal it is currently worth aiming for.
Since monkeys live in groups, one monkey can observe another animal as it feeds. It pays to do so because information can be transmitted about the locations of the most valuable food items. Visual information about the movements of another animal reaches areas PFG and PG via an input from the motion area MST (Rozzi et al., 2006). There is also a projection to PFG from the upper bank of the superior temporal sulcus (STS) (Nelissen et al., 2011), and there are cells in the sulcus that respond differentially depending on the direction in which an individual is seen to walk (Jellema and Perrett, 2003). As expected from these inputs, cells can be found in area PFG and PG that respond to biological motion (Rozzi et al., 2008). By contrast, area AIP does not receive a motion input from MST (Rozzi et al., 2006).
Around 50% of the cells in area PFG respond to visual stimulation (Rozzi et al., 2008). But, surprisingly, as many as 80% of the cells in area PFG are active during the movements of the animal itself. There could be two reasons for the latter finding. The first is that the cells could be responding to somatosensory signals arising from movement. The second is that they could be responding because they are reciprocally connected with the premotor areas, and thus reflect activity in those areas through back projections.
Roughly 10-15% of the cells in PFG are active both during movement and also during observation of similar movements (Rozzi et al., 2008). It has been suggested that these ‘mirror neurons’ may be crucial in understanding an action (Rizzolatti et al., 2001). They could acquire their property in the following way.
The sight of action, such as feeding, could ‘afford’ or lead to activity in the premotor areas with which PFG is interconnected. These include areas 44 and 45, termed Broca’s area in the human brain (Frey et al., 2013). Cells in PFG can then receive feedback via back projections from areas 44 and 45 to PFG. This feedback could, in principle, be used to represent the action as observed and the action as experienced by the animal when it makes a similar movement itself. If so, one might expect cells with conjunctive properties; and some of these could code for a ‘match’ in the same way as prefrontal cells can code for a visual match (Wallis et al., 2001)
One could argue that the ability to understand actions need not depend on such a mechanism, and that visual cues are enough. But there is evidence from experiments on human subjects that motor feedback might indeed be essential. In imaging experiments on action observation, the activation is greater if the observer is an expert in the action observed (Calvo-Merino et al., 2005). And it is familiarity with performing the movements, not simply with seeing them, that turns out to be the critical factor for the effect of expertise (Calvo-Merino et al., 2006).
One advantage of studying human rather than monkey observers is that it is easier to devise formal tests of action understanding for people. Whereas such tests would require many months of training for monkeys, human subjects can simply be instructed to do what is required. But if human subjects are to be studied, the question arises whether the areas that are involved in action understanding are the same as in monkeys.
That they might not be is suggested by the syndrome of ideational apraxia in stroke patients. This results from lesions that are centred on the inferior parietal lobule and the lesions are in the hemisphere that is dominant for language (Kalenine et al., 2010). Ideomotor apraxia is assessed by requiring the patient to imitate gestures; ideational apraxia is assessed by requiring the patients to use pantomime to demonstrate the use of objects. Monkeys can neither imitate gestures nor demonstrate the use of objects in pantomime.
But it could be argued that the executive impairment in apraxia is simply due to the requirement that the movements be performed in mid-air. This means that they are under proprioceptive control. And monkeys with lesions that include MIP are impaired at producing coordinated movements under proprioceptive control (Rushworth et al., 1997b). So the impairment in apraxia as observed in humans could result from interference with the same mechanisms described in monkeys.
However, patients with apraxia are also impaired when tested in recognition (Rothi et al., 1985, Kalenine et al., 2010). Since the lesions are in the dominant hemisphere it could be argued that the impairment is bound up in some way with language. Wang and Goodglass (1992) found a relation between auditory comprehension and the ability to recognize pantomime. And in a follow up study Vaina et al. (1995) tested aphasic patients and showed that they were impaired at choosing the object that is appropriate for a pantomime observed in video form.
Studies of patients can only give an imprecise delineation of the critical areas, and thus it could be that the lesions encompass both areas that are involved in action understanding and areas that are involved in language. Accordingly, the current study was carried out using fMRI to visualize the areas for action understanding when healthy subjects perform the same tasks as the in studies of patients by Vaina et al. (1995). The same videos were therefore used. In the videos, actions were performed in pantomime, and two objects were then presented. The subject had to choose the one that best fitted the action in the previous pantomime.
Because objects were presented at the choice phase, a comparison condition was needed in which objects were also presented. It was also a requirement that there be no motion in this condition so that it could act as a static control. A final requirement was that this condition also tested the association between an action and an object. In this control condition, therefore, photos of objects were presented together with photos of two hands. The subjects had to choose between the hands, only one of which showed the appropriate hand-grip for that object. We accept that this condition is a compromise in that it did not show the body, but it was essential that the photos of hands be clear enough to allow the judgement to be made.
Since this study was completed, there have been imaging studies that have suggested that action understanding might depend on areas that are new to the human brain (Peeters et al., 2009, Peeters et al., 2013). We have therefore re-analysed the data in our study so as to see whether our results on the understanding of pantomime support this conclusion.
METHODS
Participants
Eight healthy volunteers were recruited from the student population of Boston University (mean age 23.2 years, range 20-25 years; 4 females) to take part in the fMRI study. They had no history of neurological or psychiatric problems. All were right handed (Oldfield, 1971) and had normal or corrected-to-normal vision. Prior to participating, all subjects gave written informed consent in accordance with the requirements of Boston University and Martinos Center for Biomedical Imaging Institutional Review Boards for Research on Human Subjects. Before the scanning sessions the nature, but not specific purpose, of the study was explained to them and they were briefly trained outside the scanner, with shortened versions of the experimental paradigms, so as to ensure that they understood and were able to carry out the tasks. In the scanner, the task order was counterbalanced so as to minimize habituation effects.
Pantomime task
In each trial, the stimulus sequence, shown for 4 sec, consisted of a 400 msec fixation mark, followed by a red exclamation mark (subtending 7.3° × 2.1°) shown for 300 msec to announce the beginning of the pantomime video and to prompt the subjects to pay attention. Each pantomime, shown for 500 msec and repeated twice, with a 300 msec interval, portrayed the silhouette of a person miming an action that could be performed on an object by using the right hand and arm. However, no object actually appeared in the videos.
The pantomime videos were followed by a 2-sec presentation of coloured pictures (each 8° × 12°) of two objects displayed side by side, one of which was the object whose use was mimed in the pantomime. The other object, the distractor, was related perceptually to the target, but its handling required actions with very different perceptual attributes. For example, if the pantomimed action was picking an apple from a tree, the target object was an apple, and a distractor a small pumpkin, which had the same size and shape as the apple and would be handled by the same hand shape, but the direction of the arm movement would not be up but down. The target object was presented at random on the right or the left of the pair. All pantomimed actions were presented as videos (subtending 14° × 20°) of black silhouettes displayed on a grey background. In the pantomime the features of the object used had to be inferred from the speed, direction of the arm movement and from the size or orientation of the handgrip. An example of the sequence is shown in Figure 1.
Figure 1.
An example of the displays used to present pantomimed actions. A grey display with a white fixation mark is shown first, followed by a red exclamation sign indicating that the subject should attend to the test-figures that follow. In a video, shown twice, the silhouetted figure is reaching up to pluck an object. The choices shown in photographs presented after the end of the pantomime are an apple or pumpkin. The correct choice is the apple.
The procedure was a 2-alternative forced-choice (2AFC). The subjects indicated their choice by pressing the right or left button on the magnet-compatible button box to indicate whether the object the use of which was pantomimed was shown on the left or right of the display. The subjects entered their response during the 2-sec interval for which the objects were displayed.
Table 1 presents a brief description of the pantomimes and gives the objects between which the subjects had to choose. It also provides an analysis of the types of movements that were involved. For more detailed descriptions, see Vaina et al. (1995).
TABLE 1.
Analysis of the actions shown in the videos
| Pantomime | Target | Foil | Pick up | Move | Skill |
|---|---|---|---|---|---|
| Crumpling | Paper | Ball | + | ||
| Dial wall phone | Wall phone | Upright piano | + | + | |
| Swing racquet | Tennis racket | Oar | + | ||
| Dropping | Large glass | Cherries | + | ||
| Catching | Tennis ball | Hand weights | + | ||
| Pushing forwards | Small cart | Window half-way up | + | ||
| Placing down | Book | Briefcase | + | ||
| Pulling | Drawer | Chair | + | ||
| Placing down delicately | Wineglass | Egg | + | + | |
| Screwing a light bulb | Light bulb | Petrol (gas) cap | + | + | |
| Plucking | Apple | Small pumpkin | + | + | + |
| Thrusting in fencing | Sword | Oar | + | ||
| Throwing | Key on ring | Feather | + | + | |
| Pushing sideways | Curtain | Tree | + | ||
| Picking up thin object | Pencil | Matchbox | + | + |
Key
Pick up = the objects are distinguished by how they are picked up
Move = the objects are distinguished by how they are moved
Skill = movements requiring skill, as in independent finger movements, delicacy or accuracy
Hand-grip task
A similar experimental paradigm was used as for the hand-grip task. Each trial, lasting 4 sec, consisted of a 400 msec fixation mark, followed by the exclamation sign for 300 msec, two 1650 msec repeats of a picture of a common object. The objects were a knife, wooden spoon, toothbrush, screwdriver, tennis ball, key, saw, hammer, tomato-juice can, comb and scissors.
Below the object, two hand-grips were shown side by side, one was the target, which portrayed photographically the grip normally used with the object. For example, one showed the normal way in which a hammer is held in the hand. The other portrayed a hand-grip that had an incorrect orientation, but showed the correct size and shaping of the fingers. The target was presented either on the right or the left at random, and subjects had to press the right or left button to indicate which of the two hand-grips was correct. An example is shown in Figure 2.
Figure 2.


An example from the hand-grip test. The trial starts with fixation only, followed by red exclamation mark indicating that the observer must attend the test-stimulus. The figure portrays an example of the test stimuli used. Shown here is a hand saw, and two hand grips. The correct hand-grip is the one shown at bottom left of the figure because it is the one that would be used to grasp the object (the saw) for using it in a typical action (sawing). The other, the distracter, has the same finger configurations as the correct hand posture, but the hand is rotated.
In what follows we call the principal experimental behaviour ‘the pantomime task’ and the control condition ‘the hand-grip task.
fMRI image acquisition
The data were acquired with a 1.5-T Magnetom ‘VISION’ (Siemens, Germany) whole-body MRI system equipped with a birdcage head-volume coil (gradient coil with 40 mT/m maximum gradient strength, a slew rate of 200 (T/m)/s and a 40 cm field of view (FOV). For fMRI, echo planar imaging (EPI) was used (repetition time TR = 2526 ms, echo time TE = 70 ms, flip angle 90°, field of view 200 mm). Twenty-two slices of axial orientation, parallel to a line drawn between the anterior and posterior commissures (AC-PC) were acquired to cover the whole brain. Image size was 64 × 64 pixels, slices thickness was 5 mm with a gap of 1 mm. The voxel size of the EPI images was 3.125 × 3.125 × 6 mm. For anatomical localization, we used 3D gradient echo T1-weighted images (TR = 11.1 ms, TE = 4.3 ms, flip angle 8°, FOV 256 mm). Anatomical image size was 256 × 256 × 128 pixels, slice thickness was 1.3281 mm, voxel size was 1 × 1 × 1.3281 mm.
The subjects wore ear-plugs and were supine during scanning, with dense foam pads around the ears to keep the head still. During each fMRI scan, the subjects performed the discrimination task by entering their responses on the keypad. No feedback about their performance was provided. The stimuli were rear-projected onto an acrylic screen (Daplex, bore mounted) providing a visual field of approximately 40° × 25° at the viewing distance, via a mirror, of 32 cm. Stimuli were projected onto the screen by a Sharp XG-2000U LCD projector with a resolution of 1024 × 768 pixels (pixel size = 0.2 × 0.2 mm) at a screen refresh rate of 75 Hz, through a collimating lens (Buhl Optical).
fMRI data analysis
The imaging data were preprocessed using Brain Voyager Version 4.9 (Brain Innovations, Inc., Maastricht, Netherlands). Functional data were corrected for slice scanning time differences using cubic spline interpolation, across-scan motion, and were convolved with a 3 mm FWHM Gaussian kernel for spatial smoothing, and temporal smoothing was achieved by both linear trend removal and high-pass filtering with cut-off value of 3 cycles in time course.
The cortical reconstruction and volumetric segmentation of the anatomical data were performed with the Freesurfer image analysis suite, which is documented and freely available for download online (http://surfer.nmr.mgh.harvard.edu/). The technical details of these procedures are described in by Dale et al. (1999) and Fischl et al. (1999). The 3-D reconstruction of the cortical surface, segmented at the grey-white matter boundary and then inflated, was used to display the activations. The 3-D reconstruction step resampled the subject's brain onto the MNI 305 brain. Functional volumes were then aligned to the transformed high resolution anatomical volumes, thus transforming the functional data into a common MNI 305 space across all subjects. All fMRI activations were displayed using one of the subject’s resampled MNI 305 brain.
A random effects analysis based on a General Linear Model was performed for both experimental tasks. The model generated beta weights by fitting the hemodynamic response (2-gamma) function to the time course of each voxel. Clusters of more than 5 contiguous voxels showing significant activation (FDR-threshold < z < 14) were selected as regions of interest and z-score maps for each of the conditions were created.
Beta weights associated with each observed region of interest (ROI) time course were recorded to assess the level of activation relative to baseline (fixation). MNI coordinates of the ROIs were recorded at the maximum voxel intensity value. In order to compute statistically significant contrasts between the pantomime and hand-grip conditions, we used Freesurfer and algorithms developed in-house in MATLAB. To correct for multiple comparisons, z-score maps thresholded at 3.0902 (p = 0.001) were chosen (Forman et al., 1995). Monte-Carlo simulations produced an empirical distribution of cluster sizes from random permutations of the chosen z-score map and assigns a p-value to each cluster-size (Poline and Mazoyer, 1993, Forman et al., 1995). A cluster-size threshold of 50 mm2 (p < 0.01) was obtained using this method. The z-score maps were initially converted from a volume space to a surface space in order to enable visualization on an inflated brain. Clustering was performed to find maps with significant areas of activation within the individual tasks. A binary map was then created after taking into account the significance threshold of a z-score and assigning a value of 1 when a particular voxel crossed the z-threshold, and 0 when it did not.
The contrast between the two conditions were performed by computing an addition between the binary maps of Pantomime and 2*Hand-action. This computation assigned a value of 1 to the pantomime activation, 2 to the hand-action activation, and 3 to the overlapping activation. Clustering was then performed on the resultant surface map in order to find significantly clusters of contrasted activation and to ensure that there were no spurious areas of activation with a high significance value.
Multi-subject statistical maps were corrected for multiple comparisons using the false-discovery rate (FDR) (q= 0.01) to find an appropriate significance threshold for each experimental task (Benjamini and Hochberg, 1995). The FDR corrected significance z-threshold for pantomime and hand-grip were found to be 3.2810 and 3.4014. respectively.
RESULTS
We have simplified our account of the results in that we have chosen to highlight the activations that we take to be most significant in interpreting the data. In doing so we have concentrated on activations on the lateral surface.
Pantomime versus hand-grip
Figure 3 shows the lateral views for the activations for the contrast of pantomime with hand-grip. It will be seen that the activations are widespread and that they are more extensive in the left hemisphere than in the right. Rather than listing all the activations, Table 1 gives the coordinates for those that we take to be most revealing. These are also labelled in Figure 3.
Figure 3.

The location of the activations for pantomime versus hand-grip are shown on lateral views of the left and right hemisphere.
Visual motion
The pantomime task involved observing actions, also known as biological motion. For the contrast of pantomime with hand-grip there were activations in three areas known to show activations during motion. These are the MT complex (MT+), including MST, the superior temporal sulcus (STS) and area V6 on the medial surface (not shown in Figure 3). The allocation of the activations in MT+ and V6 were made on the basis of the coordinates given by Pitzalis et al. (2013). There were also a series of peaks in the superior temporal sulcus.
Parietal cortex
For the same comparison there were activations in a cluster in inferior parietal cortex. To identify this region we have used the probability atlas of Caspers et al. (2006). We have also compared the peaks with the clusters identified by Mars et al. (2011) on the basis of their pattern of connections.
We identify the peak at −48 −26 29 as in being PFop. In the Caspers atlas the probability is 36%; in the Mars atlas it compares with 50 −26 30, which is given as the peak coordinate for PFop. We identify the peak at −56 −22 −36 as being in PFt. In the Caspers atlas the probability is 71%. It differs from the peak coordinate of 54 −32 44 given in the Mars atlas, but that lies within the IPS, whereas our peak clearly lies on the cortex of the inferior parietal convexity (Figure 3).
Frontal cortex
For pantomime versus hand-grip there was also an activation in the premotor cortex. We identify it as lying in Broca’s area 44. The peak coordinate on the left has a 48% probability of doing so in the probability atlas of Eickhoff et al. (2005). There was also a peak more anteriorly in area 45.
Finally, for the same contrast there were activations more anteriorly in the prefrontal cortex. There were peaks both in the inferior frontal sulcus (Petrides and Pandya, 2002) and on the inferior frontal gyrus. We take the latter to lie within area 47/12. Human area 47 is taken to be homologous with monkey area 12, hence the term (Petrides and Pandya, 2002). There was an additional activation in the left hemisphere, in the middle frontal gyrus, and this we take to be within area 46 (Sallet et al., 2013).
There were also activations on the medial surface in the pre-supplementary motor cortex and the rostral cingulate motor area (not shown in Figure 3).
Hand-grip versus pantomime
Figure 4 shows the lateral views for the activations for the contrast of the static hand-grip with pantomime. Table 4 gives the coordinates of selected activations, and these are also labelled in Figure 4.
Figure 4.
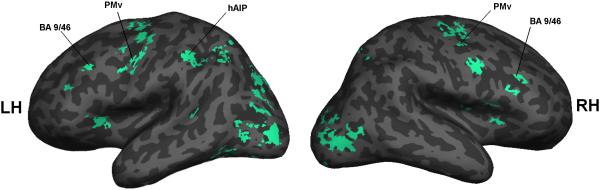
The location of the activations for hand-grip versus pantomime are shown on the lateral views of the left and right hemisphere.
TABLE 4.
Peak coordinates in common for pantomime and hand-grip
| Area | Coordinate | Cluster | Z | Coordinate | Cluster | Z |
|---|---|---|---|---|---|---|
| Parietal | ||||||
| PGa | −35 −62 +43 | 72 | 6.9 | |||
| Premotor | ||||||
| PMd | −24 −2 63 | 345 | 52.4 |
Key
PGa = area within the inferior parietal cortex
PMd = dorsal premotor cortex
Parietal cortex
There was an activation in the anterior intraparietal sulcus in the left hemisphere. We identified this as the human area AIP (hAIP) on the basis of the study of reaching and grasping by Cavina-Pratesi et al. (2010). It will be seen from Figure 4 that this lies clearly in the intraparietal sulcus, whereas the parietal peaks for Pantomime lie on the inferior convexity of the cortex.
Frontal cortex
For the contrast of Hand-grip with Pantomime there were also activations in the ventral limb of the precentral sulcus. On the basis of the study by Tomassini et al. (2007), these were identified as lying within area PMv.
Finally, there was an activation in the middle frontal gyrus at a level that appears to be in area 9/46 (Sallet et al., 2013).
Activations common to pantomime and hand-grip
We also calculated an overlap image (not shown). The most important findings are that there was no activation in hAIP for pantomime and no activation in PFt or PFop for hand-grip However, there were two positive findings of note, and these are shown in Table 4. There was activation in common in the left parietal area PGa (Mars et al., 2011) and in the left dorsal premotor cortex, PMd.
DISCUSSION
The central finding concerns the role of the posterior parietal cortex in understanding actions. When subjects viewed the pantomimes and chose the appropriate objects, there was activation on the anterior part of the inferior parietal convexity. The activated cluster was greater in the left than the right hemisphere. There was no activation in hAIP for this contrast. There could be two reasons. The first is that, though objects were presented at the choice phase, the BOLD signal was time-locked to the start of the videos. The second is that, as can be seen from Table 1, in most of the videos the objects would be identified by how they were moved, not by how they were grasped.
Homology
The issue of homology can be settled by seeing to what extent the areas under consideration support similar behaviours. In the study on monkeys by Bonini et al. (Bonini et al., 2010), described in the introduction, the actions differed depending on the object that was involved; the same was true in our study. In the study on monkeys the actions were picking up and moving an object; in our study most of the movements involved taking hold of the object and moving it.
Since the activations in this study and the differential activity in the studies of monkeys lay on the inferior parietal convexity, we conclude that the human area is homologous with area PFG of monkeys. However, this term refers to a common evolutionary origin: it does not preclude change in either lineage since that time. Indeed, we assume that the traits observed in modern monkeys more closely resemble those of the last common ancestor of monkeys and humans than do the homologous traits in humans.
Peeters et al. (2009, Peeters et al., 2013) have argued that there is a new area on the human inferior parietal convexity. The reason is that they found activation that appeared to be specific to observing tool use. They scanned human subjects while they observed the use of tools to pick up or move an object. In one study the peak was in PFt and in the other in PFop (Table 5). The activation was significantly greater when their subjects observed the use of tool rather than a hand to pick up or move an object.
TABLE 5.
Comparison of coordinates in this and other studies
| Task | Coordinate | Area | Reference |
|---|---|---|---|
| Parietal | |||
| Observe hand action | −56 −22 +36 | PFt | This study |
| −48 −26 +29 | PFop | This study | |
| Observe tool use | −60 −21 +31 | PFt | Peeters et al. (2009) |
| Observe tool use | −62 −18 +26 | PFop | Peeters et al. (2013) |
| Middle frontal gyrus | |||
| Choose hand with correct orientation | −39 +29 +28 | 9/46 | This study |
| Choose hand/tool with correct orientation | −55 +28 +35 | 9/46 | Bach et al. (2010) |
| Inferior frontal | |||
| Choice of object for action | −43 + 42 +5 | 47/12 | This study |
| New object/action association | −52 +40 −4 | 47/12 | Toni et al. (2001) |
We agree that the differentiation of PFG into PFt and PFop may have been driven by the invention of tools. In our videos 14/15 pantomime involved man-made objects. However, unlike the videos in the studies by Peeters et al., they did not show a tool being used to operate on an object.
It could be that the critical factor is that the actions involve skill (Table 1). Biagi et al. (2010) found greater activation in human subjects when they had to perform complex hand movements rather than a simple whole hand grasp. However, in this case the activation lay in the IPS, not in the inferior parietal convexity.
We therefore favour the alternative proposal that the critical factor is that the observer knows what actions are performed with a particular object, screwing in a lightbulb, pulling a curtain and so on. We call this ‘tool knowledge’.
Unlike Cebus monkeys (Spagnoletti et al., 2011), macaque monkeys do not use tools in the wild, and thus they lack this knowledge. However, Peeters et al. Peeters et al. (2009) trained two monkeys for two years in the use of a rake and plier. In only one of the monkeys was the activation greater for observing the use of a tool, and that was for pliers alone (their Figure 13B). However, this effect was found in PG rather than PFG. This negative finding could be used to support the claim that there is a new area in the human brain.
However, we urge caution in interpreting these findings. Peeters et al. (Peeters et al., 2009) acknowledge that the effect in human subjects might reflect their expertise. Though the monkeys were taught for two years, the human subjects were necessarily more expert having had experience for life. There could be two differences that are relevant. With experience human subjects have become more competent, and with experience they have also acquired a richer knowledge of the sorts of things that can be done with any object.
We take the more critical finding to be that the activated cluster for pantomime was greater in our study in the left than the right hemisphere (Figure 3, Table 2). The activation in the study by Peeters et al. (2009) was also in the left hemisphere. It is significant that the connections between the inferior parietal and premotor cortex are heavier on the left than the right hemisphere in the human brain (Caspers et al., 2011)
TABLE 2.
Peak coordinates for the contrast of pantomime versus hand-grip
| LEFT HEMISPHERE | RIGHT HEMISPHERE | |||||
|---|---|---|---|---|---|---|
| Area | Coordinate | Cluster | Z | Coordinate | Cluster | z |
| Visual | ||||||
| hMT+ | −49 −66 +14 | 161 | 19.8 | +49 −66 −4 | 773 | 17.5 |
| STS | −51 −49 +18 | 332 | 12.2 | +53 −48 +11 | 87 | 9.3 |
| V6 (med) | −24 −60 +22 | 99 | 10.4 | +7 −57 +44 | 525.2 | |
| Parietal | ||||||
| PFt | −56 −22 +36 | 74* | 8.5 | |||
| PFop | −48 −26 +29 | 74* | 11.9 | +63 −27 +25 | 89 | 11.1 |
| Premotor | ||||||
| 44 | −50 +15 +6 | 362 | 13.1 | +53 +15 +6 | 74 | 16.7 |
| Prefrontal 45 | −41 +26 +5 | 51 | 4.1 | +54 +23 3 | 61 | 12.5 |
| 47/12 | −43 +42 +5 | 182 | 13.5 | +43 +48 +6 | 60 | 6.9 |
| IFS | −43 +19 +32 | 362 | 13.1 | +34 +28 +26 | 102 | 6.1 |
| 46 | −28 +52 +18 | 267 | 31 | |||
Key
med = in the parieto-occipital fissure on the medial surface (not shown in Figure 3)
= same cluster
hMT+ == human MT/V5 complex
STS = superior temporal sulcus
IFS = inferior frontal sulcus
PFt and PFop = areas within the inferior parietal cortex
BA = cytoarchitectonic areas (though not necessarily delineated by Brodmann)
We suggest that the reason for the left hemisphere dominance is that observation of the hand action affords action in the observer. Since the human observers were all right handed, this would involve the right hand, which is controlled by the left hemisphere. Consistent with this proposal, dominance for action understanding has been described for the right hemisphere in left handers with a strong hand preference (Cabinio et al., 2010).
Affordance
The evidence for affordances is best illustrated by the results for the contrast of hand-grip with pantomime. As in many previous studies (Chao and Martin, 2000) (Grezes et al., 2003), the mere observation of a manipulable object led to activation in PMv. The activation in PMv cannot be interpreted as resulting from the button press because there was a button press in both conditions.
Just as there can be an affordance for objects, there can also be an affordance for viewing actions (Mengotti et al., 2013). In our study, observation of action in the Pantomime condition afforded activation in Broca’s area 44. This was expected from the study by Nelissen et al. (2005), in which activation was found in area F5a in monkeys observing action. Area F5a (Belmalih et al., 2009) and area 44 (Mackey and Petrides, 2010) are neighbouring areas in the macaque monkeys
As in the study by Nelissen et al. (Nelissen et al., 2005), we also found activation in area 45. In the macaque monkey area PFG sends a projection to area 45 as well as to 44 (Frey et al., 2013). Thus, this activation could also be mediated by feedforward connections.
Choice
Our study differs from the study on monkeys by Nelissen et al. (Nelissen et al., 2005) in that our human subjects were required to make choices. We interpret the activations more anteriorly in the prefrontal cortex as reflecting those choices.
In the pantomime condition there were activations in the inferior frontal gyrus (area 47/12). Inactivation of this area severely impairs the ability of macaque monkeys to learn to associate one shape with one movement and a different shape with another (Wang et al., 2000). Furthermore, if human subjects are scanned while they learn similar associations, there are learning related increases in area 47/12 (Toni et al., 2001). As can be seen from Table 5, the coordinates for these activations are similar to those in the present study for retrieving the object that is associated with the pantomime (Table 5). We take these results to suggest that retrieval of a prelearned association makes demands on the same areas that are involved in the learning it in the first place.
In our study the subjects also had to make a choice in the hand-grip condition. Here the activation lay in area 9/46 in the middle frontal gyrus. Human subjects have also been scanned while they made judgements about the orientation of a hand, for example whether it was oriented correctly for inserting a coin in a vending machine (Bach et al., 2010). In that study, there was an activation in the left middle frontal gyrus. As can be seen from Table 5, the coordinate was similar to that in the present study for recognizing the hand-grip that was oriented correctly for holding the object. We note that in monkeys there are cells in this area that code for the arm to be used (Hoshi and Tanji, 2004) and that there are projections from the area to both ventral and dorsal premotor cortex (Wang et al., 2002).
Back projections
In the pantomime condition the frontal activations were more extensive in the left than the right hemisphere (Figure 3, Table 2). This was true, for example, of the activation in area 44. We have already suggested that the explanation is that in right handers, as all of the subjects were, the observation of hand actions affords action with the right hand, and therefore affords activation in left premotor areas.
The effect of an asymmetry in the activation in area 44 would be that the back projections to the parietal cortex would also be stronger in the left hemisphere. An asymmetry in the top–down, back projections from the prefrontal cortex to the posterior parietal cortex would also explain the surprising fact that the activations in the STS are much more extensive in the left than the right hemisphere. This asymmetry is unlikely to result from bottom–up, forward projections in the processing hierarchy. We say this for two reasons: first, a fixation cue was flashed initially; and, second, the videos were presented at that location. Assuming that the subjects directed their gaze at the fixation spot, this means that the videos appeared in central vision rather than predominantly in the left or right visual field. Furthermore, the activations in the human MT complex (hMT+) were symmetrical, and the cluster in V6 was actually greater in the right hemisphere.
It is true that we only tested observation of the right hand. But Biagi et al. (Biagi et al., 2010) scanned subjects while they observed independent finger movements on piano keys; and they found activation in the left, but not right, parietal cortex independent of the hand observed. Thus, it appears that the results for action observation parallel those for action execution. Schluter et al. (2001) used PET to scan human subjects while they performed independent finger movements. There were activations in the left prefrontal, premotor and parietal cortex independent of whether the right or left hand was used. This was not true for the activations in the right hemisphere.
Thus, we account for the asymmetry in the parietal activations in the present study, whether in AIP or PFt, by pointing to the asymmetry in the activations in PMv and area 44. We suggest that top–down projections from PMv and area 44 drive the asymmetries in parietal cortex. In monkeys it is possible to record preparatory activity in premotor cortex that precedes that in parietal cortex (Kalaska and Crammond, 1995); and it would be possible to check the causal link by inactivating premotor cortex and testing whether the preparatory activity is abolished in the parietal cortex. We assume, admittedly speculatively, that in the human brain it is premotor activity on the left that is driving the parietal activity on the left. But this is an assumption that could be checked.
We have not tested whether the comparison between the information carried by the bottom–up, back projections and the information from vision depends on mirror neurons. Chong et al. (2008) used the repetition suppression technique to show that the parietal activation for observation of hand action was decreased if immediately preceded by performance of the identical action. The reverse order was not tested, though Press et al. (Press et al., 2012) report positive results for Broca’s area whichever order is used.
However, while it is clear that mirror neurons should show the effect of repetition suppression, it is less clear that a positive effect of repetition suppression proves the existence of cells that have the properties of mirror neurons. It does, however, indicate that there is an overlap between the population of synapses in a cortical region that is active during observation and the synapses that receive feedback from the area 44.
From pantomime to gesture
We have explained the asymmetry in the activations by arguing that viewing actions affords actions with the right hand, and thus that the asymmetry favours the hemisphere that is dominant for directing movements of that hand. Such an asymmetry would not be expected in macaque monkeys because they do not exhibit handedness in the sense of using the same hand consistently and for all tasks (Chatagny et al., 2013). It is true that captive chimpanzees have been shown to have a slight tendency to right handedness when tested on a bimanual task (Hopkins and Cantalupo, 2003); but this tendency is very slight compared with the marked predominance of strong right handedness in the human population (Annett, 2004).
It is plausible that in the evolution of the hominids handedness was driven by the need for one hemisphere to coordinate the two hands during stone tool making (Passingham, 2008). The suggestion is that it would pay for one hand to specialize in supporting the core and the other in the rapid striking movements needed for knocking off the flakes. If the hominids developed a gestural system of communication, it would therefore come to depend on the same left hemisphere.
Such a system could start by the use of pantomime. One individual could request an object by demonstrating its use, thus ‘naming’ the object manually. Rumiati et al. (2004) used PET to show that there is activation in the inferior parietal cortex when subjects are required to pantomime the use of objects. In a further development of such a system, the actions could then be simplified so as to become static gestures. In the study by Rumiati et al. (2004), the imitation of gestures was found to lead to activation of the tissue in the IPS. As mentioned in the introduction, after lesions of the monkey IPS that include MIP, monkeys are unable to achieve a normal postural configuration (Rushworth et al., 1997b).
Transcranial magnetic stimulation can be used to test predictions that are based on imaging studies. Double-pulse stimulation over the parietal operculum interferes with the tendency towards automatic imitation of the gestures that a subject observes, that is the affordance (Mengotti et al., 2013). And theta burst stimulation over Broca’s area interferes with the production of gestures themselves (Bohlhalter et al., 2011). These results are consistent with the interpretation we have given for our imaging results.
On the basis of these results we are able to make a prediction. This is that the ability to tell what object is being used in pantomime would be impaired by theta burst stimulation over either PFt and PFop or the inferior prefrontal cortex (area 47/12). The assumption behind this prediction is that the parietal stimulation would interfere with the ability to grasp the meaning of the action whereas the prefrontal stimulation would interfere with the retrieval of the appropriate object. An experiment to test these predictions would complement the study of patients (Vaina et al., 1995) from which the present imaging study was derived.
TABLE 3.
Peak coordinates for the contrast of hand-grip versus pantomime
| LEFT HEMISPHERE | RIGHT HEMISPHERE | |||||
|---|---|---|---|---|---|---|
| Area | Coordinate | Cluster | Z | Coordinate | Cluster | Z |
| Parietal | ||||||
| hAIP | −48 −32 +37 | 289 | 6.1 | |||
| Premotor | ||||||
| PMv | −43 −1 +33 | 206 | 11.4 | +41 −7 +40 | 59 | 5.32 |
| Prefrontal | ||||||
| 9/46 | −38 +29 +29 | 116 | 16.4 | −41 +22 +52 | 113 | 9.6 |
Key
hAIP = human AIP
PMv = ventral premotor cortex
BA = cytoarchitectonic area (though not delineated by Brodmann)
Acknowledgements
We thank Steve Wise for very detailed comments on a draft of this paper. We thank Rogier Mars for help with identifying the areas that were activated in parietal cortex and for comments on a draft of this paper. Finally, we thank Michael Nahhas for help with the figures. This work was supported in part by the NIH grant RO1NS064100 to LMV
REFERENCES
- Annett M. Hand preference observed in large healthy samples: classification, norms and interpretations of increased non-right-handedness by the right shift theory. Br J Psychol. 2004;95:339–353. doi: 10.1348/0007126041528130. [DOI] [PubMed] [Google Scholar]
- Bach P, Peelen MV, Tipper SP. On the role of object information in action observation: an fMRI study. Cereb Cortex. 2010;20:2798–2809. doi: 10.1093/cercor/bhq026. [DOI] [PMC free article] [PubMed] [Google Scholar]
- Belmalih A, Borra E, Contini M, Gerbella M, Rozzi S, Luppino G. Multimodal architectonic subdivision of the rostral part (area F5) of the macaque ventral premotor cortex. J Comp Neurol. 2009;512:183–217. doi: 10.1002/cne.21892. [DOI] [PubMed] [Google Scholar]
- Benjamini Y, Hochberg Y. Controlling the false discovery rate: a practical and powerful approach to multiple testing. J Stat Soc B. 1995;57:289–300. [Google Scholar]
- Biagi L, Cioni G, Fogassi L, Guzzetta A, Tosetti M. Anterior intraparietal cortex codes complexity of observed hand movements. Brain Res Bull. 2010;81:434–440. doi: 10.1016/j.brainresbull.2009.12.002. [DOI] [PubMed] [Google Scholar]
- Bohlhalter S, Vanbellingen T, Bertschi M, Wurtz P, Cazzoli D, Nyffeler T, Hess CW, Muri R. Interference with gesture production by theta burst stimulation over left inferior frontal cortex. Clin Neurophysiol. 2011;122:1197–1202. doi: 10.1016/j.clinph.2010.11.008. [DOI] [PubMed] [Google Scholar]
- Bonini L, Rozzi S, Serventi FU, Simone L, Ferrari PF, Fogassi L. Ventral premotor and inferior parietal cortices make distinct contribution to action organization and intention understanding. Cereb Cortex. 2010;20:1372–1385. doi: 10.1093/cercor/bhp200. [DOI] [PubMed] [Google Scholar]
- Bonini L, Serventi FU, Simone L, Rozzi S, Ferrari PF, Fogassi L. Grasping neurons of monkey parietal and premotor cortices encode action goals at distinct levels of abstraction during complex action sequences. J Neurosci. 2011;31:5876–5886. doi: 10.1523/JNEUROSCI.5186-10.2011. [DOI] [PMC free article] [PubMed] [Google Scholar]
- Cabinio M, Blasi V, Borroni P, Montagna M, Iadanza A, Falini A, Cerri G. The shape of motor resonance: right- or left-handed? Neuroimage. 2010;51:313–323. doi: 10.1016/j.neuroimage.2010.01.103. [DOI] [PubMed] [Google Scholar]
- Calvo-Merino B, Glaser DE, Grezes J, Passingham RE, Haggard P. Action observation and acquired motor skills: an FMRI study with expert dancers. Cereb Cortex. 2005;15:1243–1249. doi: 10.1093/cercor/bhi007. [DOI] [PubMed] [Google Scholar]
- Calvo-Merino B, Grezes J, Glaser DE, Passingham RE, Haggard P. Seeing or doing? Influence of visual and motor familiarity in action observation. Curr Biol. 2006;16:1905–1910. doi: 10.1016/j.cub.2006.07.065. [DOI] [PubMed] [Google Scholar]
- Caspers S, Eickhoff SB, Rick T, von Kapri A, Kuhlen T, Huang R, Shah NJ, Zilles K. Probabilistic fibre tract analysis of cytoarchitectonically defined human inferior parietal lobule areas reveals similarities to macaques. Neuroimage. 2011;58:362–380. doi: 10.1016/j.neuroimage.2011.06.027. [DOI] [PMC free article] [PubMed] [Google Scholar]
- Caspers S, Geyer S, Schleicher A, Mohlberg H, Amunts K, Zilles K. The human inferior parietal cortex: cytoarchitectonic parcellation and interindividual variability. Neuroimage. 2006;33:430–448. doi: 10.1016/j.neuroimage.2006.06.054. [DOI] [PubMed] [Google Scholar]
- Cavina-Pratesi C, Monaco S, Fattori P, Galletti C, McAdam TD, Quinlan DJ, Goodale MA, Culham JC. Functional magnetic resonance imaging reveals the neural substrates of arm transport and grip formation in reach-to-grasp actions in humans. J Neurosci. 2010;30:10306–10323. doi: 10.1523/JNEUROSCI.2023-10.2010. [DOI] [PMC free article] [PubMed] [Google Scholar]
- Chao LL, Martin A. Representation of manipulable man-made objects in the dorsal stream. Neuroimage. 2000;12:478–484. doi: 10.1006/nimg.2000.0635. [DOI] [PubMed] [Google Scholar]
- Chatagny P, Badoud S, Kaeser M, Gindrat AD, Savidan J, Fregosi M, Moret V, Roulin C, Schmidlin E, Rouiller EM. Distinction between hand dominance and hand preference in primates: a behavioral investigation of manual dexterity in nonhuman primates (macaques) and human subjects. Brain and behavior. 2013;3:575–595. doi: 10.1002/brb3.160. [DOI] [PMC free article] [PubMed] [Google Scholar]
- Chong TT, Cunnington R, Williams MA, Kanwisher N, Mattingley JB. fMRI adaptation reveals mirror neurons in human inferior parietal cortex. Curr Biol. 2008;18:1576–1580. doi: 10.1016/j.cub.2008.08.068. [DOI] [PMC free article] [PubMed] [Google Scholar]
- Dale AM, Fischl B, Sereno MI. Cortical surface-based analysis. I. Segmentation and surface reconstruction. Neuroimage. 1999;9:179–194. doi: 10.1006/nimg.1998.0395. [DOI] [PubMed] [Google Scholar]
- Eickhoff SB, Stephan KE, Mohlberg H, Grefkes C, Fink GR, Amunts K, Zilles K. A new SPM toolbox for combining probabilistic cytoarchitectonic maps and functional imaging data. Neuroimage. 2005;25:1325–1335. doi: 10.1016/j.neuroimage.2004.12.034. [DOI] [PubMed] [Google Scholar]
- Fischl B, Sereno MI, Dale AM. Cortical surface-based analysis. II. Inflation, flattening and a surface based coordinate system. Neuroimage. 1999;9:195–207. doi: 10.1006/nimg.1998.0396. [DOI] [PubMed] [Google Scholar]
- Fogassi L, Gallese V, Buccino G, Craighero L, Fadiga L, Rizzolatti G. Cortical mechanism for the visual guidance of hand grasping movements in the monkey: a reversible inactivation study. Brain. 2001;124:571–586. doi: 10.1093/brain/124.3.571. [DOI] [PubMed] [Google Scholar]
- Forman SD, Cohen JD, Fitzgerald M, Eddy WF, Mintun MA, Noll DC. Improved assessment of significant activation in functional magnetic resonance imaging (fMRI): use of a cluster-size threshold. Magn Reson Med. 1995;33:636–647. doi: 10.1002/mrm.1910330508. [DOI] [PubMed] [Google Scholar]
- Frey S, Mackey S, Petrides M. Cortico-cortical connections of areas 44 and 45B in the macaque monkey. Brain Lang. 2013 doi: 10.1016/j.bandl.2013.05.005. [DOI] [PubMed] [Google Scholar]
- Grezes J, Armony JL, Rowe J, Passingham RE. Activations related to "mirror" and "canonical" neurones in the human brain: an fMRI study. Neuroimage. 2003;18:928–937. doi: 10.1016/s1053-8119(03)00042-9. [DOI] [PubMed] [Google Scholar]
- Hopkins WD, Cantalupo C. Does variation in sample size explain individual differences in hand preferences of chimpanzees (Pan troglodytes)? An empirical study and reply to Palmer (2002) Am J Phys Anthropol. 2003;121:378–381. doi: 10.1002/ajpa.10170. author reply 382-374. [DOI] [PMC free article] [PubMed] [Google Scholar]
- Hoshi E, Tanji J. Area-selective neuronal activity in the dorsolateral prefrontal cortex for information retrieval and action planning. J Neurophysiol. 2004;91:2707–2722. doi: 10.1152/jn.00904.2003. [DOI] [PubMed] [Google Scholar]
- Jellema T, Perrett DI. Cells in monkey STS responsive to articulated body motions and consequent static posture: a case of implied motion? Neuropsychol. 2003;41:1728–1737. doi: 10.1016/s0028-3932(03)00175-1. [DOI] [PubMed] [Google Scholar]
- Kalaska JF, Crammond DJ. Deciding not to GO: neuronal correlates of response selection in a GO/NOGO task in primate premotor and parietal cortex. Cereb Cortex. 1995;5:410–428. doi: 10.1093/cercor/5.5.410. [DOI] [PubMed] [Google Scholar]
- Kalenine S, Buxbaum LJ, Coslett HB. Critical brain regions for action recognition: lesion symptom mapping in left hemisphere stroke. Brain. 2010;133:3269–3280. doi: 10.1093/brain/awq210. [DOI] [PMC free article] [PubMed] [Google Scholar]
- Mackey S, Petrides M. Quantitative demonstration of comparable architectonic areas within the ventromedial and lateral orbital frontal cortex in the human and the macaque monkey brains. Eur J Neurosci. 2010;32:1940–1950. doi: 10.1111/j.1460-9568.2010.07465.x. [DOI] [PubMed] [Google Scholar]
- Mars RB, Jbabdi S, Sallet J, O'Reilly JX, Croxson PL, Olivier E, Noonan MP, Bergmann C, Mitchell AS, Baxter MG, Behrens TE, Johansen-Berg H, Tomassini V, Miller KL, Rushworth MF. Diffusion-weighted imaging tractography-based parcellation of the human parietal cortex and comparison with human and macaque resting-state functional connectivity. J Neurosci. 2011;31:4087–4100. doi: 10.1523/JNEUROSCI.5102-10.2011. [DOI] [PMC free article] [PubMed] [Google Scholar]
- Mengotti P, Ticini LF, Waszak F, Schutz-Bosbach S, Rumiati RI. Imitating others' actions: transcranial magnetic stimulation of the parietal opercula reveals the processes underlying automatic imitation. Eur J Neurosci. 2013;37:316–322. doi: 10.1111/ejn.12019. [DOI] [PubMed] [Google Scholar]
- Nelissen K, Borra E, Gerbella M, Rozzi S, Luppino G, Vanduffel W, Rizzolatti G, Orban GA. Action observation circuits in the macaque monkey cortex. J Neurosci. 2011;31:3743–3756. doi: 10.1523/JNEUROSCI.4803-10.2011. [DOI] [PMC free article] [PubMed] [Google Scholar]
- Nelissen K, Luppino G, Vanduffel W, Rizzolatti G, Orban GA. Observing others: multiple action representation in the frontal lobe. Science. 2005;310:332–336. doi: 10.1126/science.1115593. [DOI] [PubMed] [Google Scholar]
- Oldfield C. The assessment and analysis of handedness: the Edinburgh Inventory. Neuropsychol. 1971;9:97–100. doi: 10.1016/0028-3932(71)90067-4. [DOI] [PubMed] [Google Scholar]
- Pandya DN, Seltzer B. Intrinsic connections and architectonics of posterior parietal cortex in the rhesus monkey. JCompPhysiolPsychol. 1982;20:204. doi: 10.1002/cne.902040208. [DOI] [PubMed] [Google Scholar]
- Passingham RE. What is Special.about the Human Brain. Oxford University Press; Oxford: 2008. [Google Scholar]
- Passingham RE, Wise SP. The Neurobiology of Prefrontal Cortex. Oxford University Press; Oxford: 2012. [Google Scholar]
- Peeters R, Simone L, Nelissen K, Fabbri-Destro M, Vanduffel W, Rizzolatti G, Orban GA. The representation of tool use in humans and monkeys: common and uniquely human features. J Neurosci. 2009;29:11523–11539. doi: 10.1523/JNEUROSCI.2040-09.2009. [DOI] [PMC free article] [PubMed] [Google Scholar]
- Peeters RR, Rizzolatti G, Orban GA. Functional properties of the left parietal tool use region. Neuroimage. 2013;78:83–93. doi: 10.1016/j.neuroimage.2013.04.023. [DOI] [PubMed] [Google Scholar]
- Petrides M, Pandya DN. Comparative cytoarchitectonic analysis of the human and macaque ventrolateral prefrontal cortex and corticocortical connection pattern in the monkey. Eur J Neurosci. 2002;16:291–310. doi: 10.1046/j.1460-9568.2001.02090.x. [DOI] [PubMed] [Google Scholar]
- Pitzalis S, Sdoia S, Bultrini A, Committeri G, Di Russo F, Fattori P, Galletti C, Galati G. Selectivity to translational egomotion in human brain motion areas. PLoS One. 2013;8:e60241. doi: 10.1371/journal.pone.0060241. [DOI] [PMC free article] [PubMed] [Google Scholar]
- Poline JB, Mazoyer BM. Analysis of individual positron emission tomography activation maps by detection of high signal-to-noise-ratio pixel clusters. J Cereb Blood Flow Metab. 1993;13:425–437. doi: 10.1038/jcbfm.1993.57. [DOI] [PubMed] [Google Scholar]
- Press C, Weiskopf N, Kilner JM. Dissociable roles of human inferior frontal gyrus during action execution and observation. Neuroimage. 2012;60:1671–1677. doi: 10.1016/j.neuroimage.2012.01.118. [DOI] [PMC free article] [PubMed] [Google Scholar]
- Prevosto V, Graf W, Ugolini G. Posterior parietal cortex areas MIP and LIPv receive eye position and velocity inputs via ascending preposito-thalamo-cortical pathways. Eur J Neurosci. 2009;30:1151–1161. doi: 10.1111/j.1460-9568.2009.06885.x. [DOI] [PubMed] [Google Scholar]
- Rizzolatti G, Fogassi L, Gallese V. Neurophysiological mechanisms underlying the understanding and imitation of action. Nat Rev Neurosci. 2001;2:661–670. doi: 10.1038/35090060. [DOI] [PubMed] [Google Scholar]
- Rothi LJ, Heilman KM, Watson RT. Pantomime comprehension and ideomotor apraxia. J Neurol Neurosurg Psychiatry. 1985;48:207–210. doi: 10.1136/jnnp.48.3.207. [DOI] [PMC free article] [PubMed] [Google Scholar]
- Rozzi S, Calzavara R, Belmalih A, Borra E, Gregoriou GG, Matelli M, Luppino G. Cortical connections of the inferior parietal cortical convexity of the macaque monkey. Cereb Cortex. 2006;16:1389–1417. doi: 10.1093/cercor/bhj076. [DOI] [PubMed] [Google Scholar]
- Rozzi S, Ferrari PF, Bonini L, Rizzolatti G, Fogassi L. Functional organization of inferior parietal lobule convexity in the macaque monkey: electrophysiological characterization of motor, sensory and mirror responses and their correlation with cytoarchitectonic areas. Eur J Neurosci. 2008;28:1569–1588. doi: 10.1111/j.1460-9568.2008.06395.x. [DOI] [PubMed] [Google Scholar]
- Rumiati RI, Weiss PH, Shallice T, Ottoboni G, Noth J, Zilles K, Fink GR. Neural basis of pantomiming the use of visually presented objects. Neuroimage. 2004;21:1224–1231. doi: 10.1016/j.neuroimage.2003.11.017. [DOI] [PubMed] [Google Scholar]
- Rushworth M, Nixon PD, Passingham RE. Parietal cortex and movement. I. Movement selection and reaching. ExperBrain Res. 1997a;117:292–310. doi: 10.1007/s002210050224. [DOI] [PubMed] [Google Scholar]
- Rushworth MFS, Johansen-Berg H, Young SA. Parietal cortex and spatial-postural transformation during arm movements. JNeurophysiol. 1997b;79:478–482. doi: 10.1152/jn.1998.79.1.478. [DOI] [PubMed] [Google Scholar]
- Rushworth MFS, Nixon PD, Passingham RE. Parietal cortex and movement. II. Spatial representation. ExperBrain Res. 1997c;117:311–323. doi: 10.1007/s002210050225. [DOI] [PubMed] [Google Scholar]
- Sakata H, Taira M, Kusonoki M, Murata A, Tanaka V. The parietal association cortex in depth perception and visual control of hand action. TINS. 1997;20:350–356. doi: 10.1016/s0166-2236(97)01067-9. [DOI] [PubMed] [Google Scholar]
- Sallet J, Mars RB, Noonan MP, Neubert FX, Jbabdi S, O'Reilly JX, Filippini N, Thomas AG, Rushworth MF. The organization of dorsal frontal cortex in humans and macaques. J Neurosci. 2013;33:12255–12274. doi: 10.1523/JNEUROSCI.5108-12.2013. [DOI] [PMC free article] [PubMed] [Google Scholar]
- Schluter ND, Krams M, Rushworth MF, Passingham RE. Cerebral dominance for action in the human brain: the selection of actions. Neuropsychol. 2001;39:105–113. doi: 10.1016/s0028-3932(00)00105-6. [DOI] [PubMed] [Google Scholar]
- Spagnoletti N, Visalberghi E, Ottoni E, Izar P, Fragaszy D. Stone tool use by adult wild bearded capuchin monkeys (Cebus libidinosus). Frequency, efficiency and tool selectivity. J Hum Evol. 2011;61:97–107. doi: 10.1016/j.jhevol.2011.02.010. [DOI] [PubMed] [Google Scholar]
- Tomassini V, Jbabdi S, Klein JC, Behrens TE, Pozzilli C, Matthews PM, Rushworth MF, Johansen-Berg H. Diffusion-weighted imaging tractography-based parcellation of the human lateral premotor cortex identifies dorsal and ventral subregions with anatomical and functional specializations. J Neurosci. 2007;27:10259–10269. doi: 10.1523/JNEUROSCI.2144-07.2007. [DOI] [PMC free article] [PubMed] [Google Scholar]
- Toni I, Ramnani N, Josephs O, Ashburner J, Passingham RE. Learning arbitrary visuomotor associations: temporal dynamic of brain activity. Neuroimage. 2001;14:1048–1057. doi: 10.1006/nimg.2001.0894. [DOI] [PubMed] [Google Scholar]
- Vaina L, Goodglass H, Daltroy L. Inference of object use from pantomimed actions by aphasics and patients with right hemisphere lesions. Synthese. 1995;104:43–47. [Google Scholar]
- Wallis JD, Anderson KC, Miller EK. Single neurons in prefrontal cortex encode abstract rules. Nature. 2001;411:953–956. doi: 10.1038/35082081. [DOI] [PubMed] [Google Scholar]
- Wang L, Goodglass H. Pantomime, praxis, and aphasia. Brain Lang. 1992;42:402–418. doi: 10.1016/0093-934x(92)90076-q. [DOI] [PubMed] [Google Scholar]
- Wang M, Zhang H, Li BM. Deficit in conditional visuomotor learning by local infusion of bicuculline into the ventral prefrontal cortex in monkeys. Eur J Neurosci. 2000;12:3787–3796. doi: 10.1046/j.1460-9568.2000.00238.x. [DOI] [PubMed] [Google Scholar]
- Wang Y, Shima K, Osoda M, Sawamura H, Tanji J. Spatial distribution and density of prefrontal cortical cells projecting to three sectors of the premotor cortex. Neurorep. 2002;13:1341–1344. doi: 10.1097/00001756-200207190-00025. [DOI] [PubMed] [Google Scholar]
- Yokochi H, Tanaka M, Kumashiro M, Iriki A. Inferior parietal somatosensory neurons coding face-hand coordination in Japanese macaques. Somatosens Mot Res. 2003;20:115–125. doi: 10.1080/0899022031000105145. [DOI] [PubMed] [Google Scholar]