

Abstract
Analysis of post-contraction MRI signal intensity transients may allow non-invasive studies of microvascular reactivity and blood oxygenation recovery. The purpose of this study was to determine the physiological basis for post-contraction changes in short- (6 ms) and long- (46 ms) echo gradient-echo MRI signals (S6 and S46, respectively). Six healthy subjects were studied using dual gradient-echo MRI and near-infrared spectroscopy. S6, S46, total hemoglobin concentration ([THb]), and oxyhemoglobin saturation (%HbO2) were measured before, during, and after 1) 2 and 8 s dorsiflexion maximal voluntary contractions and 2) 5 min. of proximal arterial occlusion. Changes in S6 and [THb] after 2 s contractions were similar to those following 8 s contractions, but changes in %HbO2 and S46 were greater following 8 s contractions than following 2 s contractions. [THb] and S6 did not change during and following 5 minutes of arterial occlusion, but %HbO2 and S46 were both significantly depressed at similar occlusion durations. Also, distance measures indicated similarity between S6 and [THb] and between S46 and %HbO2. We conclude that following brief human skeletal muscle contractions, changes in S6 primarily reflect changes in blood volume and changes in S46 primarily reflect changes in blood oxygenation.
Keywords: human, hyperemia, arterial occlusion, near-infrared spectroscopy
INTRODUCTION
As the site of oxygen delivery and substrate exchange to the peripheral tissues of the body, the microcirculation has important roles in maintaining the health and function of these tissues. Because the microcirculation adapts positively to exercise training (1) and is pathologically altered in diseases such as diabetes (2), assessing microcirculatory function is important to understanding normal, adaptational, and pathological physiology. A need exists in particular to develop non-invasive protocols for examining microvascular function during and following challenges such as isometric muscle contractions.
Elevated intramuscular pressure during isometric contractions compresses the vessels of the microcirculation along the fascicular lines (3). This compression causes a rapid ejection of venous blood, decreasing the total muscle and limb volumes (4), and restricts arterial inflow to the muscle for those portions of the cardiac cycle in which the intramuscular pressure exceeds the blood’s hydrostatic pressure (5). Following the contraction, local, rapid increases in blood flow and volume occur in order to resupply the tissue with the oxygen that was consumed by the muscle. This reactive hyperemia has been shown to be inversely related to the degree of mechanical occlusion, and directly related to the metabolic regulators of vasodilation that are released in the tissue (6).
One non-invasive technique for examining hemodynamic events in the microcirculation is near-infrared spectroscopy (NIRS), which exploits the relative ease of near-infrared light transmission through tissues and the differential absorption of this light by oxyhemoglobin (HbO2) and deoxyhemoglobin (HHb). While the confounding influences of subcutaneous fat thickness (7,8) and the similar absorption spectrum of myoglobin must be considered when interpreting NIRS data, this technique is generally quite useful for following the changes in total hemoglobin concentration ([THb]) and HbO2 saturation (%HbO2) during and after exercise or other physiologic events. The depth of light penetration for NIRS is generally considered to be about half of the light emitter-detector spacing (9) and is about 2 cm for most NIRS devices. This depth is a limitation when there is perfusion or oxygen extraction heterogeneity, such as has been demonstrated for healthy subjects (10–12) and peripheral vascular disease patients (13), when deep muscles are activated, or when there is an appreciable subcutaneous fat layer thickness.
Functional MRI methods can overcome the depth sampling limitations of NIRS. Several recent papers have described standard functional MRI-type imaging strategies to observe post-isometric contraction blood volume and oxygenation changes (14–16). We obtained T1-weighted echo-planar MR images before, during, and after ten second isometric dorsiflexion contractions ranging from 10–100% of maximum voluntary contraction (MVC) and observed transient rises in signal intensity following the contractions (16). By applying a numerical model of the BOLD effect and through the similar plateau behavior of the post-contraction signal transients and venous-occlusion plethysmography data with contraction intensity, we argued that the post-contraction signal intensity transients that we observed mainly reflected changes in blood volume. In contrast, in 2004 Meyer et al. reported transient rises in MRI signal intensity following one second dorsiflexion MVCs, and ascribed these to short-lived elevations in blood oxygenation (14). The apparent discrepancies between these studies may be due to the differences in echo times (TE) used in the two studies. By using a long TE value (~45 ms) Meyer et al weighted their images strongly to the effective transverse relaxation time constant (T2*), which is the relaxation parameter that is most sensitive to changes in %HbO2. The differences in the signal dependence may also have resulted from the shorter contraction duration used by Meyer et al.
As discussed previously, analysis of these signal transients affords the potential for examining microcirculatory function after training (15) and in disease. However, their potential usefulness is hindered by the unresolved biophysical basis for the signal changes, and how this basis may vary with the source of image contrast and the contraction duration. The purpose of this study was to use dual gradient-echo MRI to test the hypotheses that short-TE gradient-echo signals would be related to blood volume changes and that long-TE gradient-echo signals would be related to blood oxygenation changes. A secondary goal was to confirm the previous finding of Meyer et al. (14) that post-contraction signal intensity transients are unaffected by inflow effects. Because [THb] and %HbO2 vary together for much of the post-contraction period (8), we also tested hypotheses concerning the physiological determinants of the short- and long-TE signal intensity changes using prolonged arterial occlusion studies. Together, the data support these hypotheses.
METHODS
Subjects
The studies were approved by the Vanderbilt University and University of Massachusetts at Amherst Institutional Review Boards and were in accordance with the Declaration of Helsinki. Six subjects with no known chronic medical conditions (3 male) with mean age 27.0 (SD 6.8) years, height 174.4 (SD 9.0) cm, and mass 73.3 (SD 18.7) kg provided written informed consent prior to participation. The studies were conducted at Vanderbilt University.
Experimental Protocol
Subjects reported to the lab on four or five occasions. Those who had no prior experience with isometric dorsiflexion exercise (n=2) reported first for an initial visit at which health and MRI screening procedures were performed, informed consent was received, and the contraction protocol was rehearsed. Other subjects had participated in other recent studies in our lab and so no familiarization session was required. During two of the testing sessions, the subjects performed a series of dorsiflexion MVCs while MRI or NIRS data were acquired. During the other two sessions, MRI or NIRS data were acquired during proximal arterial occlusion. The MRI and NIRS sessions occurred inside and outside of the magnet, respectively. The order of the four sessions was randomized. The subjects were instructed not to consume caffeine or use tobacco during the six hours prior to a test session and not to use alcohol or perform moderate or heavy physical activity for at least 24 hours prior to each session.
Isometric Contractions
Contraction Protocol
All exercise involved isometric dorsiflexion of the subject’s self-reported dominant foot. The subject lay supine with his/her foot strapped into a home-built isometric exercise device. For out-of-magnet studies, the exercise device was bolted to a grid plate attached to an exercise table; for in-magnet studies, the device was bolted to a similar grid plate on the patient bed of the imager. The ankle angle was 90° and the knee was supported by a bolster and slightly flexed (angle of leg flexion ~7.5°). The foot was firmly strapped to the exercise device using 3.8 cm wide nylon straps; to limit the involvement of the toe extensors, the straps were placed across the foot proximal to the base of the fifth digit. To eliminate hydrostatic effects on the circulation, the heart was at approximately the same level as the tibialis anterior (TA) muscle, the primary dorsiflexor.
In MRI studies, the subjects performed a total of eight contractions; four were 2s long and four were 8s long. In NIRS studies, the subjects performed two 2 s contractions and two 8s contractions. For each contraction, the subject was instructed to pull as hard and as fast as possible and was provided with strong verbal encouragement during the contraction. Five minutes of rest were provided between contractions and the subject was instructed to remain as still as possible during the first two minutes following the contraction. Visual inspection of the subject during NIRS procedures and examination of the post-contraction images from the MRI procedures, in which there were no shifts in leg position, indicated compliance with these instructions.
Force Data Acquisition and Analysis
The isometric dorsiflexion device included an Interface Force (Interface Force, Scottsdale AZ) Model SSM-AJ-500 load cell. The signals from the load cell were amplified and conditioned using a bridge amplifier (Model SGA/A, Interface Force). The conditioned signals were connected via a serial connector box (Model SCB-68, National Instruments, Austin TX) to an analog-to-digital conversion card (Model 6036E, National Instruments). Data acquisition software written in LabVIEW 7.1 (National Instruments) was used to collect force data at 1 kHz and provide real-time, 20 Hz visual feedback to the subjects in the form of a simulated LED panel on a computer screen (for out-of-magnet studies) or on a pair of MRI-compatible LCD goggles (for in magnet studies). The baseline force offset was measured before each contraction. The data were low-pass filtered at 25 Hz and the maximum force recorded during each contraction was used to represent the subject’s MVC force. For NIRS studies, the force signals from the serial connector box were also sampled by the NIRS software (ISS Oximeter software v 2.14, ISS, Inc., Champaign IL).
Arterial Occlusion
The subject lay supine on the exercise table or patient bed with his/her foot strapped into the exercise device. A pneumatic cuff was placed around the thigh and connected to a Hokanson E20 rapid cuff inflator (Hokanson, Bellevue WA) and Hokanson AG101 air source. The heart, foot, and knee were in the same position as for the contraction studies. Following ~10 min. of rest in this position, the cuff was rapidly inflated to 240 mmHg. The arterial occlusion continued for a period of 5 min, following which the cuff was rapidly released.
NIRS Data Acquisition and Analysis
Tissue oxygenation data were collected using a frequency domain, multi-distance NIRS oximeter (Model 96208, ISS, Inc.) and its accompanying software. Prior to each testing session, the oximeter was calibrated using a block with known absorption and scattering coefficients and the performance was verified using a second block with different optical properties. A rigid emitter-detector head was placed over the maximum cross-sectional area of the muscle, as identified by visual inspection and palpation, and held in place using an elastic strap. The strap was adjusted to be just tight enough to prevent motion of the probe during the contraction. The probe made good contact with the skin and no motion of the probe relative to the skin was observed during or after the contractions. The oximeter head was covered with an opaque material and the room lights were dimmed.
The oximeter emits light through fiber optic cables from four laser diodes at a wavelength of 730 nm and from four laser diodes at a wavelength of 860 nm. The oximeter head is arranged such that the four fibers emitting light at each wavelength are located at different distances from a single detector (2.0, 2.5, 3.0, and 3.5 cm). The light is intensity-modulated at 110 MHz and the AC, DC, and Phase components of the light at each distance are measured to determine the absorption and scattering coefficients. These data were used to calculate [THb] and %HbO2 according to the manufacturer’s algorithms. All data were sampled at 6.45 Hz and a 7 point (1.09 s) moving average was applied during data analysis, as described previously (8).
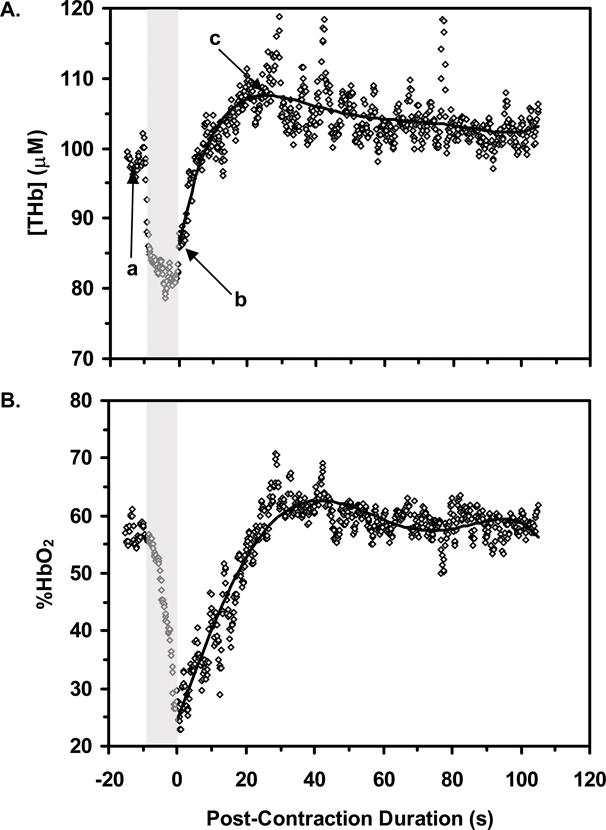
The mean pre-contraction [THb] and %HbO2 values were calculated for the 10 s period before each contraction. The post-contraction data from the two 2 s contractions and from the two 8 s contractions were averaged. To analyze the post-contraction datasets, the data were fit to a 6th order polynomial and characterized with the post-contraction minimum value, the post-contraction maximum value, and the difference between these values expressed relative to the pre-contraction mean. Figure 1 illustrates this analysis for the average data from two 8 s trials of one subject. To analyze the arterial occlusion data, the mean [THb] and %HbO2 values were calculated during 5 s windows centered on the 0, 20, 40…440 s time points, where 0 s represents the pre-occlusion mean value and 300 s represents the end of the arterial occlusion period. Also, the post-occlusion [THb] and %HbO2 data were fit to a 6th order polynomial and characterized with the maximum post-occlusion value.
Figure-1.
MRI Data Acquisition and Analysis
MRI data were obtained on a 3T Philips Intera Achieva MR Imager/Spectrometer. As the subject lay supine with the foot in the exercise device, but before being advanced into the imager, s/he contracted the dorsiflexors. During the contraction, the maximum cross-sectional area of the TA muscle was identified visually and by palpation. A 16 cm, 8-channel SENSE RF knee coil was then positioned around the leg such that the center of the coil was aligned with this location and the subject was then advanced into the magnet. The imaging procedures began with the acquisition of 3-plane gradient-echo scout images, used to verify to location of the TA’s maximum girth. If necessary, the patient bed was moved so that this location was nearer the magnet isocenter. Then a high resolution, T1-weighted anatomical image was obtained using a fast spin-echo sequence and slice thickness 7.5 mm, field of view 20×20 cm, acquired matrix 256×256 (reconstructed matrix 512×512), repetition time (TR)/echo time (TE)=500/18.6 ms, echo-train length=3, and number of excitations (NEX)=2. A voxel was specified within the imaged portion of the leg and used for second-order shimming. Next, functional MRI data were obtained using a dual gradient-echo echo-planar imaging sequence for 20 s before, during, and 90 s after each contraction. The functional images were obtained using the same geometric parameters as the anatomical image, acquired matrix= 64×64 (reconstructed matrix=128×128), a fat-frequency selective saturation pulse applied immediately before the excitation pulse, NEX=1, 60.3% k-space sampling, and the image contrast parameters listed in Table 1. Calculating the steady-state magnetization (MSS) as:
| [1] |
where M0 is the equilibrium magnetization and α is the nutation angle, and assuming a T1 of 1200 ms, these TR and α variations produced a 1.84-fold variation in MSS in the four TR/α conditions. This variation provided a range of sensitivity to possible flow-induced variations in the apparent T1 of the tissue (17), while the variation in TE altered the sensitivity to variations in T2* brought about by blood oxygenation changes. Thus there were eight sets of image acquisition parameters tested for each contraction duration, which by virtue of the dual-echo image acquisitions were obtained using four separate image series.
Table 1.
Imaging parameters and corresponding degrees of partial saturation. Abbreviations not previously noted: α, nutation angle; MSS, steady-state magnetization. MSS is normalized to M0=1
| TR (ms) | α (°) | TE (ms) | MSS (AU) |
|---|---|---|---|
| 500 | 90 | 6 46 |
0.34 |
| 45 | 6 46 |
0.45 | |
| 1000 | 90 | 6 46 |
0.56 |
| 60 | 6 46 |
0.63 |
Image analysis was conducted using Matlab v. 7.0.1 (The Mathworks, Natick MA). In the anatomical images, a line was drawn from the muscle to the skin surface and used to measure the thickness of the subcutaneous fat and the muscle depth. Also, a region of interest (ROI) was drawn along the border of the TA muscle, carefully excluding any resolved vessels, and the TA’s in-plane cross-sectional area was determined. To measure the amount of non-contractile tissue in the ROI, the in-plane area of the aponeurosis dividing the superficial and deep compartments of the TA muscle was measured and expressed as a percentage of the total TA area. In the functional images, an ROI was drawn along the borders of the TA muscle and the mean signal intensity in the 6 and 46 ms images (S6 and S46, respectively) was measured in this ROI as a function of time. The mean pre-contraction S6 and S46 values were calculated in the ROI and the subsequent values were expressed as a percentage of this value. The post-contraction data were fit to a 6th order polynomial and characterized with the post-contraction minimum value, the post-contraction maximum value, and the difference between these values expressed relative to the pre-contraction mean. A similar ROI was defined in the images obtained during the arterial occlusion protocol. S6 and S46 data were averaged over 5 s windows centered on the 0, 20…440 s time points. Also, the post-occlusion S6 and S46 data were fit to a 6th order polynomial and characterized with the maximum post-occlusion value.
MRI Relaxation Data and Signal Sensitivity Analysis
To determine the sensitivity of changes in S6 and S46 to changes in the apparent proton density, ρ, and T2*, we used the TR/α=1000 ms/90° image series to calculate T2* maps before, during, and after the contraction. T2* was calculated on a pixel-wise basis as:
| [2a] |
The equilibrium signal intensity, S0, was assumed to be directly proportional to ρ. S0 was calculated as:
| [2b] |
Individual subject’s S0 values were then converted to percentages of the group mean S0 value and are expressed in arbitrary units (AU). The pre-contraction S0 and T2* values were calculated as the mean of the five images obtained immediately prior to the contraction. The post-contraction S0 and T2* data were fit to a 6th order polynomial and characterized with their minimum post-contraction values, their maximum post-contraction values, and the differences between them expressed as a percentage of the mean pre-contraction value. The mean S0 and T2* data were used to predict the pre-contraction, minimum post-contraction, and maximum post-contraction signal intensities using:
| [3] |
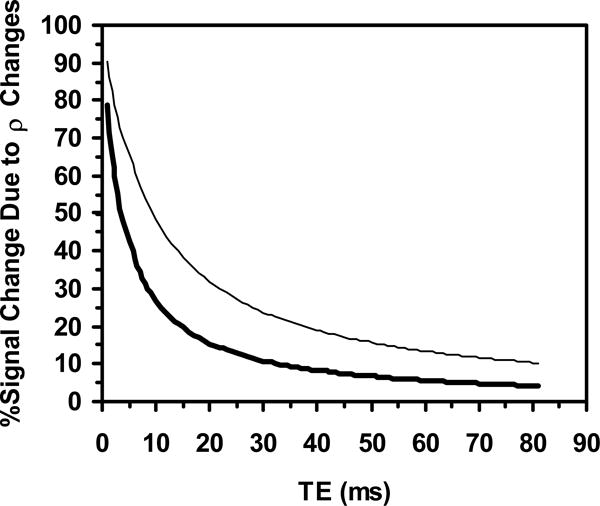
We assumed that any changes in the apparent T1 could be neglected, which is implied by the lack of dependence of the signal changes on TR (see Meyer et al. (14) and below). The calculated signal intensities were used to predict post-contraction signal intensity changes (SP) by expressing the post-contraction signal difference as a percentage of the mean pre-contraction value (i.e., in a manner analogous to the raw signal intensity measurements). This analysis was conducted for values of TE ranging from 1 to 81 ms (~3 times the T2*; see below). SP was then re-calculated using only the S0 changes (SP,ρ). The relative contributions of S0 changes to SP were calculated for the TR/α=1000 ms/90° condition by expressing SP,ρ as a percentage of SP. Of particular interest for this study were the predicted values at TE values of 6 and 46 ms (S6P and S46P, respectively).
Statistical Analysis
Statistical analyses were performed using SPSS v. 13 (SPSS Inc, Chicago IL). The data for the male and female subjects were pooled because the underlying hemodynamic determinants of the signal changes do not respond differently to isometric contractions in males and females (8). Descriptive data presented include the mean and standard deviation (SD). To compare the MVC forces achieved during MRI and NIRS procedures, the mean MVC force for the MRI procedures and the mean MVC force for the NIRS procedures were compared using a paired Student’s t-test. The following analyses were conducted using MVC forces expressed relative to the first MVC in the MRI or NIRS series. To determine if there were significant order effects to the MVC force achieved during the MRI and NIRS procedures, an analysis of variance (ANOVA) was computed. To determine whether the MVC forces achieved during the different MRI parameter sets were similar, the general linear model (GLM) (Contraction Duration×TR×α) was computed.
Analysis of the NIRS and MRI data occurred as follows. The post-contraction relative changes in [THb] and %HbO2 for the 2 and 8 s contractions were compared using the GLM (Contraction Duration×Blood Parameter). To determine the sensitivity of the signal transients to changes in the apparent T1 of the tissue, the peak post-8s contraction changes in S6 for the TR/α= 500 ms/90°, 1000 ms/90°, and 1000 ms/60° conditions were compared using a one-way ANOVA. The 8 s contraction data were used to provide the largest dynamic range for the detection of effects (see below), and the S6 data were used to avoid potentially confounding influences of T2* changes. To determine the effect of contraction duration and TE on the post-contraction signal transients, the peak changes in S6 and S46 were analyzed using the GLM (Contraction Duration×TE). To avoid confounding effects of TR and α, this analysis was conducted using only the TR/α= 1000ms/90° data. All factors in all implementations of the GLM were within-subjects factors. The mean pre-contraction and maximum post-contraction S0 and T2* values were compared separately for the 2 and 8 s contractions using a one-tailed, paired Student’s t-test. The mean post-contraction S0 and T2* changes were compared for the 2 vs. 8 s contractions using a one-tailed, paired Student’s t-test.
To analyze the arterial occlusion data, a one-way ANOVA, with repeated measures on Time, was conducted to determine the times at which [THb], %HbO2, S6, and S46 differed from their pre-occlusion values. Tukey’s post hoc test was applied when indicated. In addition, the maximum post-occlusion values for [THb], %HbO2, S6, and S46 were compared to the corresponding pre-occlusion values using a paired Student’s t-test. Finally, the group-mean normalized (zero-mean, unit-SD) [THb], %HbO2, S6, and S46 arterial occlusion time courses were computed and a similarity analysis was performed for all NIRS-MRI variable pairs by calculating the mean Euclidean distance between the time courses. Differences were considered statistically significant at p<0.05.
RESULTS
Anatomical Features
The mean in-plane area of the TA was 5.83 (SD 0.68) cm2. Of this, the aponeurosis occupied a mean area of 0.24 (SD 0.03) cm2. The mean subcutaneous fat layer thickness was 0.34 cm (SD 0.04 cm) and the mean depth of the muscle below the skin surface was 2.87 (SD 0.24) cm.
Contraction Protocols
MVC Force Production
The mean MVC force during MRI procedures was 291.0 (SD 94.9) N and during NIRS procedures was 267.5 (SD 74.3) N; these values did not differ significantly (p>0.05). For neither procedure was there a significant order effect (p=0.924 and 0.997 for MRI and NIRS, respectively). During contractions performed during the MRI procedures, neither the Contraction Duration, TR, nor α main effects were significant (p=0.904, 0.172, and 0.662, respectively). In summary, the MVC force achieved did not vary significantly with either the type of test being performed (MRI or NIRS), at different contraction durations, during adjustments to the imaging parameters, or as a function of contraction order.
NIRS Data
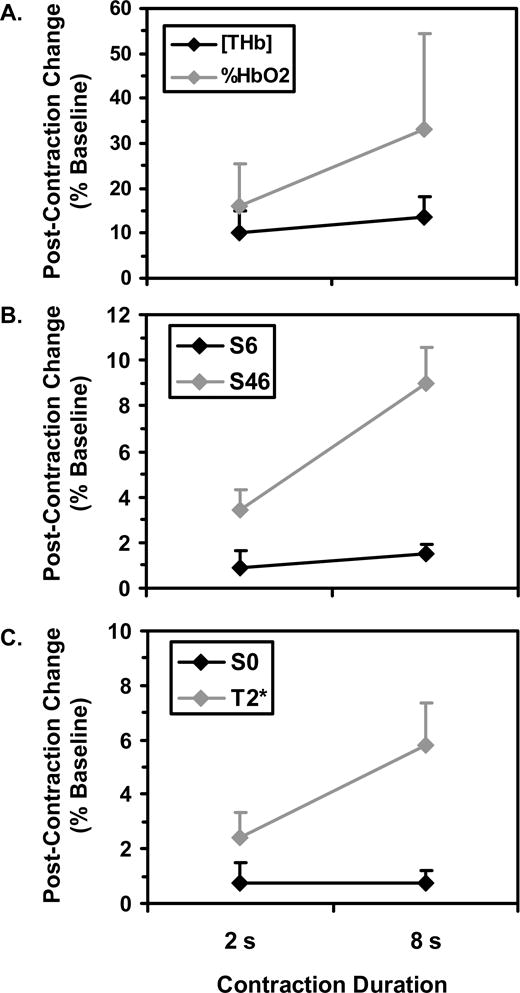
Typical NIRS data following an 8 s contraction were shown in Figure 1. There was a significant Blood Parameter main effect such that the post-contraction changes in %HbO2 (mean 24.6, SD 18.0 %) were larger (p=0.035) than the post-contraction changes in [THb] (mean 12.0, SD 4.7 %). There was also a significant Contraction Duration main effect such that greater relative changes were observed following 8 s contractions (mean 23.4, SD 17.8 %) than following 2 s contractions (mean 13.2, SD 7.8 %) (p=0.047). The Contraction Duration×Blood Parameter interaction was nearly significant (p=0.087), suggesting a tendency for longer contractions to affect %HbO2 more than [THb] (Figure 2A).
Figure-2.
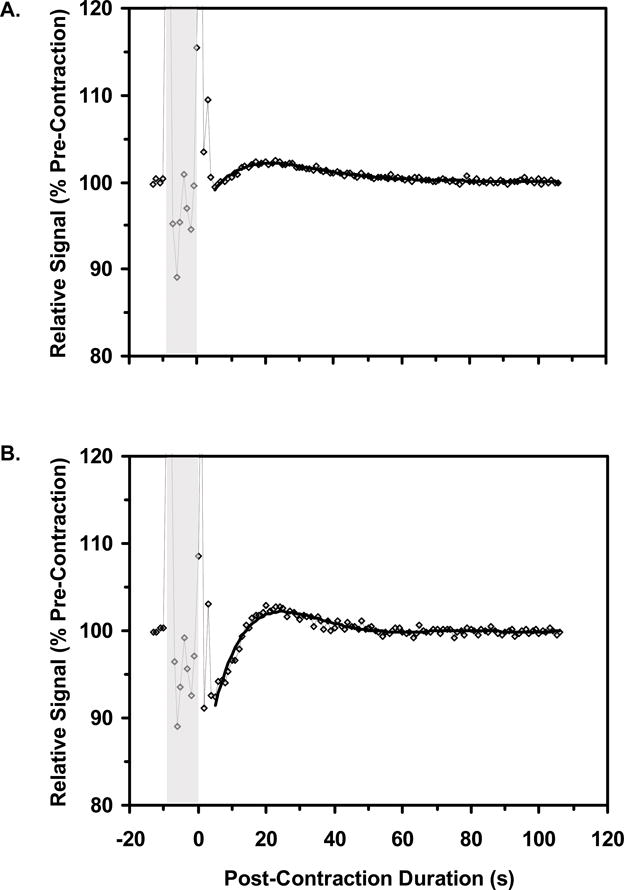
MRI Signal Intensity Data
Typical functional MRI data following an 8 s contraction are shown in Figure 3. Across the TR/α= 500 ms/90°, 1000 ms/90°, and 1000 ms/60° conditions, S6 did not vary significantly (p=0.60). There was a significant main effect for TE such that post-contraction S46 changes (mean 6.2, SD 3.4 %) were greater (p<0.0005) than post-contraction S6 changes (mean 1.2, SD 0.7). There was also a significant main effect for Contraction Duration such that the signal changes were greater following 8 s contractions (mean 5.2, SD 4.1 %) than following 2 s contractions (mean 2.1, SD 2.0 %) (p=0.001). The Contraction Duration×TE interaction was significant (Figure 2B; p=0.001), indicating that the effect of contraction duration was greater for S46 than for S6.
Figure-3.
MRI Relaxation Data and Signal Sensitivity Analysis
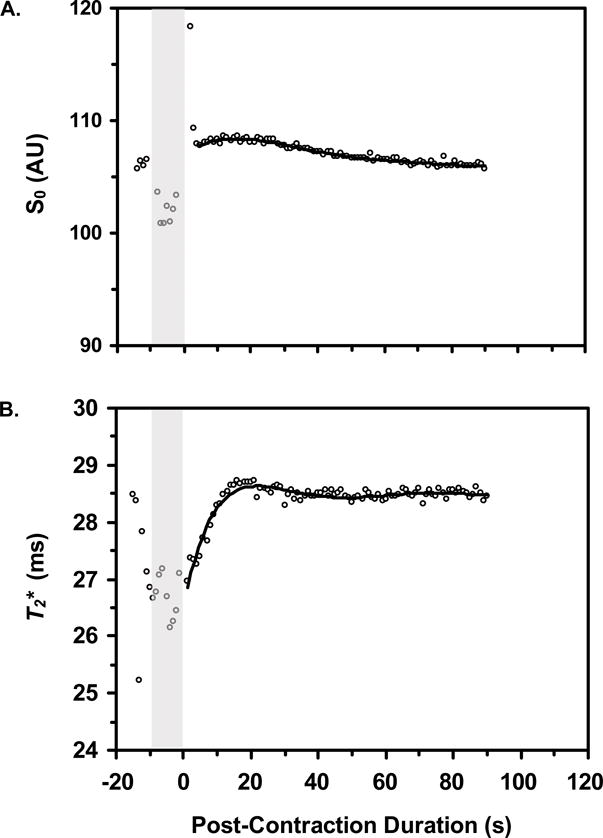
Typical S0 and T2* data following an 8 s contraction are shown in Figure 4. Figure 2C shows the mean S0 and T2* changes following contractions of 2 and 8 s. Prior to the 2 s contractions, the mean S0 and T2* values were 100 (SD 19.51) AU and 27.5 (SD 4.9) ms, respectively. Following the 2 s contractions, S0 had a maximum value of 100.24 (SD 19.03) AU (p=0.022 vs. pre-contraction mean) and a post-contraction range equal to 0.84 (SD 0.89) AU. Following the contraction, T2* increased significantly (p=0.025) to a maximum value of 28.0 (SD 5.3) ms and had a post-contraction range of 0.68 (SD 0.34) ms.
Figure-4.
The mean S0 and T2* values prior to the 8 s contractions were 100 (SD 16.11) AU and 26.8 (SD 4.4) ms, respectively. Following the 8 s contractions, S0 increased significantly (p=0.004) to a maximum value of 100.38 (SD 16.24) AU and had a post-contraction range equal to 0.78 (SD 0.48) AU; T2* increased significantly (p=0.002) to 28.1 (SD 4.8) ms and had a post-contraction range of 1.6 (SD 0.5) ms. The post-contraction S0 changes were similar following 2 and 8 s contractions (p=0.48), but the post-contraction T2* changes were greater following 8 s contractions than following 2 s contractions (p=0.002).
For all values of TE, SP,ρ was 0.6% for both the 2 and 8 s contractions. For 2 s contractions, S6P was 1.0% and S46P was 3.5%. For 8 s contractions, S6P was 1.8 and 7.8%, respectively. Thus for 2 s contractions and a TE of 6 ms, S0 changes were predicted to have been responsible for 61% of the signal change; at a TE of 46 ms, S0 changes were predicted to have created 17% of the signal change. For 8 s contractions and a TE of 6 ms, S0 changes were predicted to have contributed to 38% of the signal change; for TE=46 ms, S0 changes were predicted to have produced 7% of the signal change. Figure 5 shows the predicted relative contributions of S0 changes for all TE values with both contraction durations.
Figure-5.
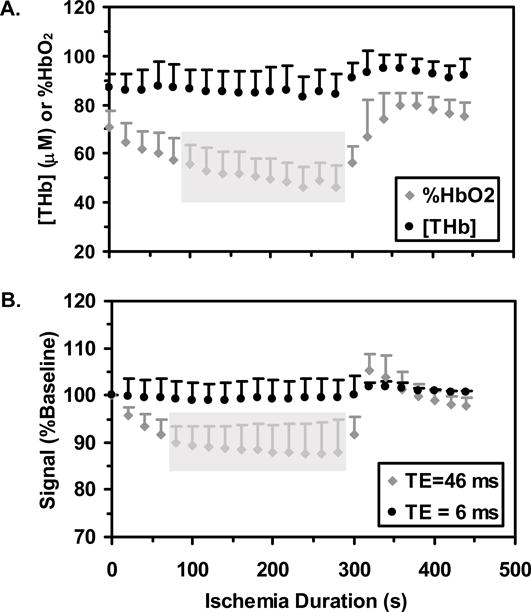
Arterial Occlusion Protocols
Figure 6A shows the responses of [THb] and %HbO2 to the arterial occlusion protocol. [THb] was constant, and %HbO2 significantly declined, during the occlusion. The time range during which %HbO2 differed significantly from the pre-occlusion mean value is indicated by the gray bar (occlusion durations of 100 – 280 s). During the post-occlusion period, there were no significant changes in either [THb] or %HbO2 at the times sampled, but the maximum post-occlusion [THb] and %HbO2 values were significantly greater than the pre-occlusion mean values (p=0.0003 and 0.0008 for [THb] and %HbO2, respectively). Figure 6B shows the responses of S6 and S46 to the arterial occlusion. S6 did not differ from the pre-occlusion mean at any of the times sampled, but S46 decreased significantly at occlusion durations of 80 – 280 s. The maximum post-occlusion values of S6 and S46 were greater than the pre-occlusion mean values (p=0.007 and 0.001 for S6 and S46, respectively).
Figure-6.
Finally, the normalized mean Euclidean distance between S6 and [THb] and between S6 and %HbO2 were 1.87 and 2.90, respectively, indicating greater similarity between the S6 and [THb] data than between S6 and %HbO2 data. The similarities between S46 and [THb] and %HbO2 were 2.40 and 2.11, respectively.
DISCUSSION
In this study, we have observed transient rises in short-TE and long-TE gradient-echo signal intensities following dorsiflexion MVC in healthy humans. These signal transients correspond primarily to changes in blood volume and oxygenation, respectively, as indicated by the characteristics of the MRI parameters employed, the values of physical parameters that directly determine the MRI signal, and the NIRS data obtained in parallel studies. The results of this investigation provide new information about the distinct biological bases of post-contraction MRI signal intensity transients in human skeletal muscle. Use of this novel dual-echo approach, which can be readily implemented on MRI systems with functional imaging capabilities, will allow simultaneous in vivo characterization of skeletal muscle vascular reactivity and oxygen status in a variety of healthy and clinical populations.
Anatomical Features Affecting the NIRS and MRI Data
We consider first the impact of the leg’s anatomical features that could have affected the results. As noted above, NIRS data are strongly influenced by the subcutaneous fat layer thickness (7,8). For our NIRS system, the detector-emitter distances correspond to a light penetration depths ranging from 1.0–1.75 cm. In these subjects the mean subcutaneous fat layer thickness was 0.34 cm (less than the minimum depth sensitivity of the NIRS data) and the TA muscle extended 2.87 cm below the skin (greater than the maximum depth sensitivity of the NIRS data). Therefore the NIRS measurements correspond almost entirely to the TA muscle. Also, the presence of non-contractile tissue such as fat and aponeurosis would tend to blunt the MRI response. We consider that these errors are small, however, because fat signals were suppressed in the echo-planar acquisitions and the aponeurosis area constituted only ~4% of the total muscle area.
Physiological Determinants of Changes in S6
From Eq. 3, the determinants of changes in S6 would include T1, T2*, and S0; we have assumed that within an individual image acquisition, S0 changes are directly proportional to ρ changes and for the remainder of our discussion use the former symbol. If changes in the apparent T1 of the tissue, such as those brought about by inflowing blood (17), were the predominant source of image contrast, then increasing the MSS through variations in TR and α should decrease the relative signal change. The rationale for this statement is that with higher values of MSS, spins in the stationary tissue parenchyma would be more completely relaxed and so inflowing blood would have a smaller relative impact on the signal. Because the signal changes were not different across a nearly two-fold range of MSS values, inflow effects could not have contributed significantly to the signal changes. This conclusion agrees with that of the previous report from Meyer et al (14).
We are thus left with changes in T2* and S0 as the sources of contrast in the short-echo images, with their relative contributions determined by the nature of the physiological intervention. An important conclusion to be drawn here is that during and following arterial occlusion, changes in S6 reflect changes in blood volume. This conclusion is driven by the observation that neither [THb] nor S6 changed significantly during the arterial occlusion period (Figures 6A and B), while the maximum post-occlusion values were significantly elevated over the pre-occlusion values. Finally, the normalized mean Euclidean distance, for which smaller values reflect more similar datasets, was smaller for the S6-[THb] variable pair than for the S6-%HbO2 variable pair. This result indicates that the behaviors of [THb] and S6 during arterial occlusion are more similar to each other than are the behaviors of %HbO2 of S6.
Following MVC, there is evidence that changes in S6 following contraction also tend to reflect changes in blood volume. First, the Contraction Duration×Blood Parameter interaction of the NIRS data (Figure 2A), the Contraction Duration×TE interaction of the MRI data (Figure 2B), and the S0 and T2* data (Figure 2C) revealed similar behaviors – namely, that the post-contraction changes in S0, S6, and [THb] were already maximal or near-maximal following the 2 s MVCs, and did not change appreciably with the longer contractions. However, it is also clear from Figure 5 that the relative contribution of changes in S0 to the post-contraction signal changes depends heavily on the TE and the contraction duration. For the 2 s contraction duration, we would predict that changes in S0 would be the major source of image contrast for values of TE up to ~10 ms. For the 8 s contraction duration, changes in S0 are predicted to be the major source of image contrast for TE values up to ~4 ms.
Finally, we consider the question of what physiological factors cause S0 to increase. The correspondence between the [THb] and S6 data during and after arterial occlusion, and the similar patterns observed in the NIRS and MRI variables in Figure 2, together support the hypothesis that changes in S0 reflect changes in blood volume. Presumably, these changes in blood volume would occur as a result of the actions of local vasodilatory paracrine agents and the refilling of the venous circulation. In a fixed size imaging voxel, blood volume changes would affect the S0 because the blood has a higher water content than muscle (~83% water by weight for blood (18) vs. ~76% for muscle (19)). As a result, the blood perfusing newly recruited capillaries would contribute more signal than the tissue it displaces. A quantitative comparison of the NIRS and MRI data cannot be made, because the NIRS and MRI measurements are sensitive to different ranges of vessel sizes (the MRI data include all unresolved vessels, whereas the NIRS data are restricted to the microcirculation). As a result, blood volume changes in larger venules (~50 μm – ~1 mm diameter) would be included in the MRI data, but not in the NIRS data. Taken together with the results of the arterial occlusion experiments and considering the similar patterns observed in Figure 2, however, the data provide strong qualitative support for the hypothesis that changes in S6 reflect changes in blood volume.
Physiological Determinants of Changes in S46
We now consider those physiological factors contributing to the changes in S46. From the signal equation presented above (Eq. 3), the possibilities include factors acting through changes in S0, T1, and T2*. It has been shown previously (14) and we have also observed here that changes in the apparent T1 of the tissue cannot have contributed substantially to the short-echo signal intensity changes, because the signal changes did not vary over a 1.84-fold variation in MSS. Within an individual tissue water compartment, changes in S0 will bring about similar relative signal intensity changes at all values for TE. By examining the data in Figure 5, we estimate that ~17% of the changes in S46 following 2 s contractions and ~7% of the changes in S46 following 8 s contractions can be attributed to changes in S0. However, it should be cautioned that if in vivo T2* relaxation in skeletal muscle has a multiexponential character (as does T2; see, for example, ref. (20)), then the blood’s longer T2* (relative to muscle parenchyma) implies that the relative contributions of blood volume-mediated changes in S0 will in fact vary non-linearly as a function of TE.
The remaining physiological determinants of changes in S46 are factors affecting T2*. We begin by considering the relation
| [4] |
where T2′ is the time constant describing RF-reversible dephasing and the use of reciprocals indicates the corresponding relaxation rates. The factors contributing to T2 changes in the muscle parenchyma include increases in intracellular free water content, brought about by factors such as osmotic (21,22) and hydrostatic pressure gradients, and intracellular acidification (21,23). For contractions of the durations used in the present study, the creatine kinase reaction would be both the major source of ATP synthesis (24) and the major determinant of a possible intracellular T2 change. The osmotic and alkalotic effects of increased flux through this reaction on the T2 tend to oppose each other. Further, any net increase in the intracellular T2 would be small and resolve along similar time courses to the pH and phosphocreatine recoveries. For the brief contractions used here, both the pH and phosphocreatine recoveries would be far more rapid (24) than are the time courses of the observed MRI signal transients. Therefore, it appears highly unlikely that metabolically-driven increases in the intracellular T2 contribute significantly to the post-contraction signal transients.
Finally, we consider factors affecting the T2′. As stated above, our working hypothesis is that such factors act via the BOLD response. The arguments that we make below rely primarily on the similarity of the T2*, S46, and %HbO2 responses, and require the assumptions that hemoglobin affects 1) skeletal muscle NIRS signals and 2) the existence of microscopic magnetic susceptibility gradients much more strongly than do other heme-containing molecules, such as myoglobin (Mb). With regard to the assumption that NIRS signals depend mainly on hemoglobin, this is supported by Seiyama et al.’s study of the perfused rat hindlimb preparation (25), which is applicable to human muscle because of the similar Mb concentrations in human and rat muscles (26–29). Because Seiyama et al. found that more than 90% of the NIRS signal was eliminated when the perfusate was changed from blood to a fluorocarbon (25), this implies that the contribution of Hb to the NIRS signal from skeletal muscle is much greater than the Mb concentration. Oxy-Mb saturation (%MbO2) is greater than 90% at rest (30) and does decrease during prolonged arterial occlusion (31). As discussed above, the impact of this desaturation on the NIRS observations would be small. Also, Lebon et al. (31) have shown that the time course of T2* changes during arterial occlusion corresponds better to a calculated time course of Hb desaturation than to the observed time course of Mb desaturation. Thus, we conclude that both the NIRS data and relaxation time changes that we observed would have reflected changes in Hb, not Mb.
Such factors could act via intra- or extravascular BOLD effects. The intravascular BOLD effect refers to the effects of hematocrit and %HbO2 on the transverse relaxation of the blood itself (32,33). The effects of changes in these parameters on the relaxation of the whole tissue will be roughly proportional to the relative blood volume. The extravascular BOLD effect refers to the net effect of hematocrit, capillary orientation and radius, blood oxygenation, relative blood volume, and the water diffusion coefficient on the transverse relaxation of extravascular spins (34). Under our experimental conditions and for data acquired at the same location within an individual subject, changes in blood volume and oxygenation would again have the most impact on the T2′.
The data from both the arterial occlusion and contraction studies are consistent with the dependence of S46 on blood volume and oxygenation changes just proposed. In the arterial occlusion studies, we observed that the times at which %HbO2 and S46 differed significantly from the pre-occlusion values were nearly identical. Also, the distance measures indicated more similarity between %HbO2 and S46 than between %HbO2 and S6. As discussed above, the Contraction Duration×Blood Parameter interaction of the NIRS data (Figure 2A), the Contraction Duration×TE interaction of the MRI data (Figure 2B), and the post-contraction T2* changes (Figure 2C) all revealed similar behaviors. In this case, the post-contraction changes in %HbO2, S46, and T2* were considerably greater following the 8 s MVCs than following the 2 s MVCs. Assuming transient occlusion of the vasculature during each MVC (3,5,16), the greater change in %HbO2 values following 8 s contractions than following 2 s contractions presumably reflects greater oxygen utilization during and following the 8 s contractions (because of the higher ATP cost of the contraction in the face of a similarly restricted oxygen supply). The similarities in the MRI-NIRS data are correlative in nature and do not exclude the possibility that other physiological variables contributed to the T2′ change, but are both necessary to support the hypothesis that changes in S46 reflect changes in %HbO2.
Summary and Conclusions
We have presented a dual gradient-echo MRI method suitable for studying vascular and metabolic responses to brief isometric contractions in vivo. Assuming a constant hematocrit, the changes in short-TE signals reflect primarily changes in blood volume, while changes in long-TE signals reflect changes in both blood volume and blood oxygenation. The relative contributions of these two determinants of the signal changes depend on contraction duration, with a greater relative contribution from oxygenation changes following longer contractions. These interpretations are consistent with the standard understanding of how changes in S0 and T2* affect the contrast properties of MR images. Moreover, the dual-echo approach allows parametric mapping of fundamental determinants of the MR signal (S0 and T2*), and by measuring these parameters lessens any uncertainty concerning the relative contributions blood volume and oxygenation changes. The utility and relative ease afforded by this non-invasive MRI technique make it an attractive tool for the study of post-contraction muscle blood volume and oxygenation changes in studies of basic human physiology, as well as for applications to conditions in which vascular reactivity is impaired.
Acknowledgments
We thank Robin Avison, RTR(MR,N), CNMT and Donna Butler, RTR(MR) for their assistance with data collection and the reviewers for helpful comments.
Grant Support: NIH/NIA R01 AG021094 (JKB)
References
- 1.Laughlin MH, Korthuis RJ, Duncker DJ, Bache RJ. Control of blood flow to cardiac and skeletal muscle during exercise. In: Rowell LB, S JT, editors. Handbook of Physiology Exercise: Regulation and Integration of Multiple Systems. Vol. 12. Bethesda, MD: American Physiological Society; 1996. pp. 705–769. [Google Scholar]
- 2.Kindig CA, Sexton WL, Fedde MR, Poole DC. Skeletal muscle microcirculatory structure and hemodynamics in diabetes. Respir Physiol. 1998;111(2):163–175. doi: 10.1016/s0034-5687(97)00122-9. [DOI] [PubMed] [Google Scholar]
- 3.Gray SD, Carlsson E, Staub NC. Site of increased vascular resistance during isometric muscle contraction. Am J Physiol. 1967;213(3):683–689. doi: 10.1152/ajplegacy.1967.213.3.683. [DOI] [PubMed] [Google Scholar]
- 4.Tschakovsky ME, Rogers AM, Pyke KE, Saunders NR, Glenn N, Lee SJ, Weissgerber T, Dwyer EM. Immediate exercise hyperemia in humans is contraction intensity dependent: evidence for rapid vasodilation. J Appl Physiol. 2004;96(2):639–644. doi: 10.1152/japplphysiol.00769.2003. [DOI] [PubMed] [Google Scholar]
- 5.Gray SD, Staub NC. Resistance to blood flow in leg muscles of dog during tetanic isometric contraction. Am J Physiol. 1967;213(3):677–682. doi: 10.1152/ajplegacy.1967.213.3.677. [DOI] [PubMed] [Google Scholar]
- 6.Wigmore DM, Propert K, Kent-Braun JA. Blood flow does not limit skeletal muscle force production during incremental isometric contractions. Eur J Appl Physiol. 2006;96(4):370–378. doi: 10.1007/s00421-005-0037-0. [DOI] [PubMed] [Google Scholar]
- 7.van Beekvelt MC, Borghuis MS, van Engelen BG, Wevers RA, Colier WN. Adipose tissue thickness affects in vivo quantitative near-IR spectroscopy in human skeletal muscle. Clin Sci (Lond) 2001;101(1):21–28. doi: 10.1042/cs20000247. [DOI] [PubMed] [Google Scholar]
- 8.Maguire MA, Weaver TW, Damon BM. Delayed blood reoxygenation following maximum voluntary contraction Medicine and Science in Sports and Exercise. 2006 doi: 10.1249/01.mss.0000246990.25858.47. in press. [DOI] [PubMed] [Google Scholar]
- 9.Cui W, Kumar C, Chance B. Experimental study of migration depth for the photons measured at sample surface. In: Chance B, editor. Time-Resolved Spectroscopy and Imaging of Tissues. Vol. 1431. Bellingham, WA: Society of Photo-optical Instrumentation Engineers; 1991. pp. 180–191. [Google Scholar]
- 10.Kalliokoski KK, Kemppainen J, Larmola K, Takala TO, Peltoniemi P, Oksanen A, Ruotsalainen U, Cobelli C, Knuuti J, Nuutila P. Muscle blood flow and flow heterogeneity during exercise studied with positron emission tomography in humans. Eur J Appl Physiol. 2000;83(4–5):395–401. doi: 10.1007/s004210000267. [DOI] [PubMed] [Google Scholar]
- 11.Kalliokoski KK, Kuusela TA, Nuutila P, Tolvanen T, Oikonen V, Teras M, Takala TE, Knuuti J. Perfusion heterogeneity in human skeletal muscle: fractal analysis of PET data. Eur J Nucl Med. 2001;28(4):450–456. doi: 10.1007/s002590000458. [DOI] [PubMed] [Google Scholar]
- 12.Kalliokoski KK, Laaksonen MS, Takala TO, Knuuti J, Nuutila P. Muscle oxygen extraction and perfusion heterogeneity during continuous and intermittent static exercise. J Appl Physiol. 2003;94(3):953–958. doi: 10.1152/japplphysiol.00731.2002. [DOI] [PubMed] [Google Scholar]
- 13.Wolf U, Wolf M, Choi JH, Levi M, Choudhury D, Hull S, Coussirat D, Paunescu LA, Safonova LP, Michalos A, Mantulin WW, Gratton E. Localized irregularities in hemoglobin flow and oxygenation in calf muscle in patients with peripheral vascular disease detected with near-infrared spectrophotometry. J Vasc Surg. 2003;37(5):1017–1026. doi: 10.1067/mva.2003.214. [DOI] [PubMed] [Google Scholar]
- 14.Meyer RA, Towse TF, Reid RW, Jayaraman RC, Wiseman RW, McCully KK. BOLD MRI mapping of transient hyperemia in skeletal muscle after single contractions. NMR Biomed. 2004;17(6):392–398. doi: 10.1002/nbm.893. [DOI] [PubMed] [Google Scholar]
- 15.Towse TF, Slade JM, Meyer RA. Effect of physical activity on MRI-measured blood oxygen level-dependent transients in skeletal muscle after brief contractions. J Appl Physiol. 2005;99(2):715–722. doi: 10.1152/japplphysiol.00272.2005. [DOI] [PMC free article] [PubMed] [Google Scholar]
- 16.Wigmore DM, Damon BM, Pober DM, Kent-Braun JA. MRI measures of perfusion-related changes in human skeletal muscle during progressive contractions. J Appl Physiol. 2004;97(6):2385–2394. doi: 10.1152/japplphysiol.01390.2003. [DOI] [PubMed] [Google Scholar]
- 17.Toussaint JF, Kwong KK, Mkparu FO, Weisskoff RM, LaRaia PJ, Kantor HL. Perfusion changes in human skeletal muscle during reactive hyperemia measured by echo-planar imaging. Magn Reson Med. 1996;35(1):62–69. doi: 10.1002/mrm.1910350109. [DOI] [PubMed] [Google Scholar]
- 18.Rogers FT, Lackey RW. The variations of the water content of the blood induced by atmospheric temperature changes in normal and splenectomized animals. Am J Physiology. 1928;86:36–38. [Google Scholar]
- 19.Flear CT, Carpenter RG, Florence I. Variability in the water, sodium, potassium, and chloride content of human skeletal muscle. J Clin Pathol. 1965;18:74–81. doi: 10.1136/jcp.18.1.74. [DOI] [PMC free article] [PubMed] [Google Scholar]
- 20.Saab G, Thompson RT, Marsh GD. Multicomponent T2 relaxation of in vivo skeletal muscle. Magn Reson Med. 1999;42(1):150–157. doi: 10.1002/(sici)1522-2594(199907)42:1<150::aid-mrm20>3.0.co;2-5. [DOI] [PubMed] [Google Scholar]
- 21.Damon BM, Gregory CD, Hall KL, Stark HJ, Gulani V, Dawson MJ. Intracellular acidification and volume increases explain R2 decreases in exercising muscle. Magn Reson Med. 2002;47(1):14–23. doi: 10.1002/mrm.10043. [DOI] [PubMed] [Google Scholar]
- 22.Prior BM, Ploutz-Snyder LL, Cooper TG, Meyer RA. Fiber type and metabolic dependence of T2 increases in stimulated rat muscles. J Appl Physiol. 2001;90(2):615–623. doi: 10.1152/jappl.2001.90.2.615. [DOI] [PubMed] [Google Scholar]
- 23.Fung BM, Puon PS. Nuclear magnetic resonance transverse relaxation in muscle water. Biophys J. 1981;33(1):27–37. doi: 10.1016/S0006-3495(81)84870-9. [DOI] [PMC free article] [PubMed] [Google Scholar]
- 24.Lanza IR, Befroy DE, Kent-Braun JA. Age-related changes in ATP-producing pathways in human skeletal muscle in vivo. J Appl Physiol. 2005;99(5):1736–1744. doi: 10.1152/japplphysiol.00566.2005. [DOI] [PubMed] [Google Scholar]
- 25.Seiyama A, Hazeki O, Tamura M. Noninvasive quantitative analysis of blood oxygenation in rat skeletal muscle. J Biochem (Tokyo) 1988;103(3):419–424. doi: 10.1093/oxfordjournals.jbchem.a122285. [DOI] [PubMed] [Google Scholar]
- 26.Nemeth PM, Lowry OH. Myoglobin levels in individual human skeletal muscle fibers of different types. J Histochem Cytochem. 1984;32(11):1211–1216. doi: 10.1177/32.11.6491255. [DOI] [PubMed] [Google Scholar]
- 27.Harms SJ, Hickson RC. Skeletal muscle mitochondria and myoglobin, endurance, and intensity of training. J Appl Physiol. 1983;54(3):798–802. doi: 10.1152/jappl.1983.54.3.798. [DOI] [PubMed] [Google Scholar]
- 28.Hickson RC. Skeletal muscle cytochrome c and myoglobin, endurance, and frequency of training. J Appl Physiol. 1981;51(3):746–749. doi: 10.1152/jappl.1981.51.3.746. [DOI] [PubMed] [Google Scholar]
- 29.Masuda K, Choi JY, Shimojo H, Katsuta S. Maintenance of myoglobin concentration in human skeletal muscle after heavy resistance training. Eur J Appl Physiol Occup Physiol. 1999;79(4):347–352. doi: 10.1007/s004210050519. [DOI] [PubMed] [Google Scholar]
- 30.Richardson RS, Duteil S, Wary C, Wray DW, Hoff J, Carlier PG. Human skeletal muscle intracellular oxygenation: the impact of ambient oxygen availability. J Physiol (Lond) 2006;571(2):415–424. doi: 10.1113/jphysiol.2005.102327. [DOI] [PMC free article] [PubMed] [Google Scholar]
- 31.Lebon V, Brillault-Salvat C, Bloch G, Leroy-Willig A, Carlier PG. Evidence of muscle BOLD effect revealed by simultaneous interleaved gradient-echo NMRI and myoglobin NMRS during leg ischemia. Magn Reson Med. 1998;40(4):551–558. doi: 10.1002/mrm.1910400408. [DOI] [PubMed] [Google Scholar]
- 32.Spees WM, Yablonskiy DA, Oswood MC, Ackerman JJ. Water proton MR properties of human blood at 1.5 Tesla: magnetic susceptibility, T1, T2, T2*, and non-Lorentzian signal behavior. Magn Reson Med. 2001;45(4):533–542. doi: 10.1002/mrm.1072. [DOI] [PubMed] [Google Scholar]
- 33.Thulborn KR, Waterton JC, Matthews PM, Radda GK. Oxygenation dependence of the transverse relaxation time of water protons in whole blood at high field. Biochim Biophys Acta. 1982;714(2):265–270. doi: 10.1016/0304-4165(82)90333-6. [DOI] [PubMed] [Google Scholar]
- 34.Stables LA, Kennan RP, Gore JC. Asymmetric spin-echo imaging of magnetically inhomogeneous systems: theory, experiment, and numerical studies. Magn Reson Med. 1998;40(3):432–442. doi: 10.1002/mrm.1910400314. [DOI] [PubMed] [Google Scholar]