Abstract
A full-wave equation that describes nonlinear propagation in a heterogeneous attenuating medium is solved numerically with finite differences in the time domain (FDTD). Three-dimensional solutions of the equation are verified with water tank measurements of a commercial diagnostic ultrasound transducer and are shown to be in excellent agreement in terms of the fundamental and harmonic acoustic fields and the power spectrum at the focus. The linear and nonlinear components of the algorithm are also verified independently. In the linear nonattenuating regime solutions match results from Field II, a well established software package used in transducer modeling, to within 0.3 dB. Nonlinear plane wave propagation is shown to closely match results from the Galerkin method up to 4 times the fundamental frequency. In addition to thermoviscous attenuation we present a numerical solution of the relaxation attenuation laws that allows modeling of arbitrary frequency dependent attenuation, such as that observed in tissue. A perfectly matched layer (PML) is implemented at the boundaries with a numerical implementation that allows the PML to be used with high-order discretizations. A −78 dB reduction in the reflected amplitude is demonstrated. The numerical algorithm is used to simulate a diagnostic ultrasound pulse propagating through a histologically measured representation of human abdominal wall with spatial variation in the speed of sound, attenuation, nonlinearity, and density. An ultrasound image is created in silico using the same physical and algorithmic process used in an ultrasound scanner: a series of pulses are transmitted through heterogeneous scattering tissue and the received echoes are used in a delay-and-sum beam-forming algorithm to generate a images. The resulting harmonic image exhibits characteristic improvement in lesion boundary definition and contrast when compared with the fundamental image. We demonstrate a mechanism of harmonic image quality improvement by showing that the harmonic point spread function is less sensitive to reverberation clutter.
I. Introduction
Characterization of acoustic waves that propagate nonlinearly in an inhomogeneous medium has important applications in diagnostic and therapeutic ultrasound. The heterogeneous composition of tissue distorts the phase and generates unwanted reverberation of an ultrasonic signal, resulting in the degradation of the lateral resolution and contrast of an ultrasonic scanner. The nonlinearity of wave propagation is used to the advantage of diagnostic scanners that employ the harmonic components of the ultrasonic signal to improve the resolution and penetration of clinical scanners [1]–[3]. Harmonic imaging has been shown to have an important effect in reducing phase aberration and clutter [4]–[6].
Several equations and numerical methods that address nonlinear propagation, heterogeneous media, or multiple scattering have been proposed. Ultrasonic propagation through fine-scale heterogeneities has been simulated with a finite difference time domain (FDTD) solution of the 3-D linear wave equation [7,] [8] or a k-space method [9]. This numerical implementation models the fine structure of human tissue and the arrangement of tissue in the human body. The full-wave equation accounts for multiple reflections and scattering but current numerical implementations lack the ability to simulate nonlinear propagation and attenuation.
The Khokhlov-Zabolotskaya-Kuznetsov (KZK) equation or nonlinear one-way parabolic wave equation accounts for nonlinearity, attenuation, and diffraction within a paraxial approximation [10], [11]. It has been solved in the time and frequency domains [12]–[14]; however, the parabolic wave equation assumes that field variations transverse to the direction of propagation are slow compared with axial variations and the paraxial approximation limits the equation’s validity to about 15° from the axis of propagation [15]. Additionally, this one-way wave equation does not model reflections, scattering, and heterogeneities.
The nonlinear full-wave equation describes acoustic fields in a nonlinear thermoviscous medium [16], [17]. It has the advantages of both the 3-dimensional linear wave equation and the nonlinear parabolic wave equation by incorporating nonlinearity, attenuation, and all wave effects, such as multiple scattering, reflection, and refraction. It is not limited by a paraxial approximation so it accurately describes an ultrasonic beam in the off-axis region and is valid for arbitrary scatterers in the field. An axisymmetric version of this equation has been solved numerically in the context of heat deposition [18].
Here we propose a 3-dimensional numerical solution to a nonlinear full-wave equation that additionally describes arbitrary frequency dependent attenuation and variations in density. As the accuracy of simulations improves it becomes increasingly important to include higher order effects. We present the first numerical method that comprehensively describes 3-dimensional nonlinear wave propagation in heterogeneous media with arbitrary attenuation law. This paper also describes the implementation of perfectly matched layers (PML) at the boundaries to reduce reflections to negligible levels. It is shown that the FDTD method can accurately represent nonlinear ultrasonic propagation from a diagnostic transducer and that it can simulate heterogeneities in speed of sound, attenuation, nonlinearity, and density.
The perfectly matched layer (PML) was introduced by Berenger in the context of electromagnetic waves to provide absorption under a broad variety of conditions [19] and has also been used in the context of the paraxial wave equation [20]. In the continuous limit, it has been shown that the PML interface between the regular medium and the PML completely absorbs the incident wave independently of incidence angle and frequency. Various other methods have been proposed too but they are successful only for a limited range of frequencies and angles of incidence. The PML technique has been previously adapted for acoustics [21], [22] but the methods use low-order discretizations for their finite differences. In this paper we introduce a new acoustic PML method for higher order finite differences.
The incorporation of arbitrary frequency dependent absorption laws is straightforward in frequency domain methods. However, it can be numerically challenging for time-domain methods to solve the equivalent convolution [23]. In this paper, in addition to thermoviscous attenuation, which is only valid for fluids, we use relaxation mechanisms to model arbitrary attenuation, such as the power laws observed in tissue. The numerical methods are based on research in seismic wave fields [24] but are adapted for the high-order spatial discretizations used here.
Numerical solutions of the full-wave equation are extensively validated. In the linear nonattenuating regime results are compared with Field II, a well accepted standard for transducer modeling [25], [26]. Nonlinearity is verified by comparing the distortion of a plane wave with solutions of a frequency domain Galerkin method. Water tank measurements of a commercial ultrasonic transducer are used to validate the combined effects of diffraction, nonlinearity, and attenuation in the simulation results for fundamental and harmonic components of the acoustic field. Once the validation of the method is established the simulation is used to propagate diagnostic ultrasound pulses through an experimentally determined representation of an abdominal layer. Multiple pulses are used to compose a harmonic and fundamental ultrasound image using the same process that a diagnostic scanner employs. The pulses propagate, aberrate through the abdominal layer, reflect, scatter, and part of the transmitted energy returns to the transducer face where it is beamformed into an image. Unlike other simulations that use nonlinear propagation to create ultrasound images [27], this simulation, in addition to including the effects of inhomogeneities and multiple scattering, does not require any linear convolution assumptions of the point-spread function. Finally we examine the effects of clutter on the point-spread function and show that one of the primary mechanisms of image degradation in fundamental imaging, compared with harmonic imaging, is the presence of near-field reverberation at the fundamental frequencies.
II. Methods
A. Acoustic Equation
The nonlinear full-wave equation used in this paper is a second-order wave equation that describes a nonlinear wave propagating in an attenuating medium [17], [28].
| (1) |
where ξm satisfies the equation
| (2) |
The first 2 terms in (1) represent the linear wave equation, the third term accounts for thermoviscous diffusivity, followed by nonlinearity, variations in density, and v relaxation mechanisms. Here p is the acoustic pressure, c0 and ρ are the equilibrium speed of sound and density, δ is the acoustic diffusivity, and β is the nonlinearity parameter. The nonlinear parameter B/A is related to the coefficient, β, by β = 1 + B/2A and the diffusivity δ can be expressed as a function of the absorption coefficient α with the equation (where ω is the angular frequency). The material parameters c0, δ, ρ, and β can be functions of space. The relaxation equation (2) has υ peaks at characteristic frequencies ωm with weight αm that depend on the particular frequency dependent attenuation law that is being modeled. The change in speed of sound Δc must obey the Kramers-Kronig relation to preserve causality.
B. Diffraction
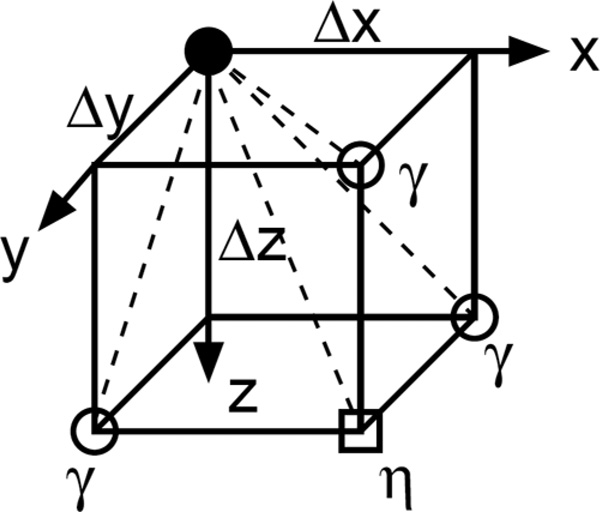
Explicit finite differences in the time domain are used to discretize the nonlinear full-wave equation on a 3-dimensional Cartesian grid. The 3-dimensional linear wave equation is modeled with a rotated stencil in Cartesian coordinates. Fourth-order spatial derivatives were used to minimize the effects of numerical dispersion and reduce the requirements for grid refinement. Higher order discretizations that operate only in the Cartesian directions tend to have unwanted directionality—the wave propagates at different speeds along the direction of discretization compared with directions that are at an angle [29]. This type of error has particular significance for correct focusing and spherical propagation from point scatterers. To minimize this effect, the spatial discretization used here has 2 rotated stencils in addition to the conventional Cartesian stencil. The total star-shaped stencil for the spatial derivatives is shown below.
| (3) |
where θ, φ, ψ have the possible values −1, 0, 1, and γ and η are arbitrary weighting coefficients with γ + η ≤ 1, γ ≥ 0, and η ≥ 0, and, for this equation only, δ is the Kronecker delta function rather than the diffusivity. The coefficients γ and η are not equal because they represent different grid spacing lengths compared with the central point in the stencil.
If γ = η = 0 the stencil operates along the conventional Cartesian directions. Fig. 1 shows the directions along which the γ and η stencils operate in the positive quadrant.
Fig. 1.
Directions of the stencil for the linear wave equation in the positive quadrant.
C. Temporal Terms and Density
The linear temporal derivatives are approximated by second-order finite differences:
| (4) |
| (5) |
The nonlinear term was rewritten as
| (6) |
so the equation can be solved for pn+1 directly. Even though a higher order discretization could have been used, this discretization was found to be sufficiently accurate for the weak nonlinearity (i.e., without shocks) normally encountered in ultrasound imaging.
The spatial derivatives in the density term are modeled with a standard fourth-order approximation, but because only a first-order derivative is being calculated the total width of the spatial stencil remains unchanged. Preserving the stencil width reduces the communication time required by the domain decomposition in the parallelized code, as described in further detail in the discussion. The discretization is shown here for the ρ derivative in the x-axis:
| (7) |
D. Relaxation Mechanisms
The v relaxation mechanisms describe the following frequency dependent attenuation:
| (8) |
where
| (9) |
Each relaxation mechanism has an associated characteristic frequency ωm and a fractional change in speed of sound associated with the parameter ym. If we assume that Δc = c0, then (8) can be approximated by
| (10) |
To fit the relaxation mechanisms to an arbitrary frequency-dependent attenuation law the characteristic frequencies ωm are chosen. Then certain discrete frequencies are chosen across a frequency range of interest. Due to the linearity of (10) with respect to ym these weights can be determined with a straightforward minimization of the mean of the square error between the relaxation mechanisms and the attenuation law. This approach requires selecting characteristic frequencies. A more accurate, and more complex, alternative to this procedure requires the use of a nonlinear minimization routine to explore the parameter space given by both ωm and ym and then determine their optimal values. As subsequent results will show, the former method provides sufficient accuracy for the purpose of this paper.
Once the relaxation parameters are established, finite differences are used to discretize (2). A second order in time and fourth order in space discretization is used:
| (11) |
with
| (12) |
and
| (13) |
The finite difference scheme for the relaxation attenuation is then
| (14) |
and
| (15) |
where Ci,j,k represents the spatial discretization of ∇2p described in (3).
E. Perfectly Matched Layer
The perfectly matched layer boundary condition is applied to the linear wave equation
| (16) |
Each of the 6 orientations in the stencil described by (3) must be solved separately and have their own independent calculations. This adds considerable complexity to the code, and practically, only the 3 conventional Cartesian orientations need to be used to obtain a satisfactory absorbing boundary layer, as is demonstrated in subsequent results. In the interest of notational simplicity, we describe here the solution in the z coordinate using the stretched coordinate approach proposed in Chew and Weedon [30]. The wave equation can then be written in time-harmonic form with the complex-coordinate stretched space
| (17) |
where the z coordinate is stretched by
| (18) |
Eq. (17) can be written in the time domain with the aid of the auxilliary variables D1 and D2:
| (19) |
| (20) |
Then the scalar wave equation can be written as
| (21) |
| (22) |
| (23) |
These equations can be discretized by deconvolving the second-order derivative so that 2 applications of the first derivative match the second derivative coefficients: [b−1;, b0, b1] * [b−1, b0, b1] = [−1, 16, −30, 16, −1]/12. Then
| (24) |
| (25) |
where to double floating point precision
| (26) |
In (25) note the minus sign in b−m to preserve the convolution ordering. The PML is sensitive to small variations and the numerical derivatives in the limiting case of σz = 0 must match the derivatives in the nonabsorbing region. The field parameters D1 and D2 do not have a particular physical meaning and are only used for their numerical convenience. The diffraction term in (16) can then be discretized as
| (27) |
The conductivity profile of the PML is given by
| (28) |
where d is the thickness of the PML, m is the order, and R0 is the reflection of the PML at normal incidence. These parameters are optimized with respect to the number of matching layers and the frequency of the incident wave.
F. Hydrophone Measurements
Prior to making measurements, a membrane hydrophone (Onda Corp, Sunnyvale, CA) was placed in deionized water for 30 min. A Siemens Antares ultrasound scanner (Siemens Medical Solutions USA, Inc., Issaquah, WA) was then set up to repeatedly fire the center beam of a VF10–5 transducer (Siemens Medical Solutions USA, Inc., Issaquah, WA) at about 100 Hz PRF using a 2-cycle apodized pulse at 7% of its maximum power. The center of the hydrophone was placed at the 20 mm focus of the transducer. A 2-dimensional acquisition was performed with a Newport MM3000 (Newport Corporation, Irvine, CA) translation stage to move the transducer in increments of 0.1 mm laterally and in elevation. The translation stage has a precision of 0.1 µm. A 5 mm-by-5 mm grid was recorded, with 5 waveforms being acquired at each spatial location using a trigger from the ultrasound scanner. Once this acquisition was completed, the transducer was lowered 16.5 mm and another 2-dimensional acquisition with a fixed axial position (10 mm by 10 mm) was performed with the same parameters. Voltage was converted to pressure according to the conversion factor provided by the manufacturer’s frequency-based calibration.
Basic filtering and averaging were used to remove noise from the data. A 0.3-mm spatial low-pass filter was used in the lateral-elevation plane before averaging the 5 independent acquisitions. Additionally, the initial condition data obtained from the transducer face was band-pass filtered with a 200% bandwidth Gaussian filter centered at the transducer’s 6.67 MHz pulse frequency.
G. Field II
The linear nonattenuating algorithm, i.e., the algorithm with the nonlinearity and attenuation terms set to zero, was compared with an equivalent Field II [26] simulation for a commercial linear transducer. Field II solves the wave equation with the Tupholme-Stepanishen method for calculating linear pulsed ultrasound fields in a homogeneous medium [31]–[33]. It has been widely validated and is commonly used to model transducers.
The transducer modeled in the Field II simulations is consistent with linear transducers made commercially. The array had an elevation focus of 2 cm, a lateral focus of 2.4 cm, an F/# of 1.5, and a center frequency of 4.2 MHz. The transducer was modeled to match the proposed algorithm, meaning the kerf was set to zero and an element size of 20 µm by 20 µm was used to model an active aperture size of 16 mm by 5 mm. The number of mathematical elements used for each 20 µm by 20 µm was set to 1. The soft baffle boundary condition, in which the acoustical potential is fixed at zero, was used in the Field II simulation, and a parabolically focused profile was used in both the lateral and elevation dimensions,
| (29) |
where p0 is the pressure amplitude, dx is the lateral focus, dy is the elevation focus and f is the impulse function:
| (30) |
Here the number of cycles n was set to 1.667 so that the fractional bandwidth was approximately 0.6, and the exponential drop-off parameter m was 2.
In addition, the angular response of the transducer elements was negated by applying an apodization of
| (31) |
| (32) |
in the lateral and elevation dimensions. The element width is given by ax. The proposed algorithm does not apply an angular weight to the transducer elements. A sampling frequency of 160 MHz was used in the Field II simulation.
III. Results
A. Stencil Parameters
The stencil parameters γ and η, were calculated by comparing the linear inviscid part of the algorithm (β = δ = 0) to the analytic solution for an oscillating point source in a homogeneous medium [34]. A 2 MHz oscillator was placed in the center of a 1.5 cm × 1.5 cm × 1.5 cm grid with Δx = Δy = Δz = 18 µm and the time step was set to 2.3 ns. Unless otherwise specified these grid parameters are used in the remainder of the simulations as well. The material parameters are c0 = 1540 m/s and ρ = 1000 kg/ m3. To avoid edge effects, the spherical wave was allowed to propagate until it just reached the boundaries; then the stencil parameters were varied until the L2 numerical error was minimized. These were found to be γ = 0.025 and η = 0.005 and these values are used in the remainder of this paper.
B. Relaxation Mechanisms
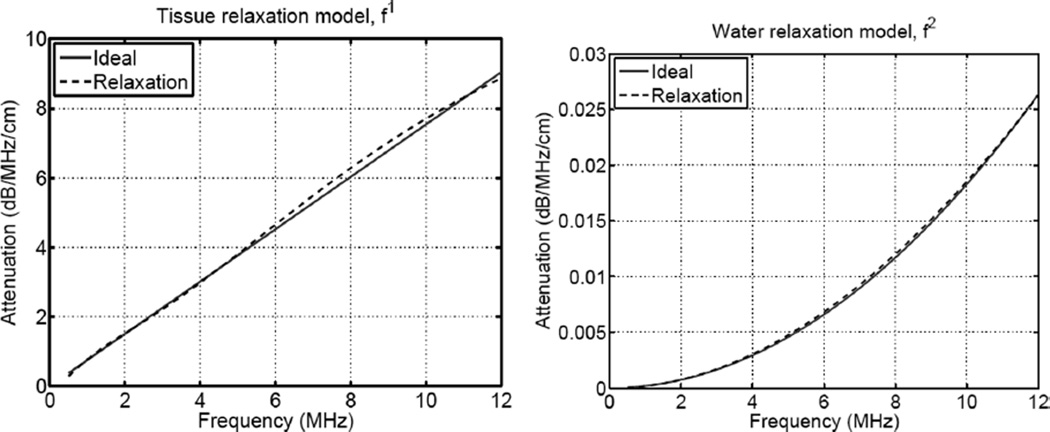
The relaxation parameters were calculated using a 2 parameter model for attenuation laws in tissue and water. In tissue the attenuation was modeled with an f1 frequency dependence and an attenuation of 0.7 dB/MHz/cm. In water the frequency dependence is f2 with an attenuation of 1.7000e-04 dB/cm at 0.5 MHz. The parameters were calculated by minimizing the error for a frequency range between 0.5 and 12 MHz using the approximation that Δc = c0, as described previously. The plots in Fig. 2 show the ideal attenuation law and the fitted relaxation mechanism for tissue (on the left) and water (on the right). Two parameters q = 2 were sufficient to obtain an excellent fit with the relaxation models across the wide frequency band. Table I shows the relaxation parameters used to fit the relaxation models to the attenuation laws.
Fig. 2.
Relaxation model for frequency dependent attenuation laws in tissue (left) and water (right). A 2 parameter model is sufficient to closely fit the attenuation laws across a wide frequency range.
Table I.
Relaxation Parameters.
| y1 | ω1 (rad/s) | y2 | ω2 (rad/s) | |
|---|---|---|---|---|
| Tissue | 0.00337039 | 2π · le6 | 0.0033757 | 2π · 10e6 |
| Water | 2.5312e–5 | 2π · 0.1e6 | −0.08215e–5 | 2π · 50e6 |
C. Perfectly Matched Layers
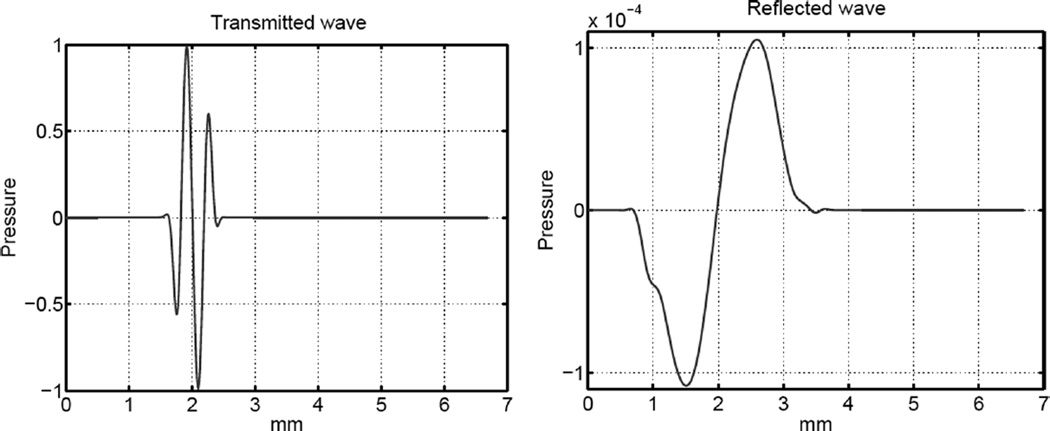
The conductivity profile of the PML was optimized for 40 and 100 matching layers for a 2.4 MHz center frequency, as shown in Table II. A planar ultrasonic pulse was transmitted through a homogeneous nonattenuating medium at a normal angle to the absorbing layer and the amplitude of the reflected wave was measured. Fig. 3 shows the incident (left) and reflected (right) pulses for an absorbing boundary layer with 100 layers or a thickness of 1.25 mm. Even though the layer is thin, the amplitude of the reflected pulse is reduced by close to 4 orders of magnitude. A 0.5 mm layer reduces the reflected energy by over 3 orders of magnitude. Much like a physical absorbing layer, the reflected wave has a lower frequency content, indicating that a further measured reduction of the energy would occur when it is filtered through the pass-band of an ultrasonic transducer. In the subsequent simulations the 40-layer boundary condition is used at the sides of the domain, which is reached by the diffracted edges of an ultrasound pulse, and 100 layers are used at the bottom surface, where the more intense pulse center is absorbed.
Table II.
Conductiviy Profiles.
| Num. Layers | Thickness | Reflected energy | m | R0 |
|---|---|---|---|---|
| 40 | 0.5 mm | −63.2 dB | 2 | le–5 |
| 100 | 1.25 mm | −78.9 dB | 3 | le–7 |
Fig. 3.
Transmitted and reflected waves from the perfectly matched layer with 100 layers (or a 1.25 mm thickness). Values are normalized to the transmitted amplitude.
D. Clinical Transducer in a Linear Homogeneous Nonattenuating Medium
The linear nonattenuating algorithm was compared with an equivalent Field II simulation for a commercial transducer. Field II solves the wave equation with the Tupholme-Stepanishen method for calculating linear pulsed ultrasound fields in a homogeneous medium [31]–[33]. It has been widely validated and is commonly used to model transducers.
The transducer used in the following simulations is a Siemens VF10–5 linear array (Siemens Medical Solutions USA, Inc., Issaquah, WA) with 192 elements, a 2 cm elevation focus, 2.4 cm lateral focus, an F-number of 1.5, and a 4.2 MHz center frequency. The element dimensions are 0.201 mm width and 5 mm height. For the purposes of the simulations the element kerf was assumed to be negligible. The simulation parameters were kept as described above except for the grid size, which was altered to 1.5 cm laterally, 1 cm in elevation, and 3.35 cm in depth, on the positive quadrant of the lateral-elevation plane.
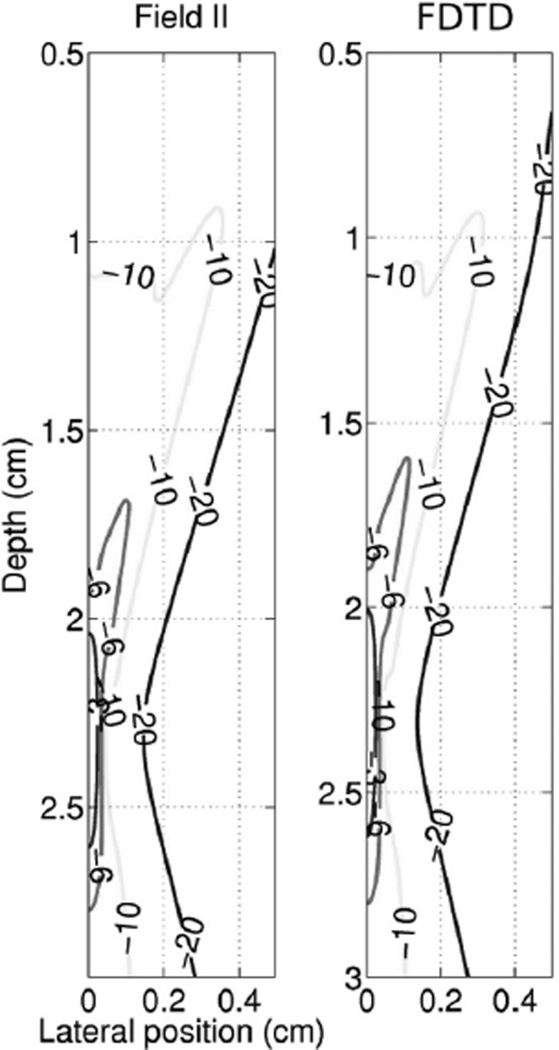
Fig. 4 compares the intensity of the acoustic field for the Field II and FDTD nonlinear full-wave simulations across the lateral plane. The agreement is good throughout the simulated region. There are small visible differences, notably the −6 dB contour is approximately 1 mm more proximal to the transducer face in the nonlinear full-wave simulation and the −20 dB contour is slightly narrower at shallow depths (z < 1.5 cm). However, the overall morphology of the contours is very close.
Fig. 4.
A comparison of the intensity of the acoustic field as calculated by Field II and the linear inviscid FDTD nonlinear full-wave method for a commercial clinical ultrasound transducer. The lateral plane is shown.
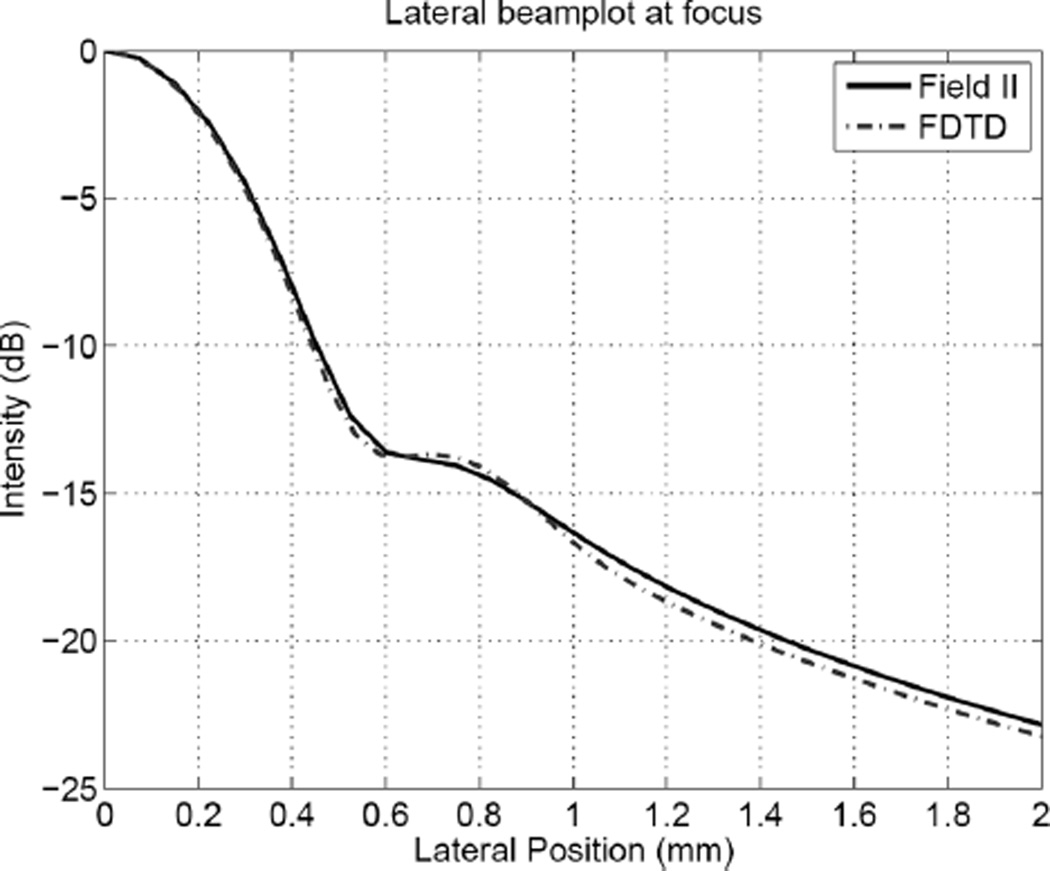
The lateral beamplot at the focus is shown in Fig. 5. The width and shape of the main lobe is almost indistinguishable between the 2 simulations. The height of the side lobe is slightly larger (<0.2 dB) for the nonlinear full-wave simulation. Beyond 1 cm laterally the difference between the 2 simulations is less than 0.3 dB.
Fig. 5.
A comparison of the lateral beam plot at the focus for the Field II and the linear inviscid nonlinear full-wave simulations.
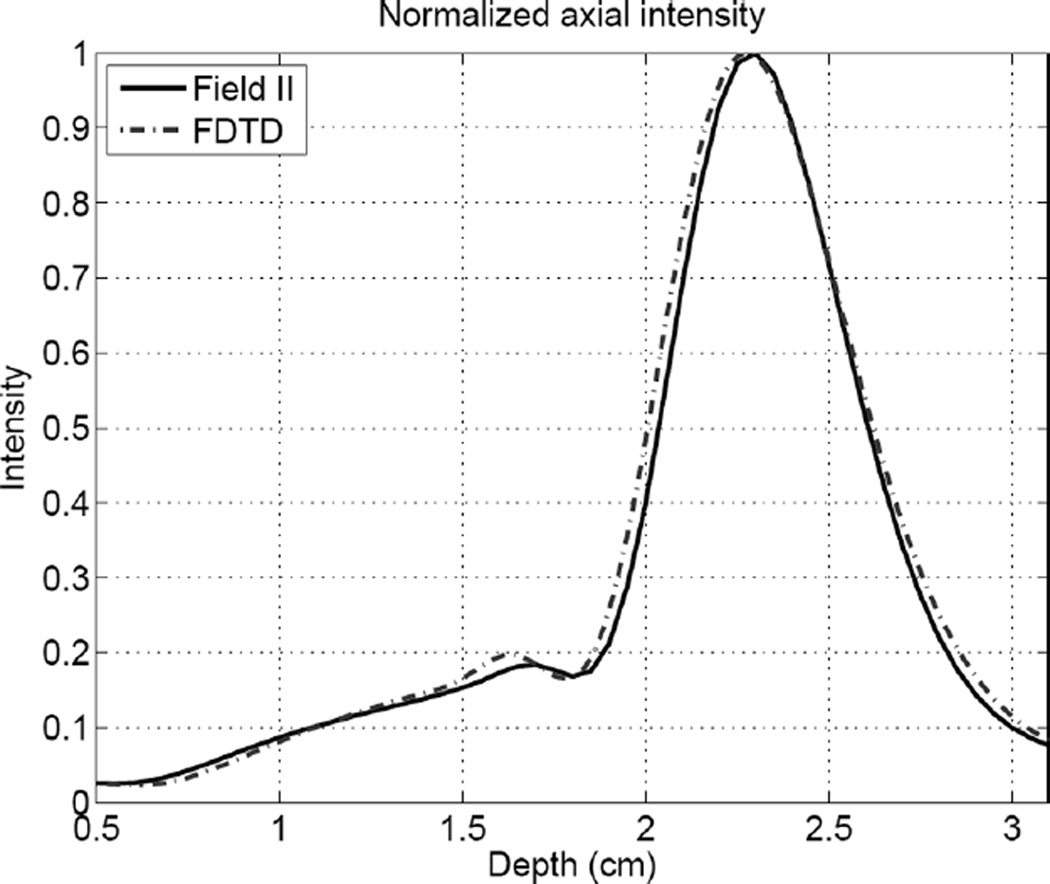
The agreement between simulations for the axial intensity, shown in Fig. 6, is also very good. There is a small difference in the calculations at the hump preceding the focal region (z = 1.6 cm) and the nonlinear full-wave simulation predicts a slightly wider (<0.2 mm) focal region.
Fig. 6.
A comparison of the axial intensity for the Field II and the linear inviscid nonlinear full-wave simulations.
E. Nonlinear Plane Wave
Results from the inviscid FDTD nonlinear full-wave simulation were compared with the results from the Galerkin method applied to the inviscid Burgers’ equation [35]. Burgers’ equation is a nonlinear hyperbolic partial differential equation that in acoustics can be written as
| (33) |
where t′ = t − z/c0 is the retarded time. The use of transformed coordinates shifts the small signal phase speed of the wave to zero. Therefore changes in pressure from (33) are due entirely to nonlinearity and not propagation effects. Solutions of the Burgers’ equation can be compared with solutions of an inviscid plane wave propagating with the FDTD nonlinear full-wave algorithm because the transverse components of the Laplacian operator in (1) are zero. Thus the solutions are mathematically equivalent for one-way waves but numerically different. Unlike the time-domain method used to solve the nonlinear full-wave equation, the Galerkin technique solves (33) in the frequency domain. The details of the implementation are omitted here but can be found in [35].
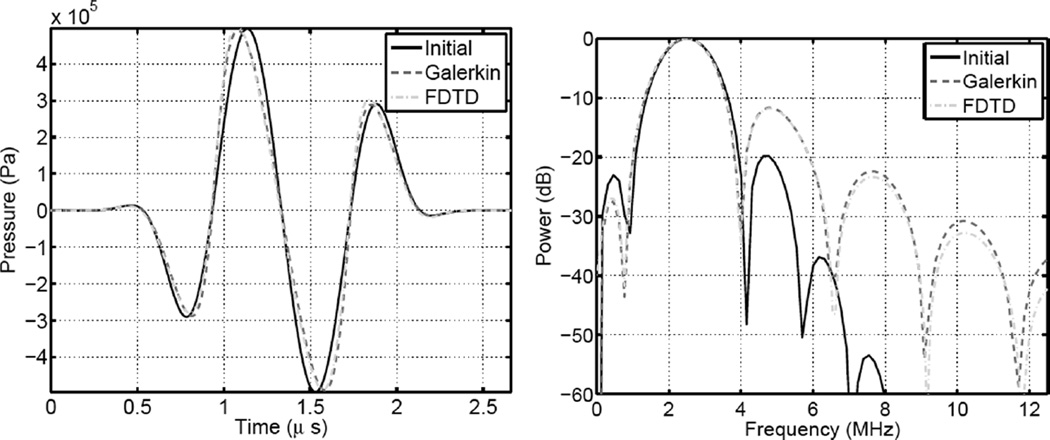
Fig. 7 shows a 2 MHz plane wave with β = 5, p0 = 1.5 MPa after it has propagated a distance of 2 cm. This distance is approximately one-quarter of the theoretical plane wave shock formation distance for a sinusoidal wave. The initial waveform is a 1.677 cycle pulse with an exponential drop-off m of 2 and is shown as a solid line. The dashed line represents the wave as calculated by the Galerkin method after it has propagated 2 cm and the dash-dotted line is the FDTD nonlinear full-wave calculation.
Fig. 7.
Nonlinear propagation of a plane wave as calculated by the FDTD nonlinear full-wave algorithm and the Galerkin scheme. A time domain waveform is shown on the left and the power spectrum is shown on the right.
In the time domain (the left graph in Fig 10), the simulations are practically indistinguishable. In the frequency domain (right graph of Fig. 10) there is excellent agreement at the fundamental and second harmonic frequencies. At the third harmonic there is a 1.2 dB difference between the peaks and at the fourth there is a 2.5 dB difference.
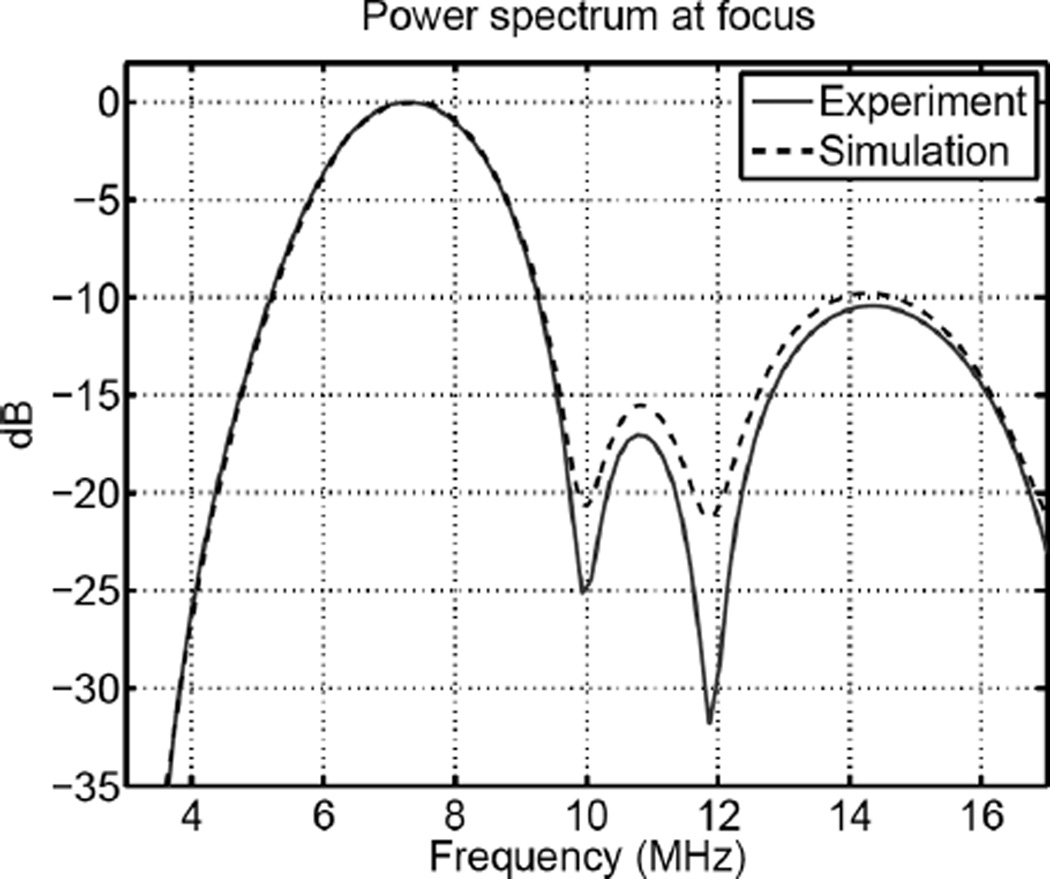
Fig. 10.
A comparison of the experimental (solid) and simulated (dashed) power spectrum at the focus.
F. Experimental Verification
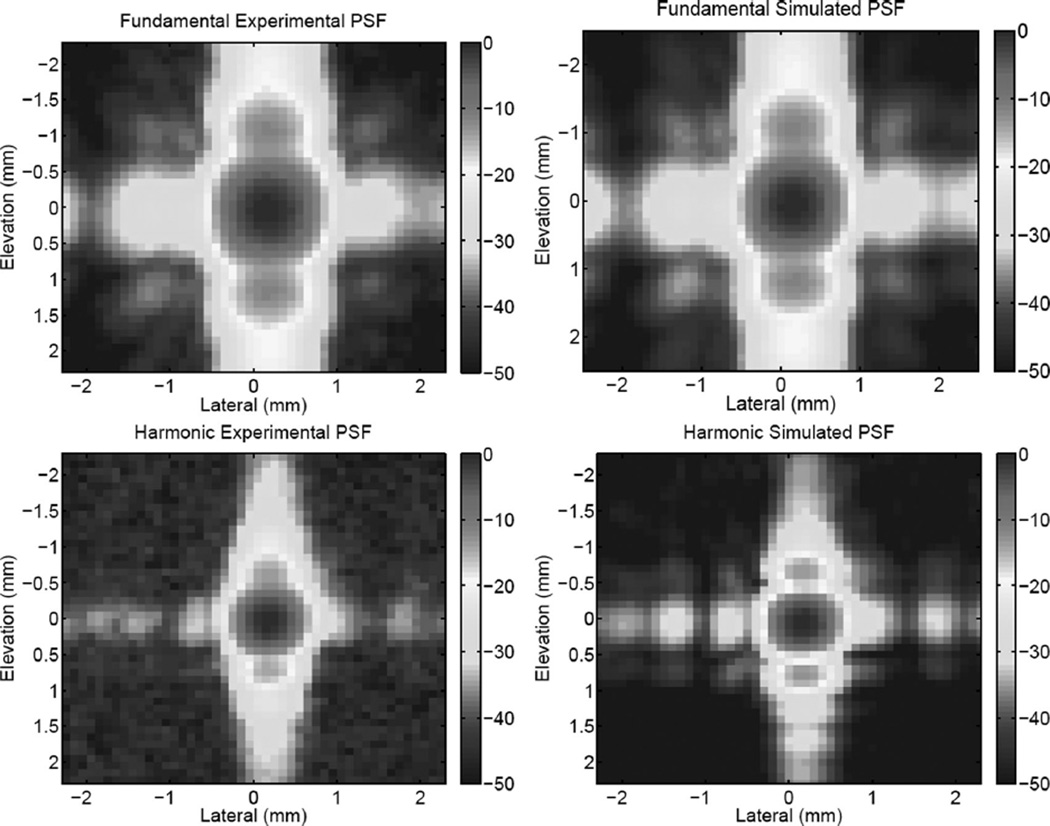
The acoustic plane at the transducer face was measured and used as an input to the full-wave simulation with the acoustic properties of water. Shown on the left of Fig. 8 are the experimentally measured point-spread functions for the fundamental (top) and harmonic (bottom) fields. The equivalent plots are shown for the simulated data with the experimentally determined initial conditions on the right. A Gaussian bandpass filter with a 100% bandwidth was used to filter the fundamental and harmonic components. The point-spread function was calculated as the temporally averaged intensity on a normalized dB scale.
Fig. 8.
Experimental (left) and simulated (right) PSFs for the fundamental (top) and harmonic (bottom) beams.
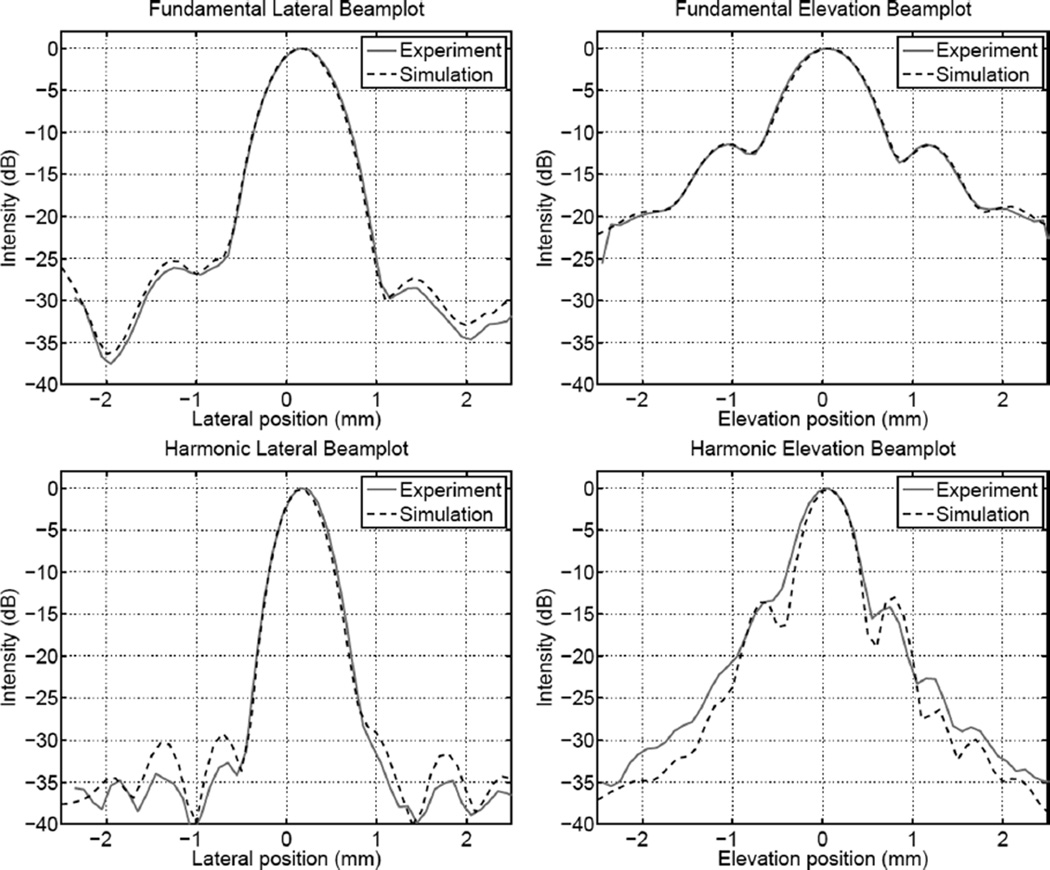
There is good agreement between the experimental and simulated fundamental PSFs in terms of primary and secondary features. The size and position of the main lobe are very similar and the initial off-plane position of the transducer is apparent in the measured and simulated data sets. The elevation and lateral side lobes also have similar position and amplitude. Features that are less than 35 dB down from the peak or off axis with respect to the lateral and elevation planes exhibit a close correspondence even though there is a visible amount of noise in the experimental data. Sections of the lateral and elevation beam plots shown in Fig. 9 provide a more quantitative visualization of the differences. The main lobe of the fundamental lateral beam plot is almost identical to the measured values. The side lobes and data below −25 dB exhibit a small discrepancy of about 1–2 dB. The elevation beam plots remain above −25 dB throughout the considered range and they are visually indistinguishable from each other.
Fig. 9.
A comparison of measured (solid) and simulated (dashed) lateral (left) and elevation (right) beam plots for the fundamental (top) and harmonic (bottom) PSFs shown in Fig. 8.
The harmonic PSFs shown at the bottom of Fig. 8 have similar primary features and many of the secondary features are distinguishable even though the noise floor of the experimental data limits the accuracy of the comparison in the sub −30 dB range. The main lobe position and size shows good agreement and the elevation side lobes have the same position and amplitude even though they appear to be blurred into the main lobe for the experimental data. The lateral side lobes can be seen peaking through the noise floor in the same locations as the simulated data. Beam plots at the bottom of Fig. 9 show that in the elevation plane the main lobe matches the experimental data down to −30 dB and in the elevation plane there is a close match with a 5% error at the full width half maximum (FWHM). The position of the secondary lobes is accurate though there is a discrepancy of less than 4 dB in the magnitude.
A comparison of the experimental and simulated power spectra at the focal point is shown in Fig. 10. The fundamental power spectra at 6.67 MHz are indistinguishable and there is a 1 dB or less difference for the harmonic power spectra at 13.3 MHz. There is a slightly larger difference in the power spectra for frequencies in between the fundamental and harmonic power bands but it is limited to a narrow frequency range centered at 10 and 12 MHz.
G. Ultrasonic Imaging
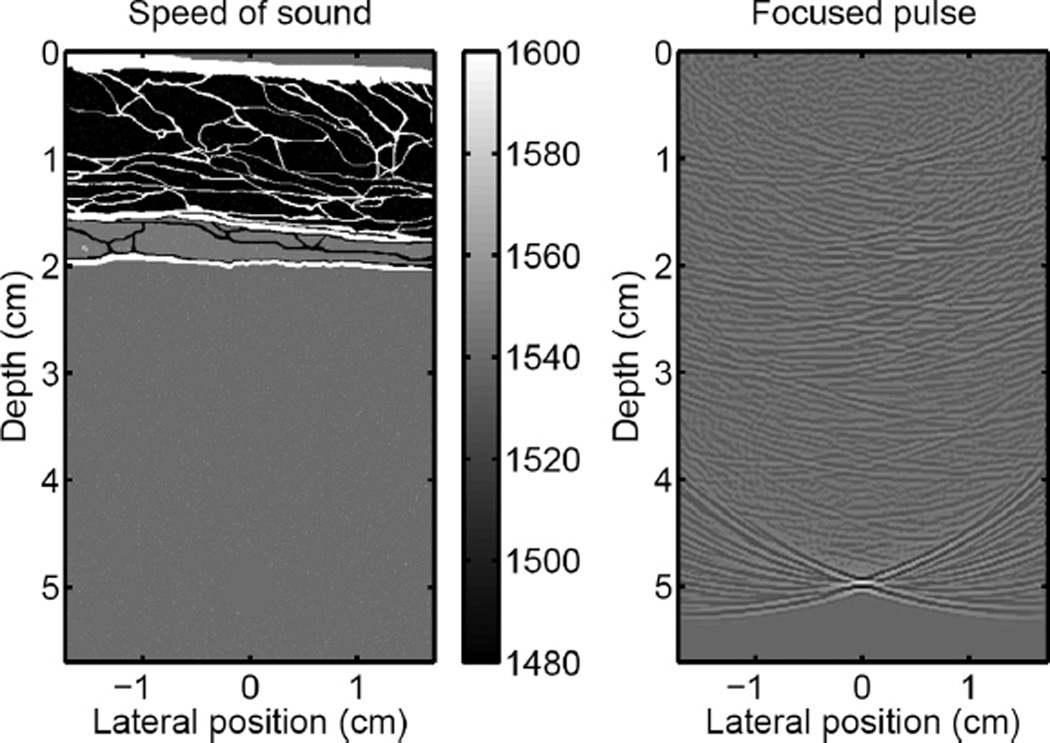
A focused ultrasonic pulse was propagated through a 2-dimensional hetergeneous tissue model with 12 point scatterers per resolution. In the interest of time these simulations were performed in 2 dimensions because each line in the ultrasound image was calculated using a transmitreceive simulation. The initial pulse had an amplitude of 0.5 MPa and was spherically focused at 5 cm from an unapodized transducer with an F-number of 1.5. Its center frequency was 2.1 MHz with a 67% bandwidth. The tissue representation was obtained from a histologically stained sample of human abdominal wall [7], [36] and the structures in the tissue were correlated with their measured properties of which the speed of sound is shown on the right of Fig. 11. As shown in Table III there are variations in speed of sound, attenution, density, and nonlinearity. The point scatterers have a 40 µm diameter and a random spatial and amplitude variation with a mean variation in the speed of sound of 77 m/s, which corresponds to a 5% variation of the accepted average tissue velocity of 1540 m/s. The pressure field at the focus (5 cm) is shown on the right side of Fig. 11 on a compressed scale to emphasize small amplitude features such as those occurring from reflection, reverberation, and scattering.
Fig. 11.
On the left, a graphical representation of the variation in the speed of sound for the abdominal layer (not shown are spatial variations in attenuation, nonlinearity, and density). On the right, the acoustic field of a diagnostic pulse at the focus (scale is compressed to emphasize small amplitudes).
Table III.
Typical Acoustic Parameters for Tissue.
| Tissue | B/A | α (dB/MHz/cm) | c0 (m/s) |
|---|---|---|---|
| Fat | 9.6 | 0.40 | 1479 |
| Muscle | 8.0 | 0.1S | 1550 |
| Connective | 8.0 | 0.68 | 1613 |
| Liver | 7.6 | 0.50 | 1570 |
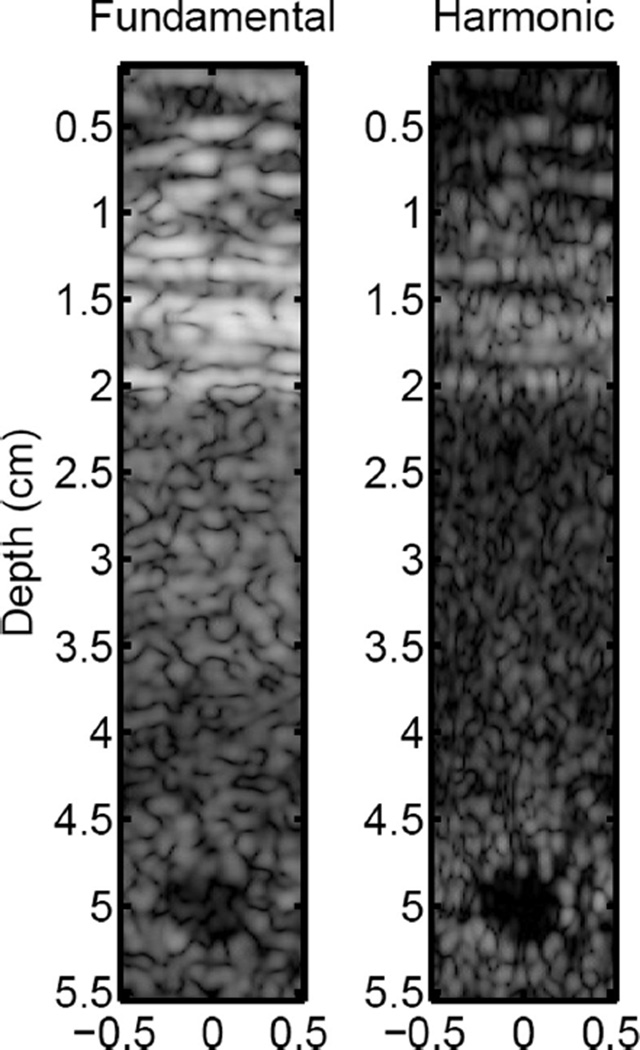
A circular anechoic region with a 5 mm diameter was placed at the focus to mimic a lesion. To simulate an ultrasonic imaging system, a focused pulse was transmitted and allowed to propagate. The resulting reflections were measured and a standard constant F-number delay and sum beamforming algorithm was used to create a single A-line. The process was repeated by translating the transducer and forming a series of A-lines that are shown as fundamental (left) and harmonic (right) B-mode images in Fig. 12. A 100% bandwidth bandpass filter was used to obtain the fundamental and harmonic components from the raw data. No point-spread function assumptions were used to form the images.
Fig. 12.
Simulated fundamental (left) and harmonic (right) ultrasound images of an anechoic region below an abdominal using a transmit-re-ceive beamformation process.
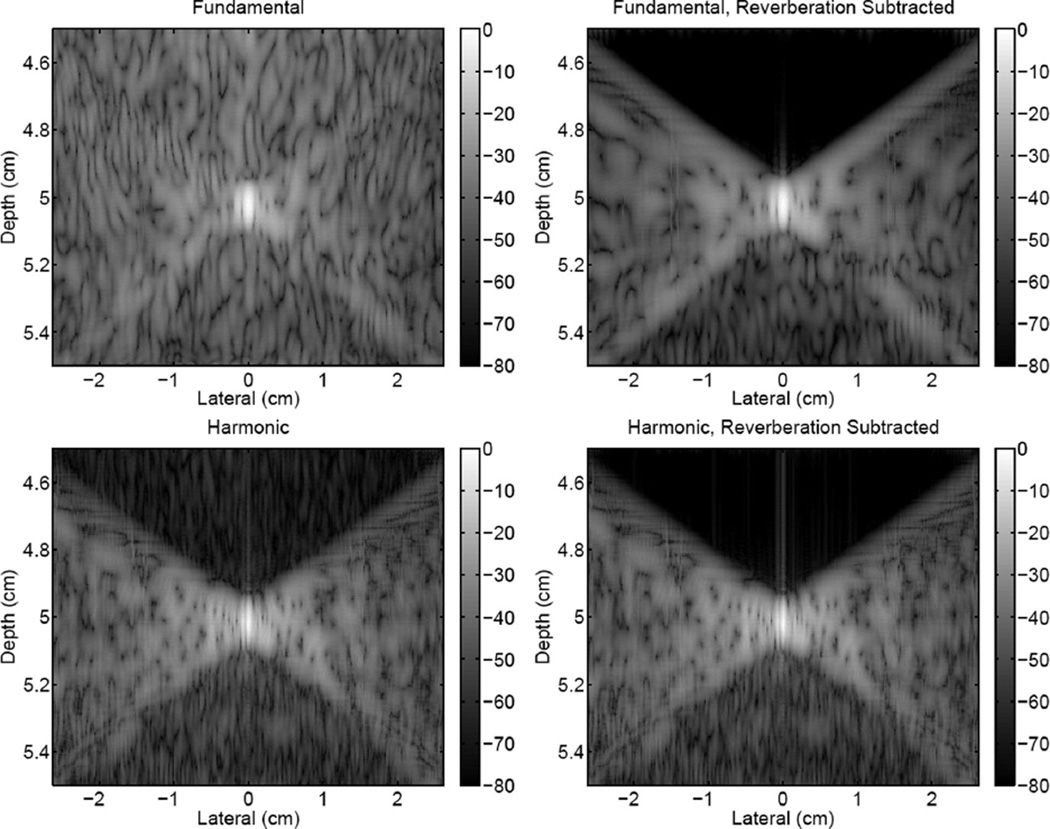
In a second related application the transmit-receive point-spread functions were calculated for the same ultrasonic pulse propagating through the tissue layer but without the spatially distributed scatterers. A single point scatterer was placed at the focus and beamforming was used to obtain the fundamental and harmonic point-spread functions shown on the left of Fig. 13. All other material and pulse parameters were kept unchanged from the previous description. The plots on the right of Fig. 13 were obtained by subtracting the reverberation from the nearfield layer from the original fundamental and harmonic PSFs. This reverberation PSF was calculated by removing the point target at the focus and using only the reflections from the abdominal layer in the beamforming process.
Fig. 13.
Point-spread functions with clutter from propagation through a representation of the abdominal wall. The fundamental (top) and harmonic (bottom) PSFs are shown without any processing (left) and with reverberation clutter removed (right). The axes are not geometrically proportional.
The plots of the PSFs have 4 distinct regions of interest: the X-shaped portion spanning the image, representing a conventional PSF if it did not incur any degradation; the lateral regions within the isochronous volume to the left and right of the “X,” the region above, which precedes the pulse temporally; and the region below, which trails it. The fundamental PSF has a substantial amount of clutter written into all these regions whereas the harmonic PSF is degraded primarily in the isochronous volume, to a lesser extent in the trailing region, and even less in the preceding region. When the reverberation clutter is linearly subtracted from the original PSF there is a marked improvement in the fundamental PSF. All of the clutter in the preceding region is removed, there is a substantial reduction in the trailing region, and there is an improvement in the isochronous volume. In the harmonic PSF the clutter in the preceding region is also removed but because the original harmonic PSF does not have much clutter there to begin with the improvement is comparatively smaller. There is not an easily discernible improvement in the remaining regions.
IV. Discussion
A. Computation
The algorithm uses fourth-order finite difference discretizations in space and second-order discretizations in time that were solved explicitly in the time domain. Due to the fine discretization and the use of 3 spatial dimensions the memory and processing requirements were demanding. More than 109 physical grid points and more than 1013 spatio-temporal points are calculated for each 3-dimensional simulation. To distribute the memory and computational requirements custom parallel code was written with version 7.0.6 of the LAM/MPI toolkit using a combination of C and Fortran77. This code runs on a dedicated 56 processor Linux cluster with 64 bit architecture and 112 GB of RAM.
The overall spatial stencil for the entire method was kept at 5 points per dimension which, with the one-dimensional domain decomposition used in the parallelization, required communication of a laterally 2-point-wide axial-elevation volume per processor per domain boundary. These extensive internode communication requirements were negotiated with a private gigabit network using jumbo frames on a SMC8748L2 switch. The system runs Cen-tOS 4, a free version of Red Hat Enterprise Linux 4. The 3-dimensional simulations presented in this paper required approximately 32 h of run time and 90 GB of memory.
B. Perfectly Matched Layer
In the PML literature it is common to treat the interior of the domain, where there are no absorbing layers, as an extension of the PMLs with the stretched coordinate set to 1 [22], [30]. To improve the memory requirements, here the interior is treated separately and only the boundary elements have the increased memory requirements associated with the PML. For large simulations, such as those presented in this paper, the boundaries represent a small fraction of the total simulation; therefore, the added memory requirement of the PML is practically negligible and grows only marginally with an increase in the domain size.
One of the advantages of using PMLs compared with conventional methods is that the amount of absorption can be increased by simply adding extra layers. There is. however, a point of diminishing returns; for example, an increase from 40 to 100 layers reduced the reflected amplitude from −63.2 dB to −78.9 dB, a 24% change.
An 80 dB reduction in reflected energy is low enough to satisfy demanding ultrasound applications, such as those requiring clutter or reverberation measurements, and is much better than typical results from water tank setups with absorbing media on the walls.
C. Nonlinear Plane Wave
Propagation of a nonlinear plane wave and comparison with the Galerkin solution of Burgers’ equation shows the accuracy to within 2.5 dB of the FDTD method up to 4 times the fundamental frequency. An accurate representation of the higher frequencies is particularly important for thermal simulations where the amount of energy deposition is related to the frequency dependent absorption and is more heavily dependent on higher frequencies. There is no distinguishable error in the power spectrum estimate for the second harmonic, which has particular significance for harmonic imaging. Frequencies beyond the second harmonic are normally outside of the transducer’s passband and do affect imaging applications.
D. Experimental Verification
The experimental verification ties together the effects of diffraction, nonlinearity, and, to a lesser extent, frequency-dependent attenuation, which had previously been examined independently. The results indicate that the nonlinear full-wave FDTD simulation can take a measured apodized focused ultrasonic field at the transducer face and accurately reproduce the acoustic field at the focus for both the fundamental and harmonic components. Even fine characteristics that are 30 dB below the main lobe and focal errors in the original pulse can be seen in the simulated results. The excellent agreement between the simulated and experimentally determined power spectra at the focus support the previous spectral results for plane wave propagation.
E. Ultrasonic Imaging
The previous verifications of the simulation established confidence in our ability to simulate realistic ultrasonic fields in homogenous media. However, the intended application of the simulation is for heterogeneous media where our ability to verify the results is limited. The heterogeneous results were presented based on the strength of prior verification steps.
When an ultrasound pulse propagates through an in silico representation of a measured section of human abdominal wall it exhibits the expected complex characteristics associated with heterogeneous propagation. In the multimedia file (not shown here) the pulse can be seen reflecting from the layers in the abdominal wall. As the pulse emerges the spherical profile of reflections from the point scatterers become apparent. some of the energy reaches the boundary where there is no discernible reflection from the wall. The pulse becomes progressively tighter as it reaches the focus at 5 cm. Meanwhile acoustic energy continues to reverberate in between the layers of the abdomen and there is a discernible step in the amplitude of the reverberating acoustic field that follows integer multiples of the abdominal depth. Finally the pulse is completely absorbed by the distal boundary and only the reverberated energy persists in the simulated region. Although it is not discernible in the movie, the propagation occurs nonlinearly and with frequency dependent loss.
The simulated ultrasonic images shown in Fig. 12 exhibit characteristic differences between conventional and harmonic imaging. In the harmonic image the anechoic lesion at 5 cm has better contrast to noise ratio and better boundary definition. The abdominal layers in the fundamental image are comparatively brighter, indicating that proportionally more fundamental energy is reflected from them than harmonic energy, which is consistent with the fact that a certain propagation distance is required for harmonic energy to develop and accumulate.
The clutter point-spread function images shown in Fig. 13 provide a more comprehensive picture of the mechanisms for harmonic image quality improvement. When the clutter PSFs are subtracted from the original PSFs there is a marked improvement in the fundamental PSF but only a marginal improvement in the harmonic PSF. This provides strong supporting evidence that reverberations from near-field layers are a substantial source of image quality degradation for fundamental imaging but not for harmonic imaging. Energy at harmonic frequencies has not yet developed in the near field; therefore, there isn’t enough reverberation at those frequencies to degrade the image. This analysis applies to the simulated image, which is a single realization.
The clutter simulations also demonstrate the capabilities of the simulation in a numerically demanding situation. An 80 dB dynamic range is achieved in the fundamental plots in Fig. 13 and, preceding normalization, an additional 10 dB is shown in the harmonic plots. A small amount of numerical noise is visible as striations in the center of the harmonic reverberation subtracted image, and to a lesser extent in the fundamental image, but overall there are very few numerical artifacts. There are no discernible reflections, which would be visible where the “X” meets the lateral boundaries (note that these images were not cropped laterally, and the edge of the image corresponds to the lateral boundary of the domain).
V. summary and conclusions
We have introduced a finite difference time-domain algorithm that solves the nonlinear attenuating full-wave equation in 3 spatial dimensions. The numerical method propagates nonlinear diagnostic ultrasound waves in a heterogeneous attenuating medium with boundary conditions that reduce reflections to negligible levels. The entire acoustic field is simulated so the effects of reflection, reverberation, multiple scattering, and clutter can be accurately modeled and an arbitrary acoustic source can be placed anywhere in the 3-dimensional simulated field. In the simulations presented heterogeneities in the nonlinearity, attenuation, density, and speed of sound can be modeled with a resolution of 12.5 µm.
The numerical solutions were verified extensively. diffraction, or the linear wave term, was verified with Field II, a simulation package that is considered a standard in linear transducer modeling, and with water tank measurements. differences between the 2 simulations were less than 0.3 dB across the considered acoustic field. comparisons of the measured and simulated focal plane of a diagnostic ultrasound transducer exhibited the same primary and secondary features with respect to the position and amplitude of the main lobe and side lobes for both the fundamental and harmonic components. A comparison of the power spectrum at the focus also showed excellent agreement. The nonlinear propagation was also verified numerically with results from the Galerkin method for a propagating plane wave and was shown to be in agreement to within 2.5 dB up to 4 times the fundamental frequency. There is negligible disagreement if only the fundamental and harmonic frequencies are considered.
We demonstrated the code’s ability to propagate sound through heterogeneous media by transmitting an ultrasound pulse through a measured representation of human abdominal wall. There is no easy way to verify heterogeneous propagation but the acoustic field qualitatively exhibited the expected behavior as it scattered, reflected, reverberated, focused, and distorted nonlinearly.
The method’s capabilities were demonstrated by creating fundamental and harmonic ultrasonic images in silico through the same physical process used in a diagnostic scanner. A series of pulses were transmitted through a heterogeneous scattering medium and the received acoustic field at the transducer plane was used in a beamforming algorithm. The resulting harmonic image exhibited the characteristic improvement in lesion boundary definition and contrast. To determine a mechanism for image quality improvement the point-spread functions for these images were calculated and it was shown that reverberation clutter degrades the fundamental image to a much larger extent than the harmonic image.
This simulation has the potential to investigate harmonic imaging in heterogeneous media, not just for clutter, but also from the perspective of distributed or near-field phase aberration, beamformation, tissue structure and properties, scatterer distribution, and for novel transducer geometries. Although not presented here, in addition to imaging applications the simulation can, for example, output the complete spatio-temporal loss field as calculated from the relaxation mechanisms, which has particular applications for acoustic radiation force or tissue heating.
Acknowledgments
We would like to thank Joshua Baker-LePain for technical support with the computer cluster and T. Douglas Mast for providing the histological data for the human abdominal wall.
This work was supported by NIH grants R01-HL075485 and 1R01-CA114093.
Biographies

Gianmarco F. Pinton was born in Milan, Italy, in 1979. He received a B.S. in physics and a B.S.E in biomedical engineering from Duke University, Durham, NC, in 2001. He received a M.S. in mathematics and a Ph.D. in biomedical engineering also from Duke University in 2007. He is currently a postdoctoral associate at the Ecole Su-perieure de Physique et Chimie Industrielles in Paris, France. His current research interests are in nonlinear wave propagation through the skull and therapeutic ultrasound.

Jeremy J. Dahl was born in Ontonagon, Michigan, in 1976. He received the B.S. degree in electrical engineering from the University of Cincinnati, Cincinnati, OH, in 1999. He received the Ph.D. degree in biomedical engineering from Duke University in 2004. He is currently an Assistant Research Professor with the Department of Biomedical Engineering at Duke University. He is currently researching adaptive ultrasonic imaging systems and radiation force imaging methods.

Stephen J. Rosenzweig was born in New York, NY, in 1986. He received the B.S.E. degree in biomedical engineering from Duke University, Durham, NC, in 2008. He is currently a James B. Duke graduate fellow in the Biomedical Engineering Department at Duke University.

Gregg E. Trahey received the B.G.S. and M.S. degrees from the University of Michigan, Ann Arbor, MI, in 1975 and 1979, respectively. He received the Ph.D. degree in biomedical engineering in 1985 from Duke University. He served in the Peace Corps from 1975 to 1978 and was a project engineer at the Emergency Care Research Institute in Plymouth Meeting, PA, from 1980 to 1982. He currently is a Professor with the Department of Biomedical Engineering at Duke University and holds a secondary appointment with the Department of Radiology at the Duke University Medical Center. He is conducting research in adaptive phase correction, radiation force imaging methods, and 2-D flow imaging in medical ultrasound.
Contributor Information
Gianmarco F. Pinton, Ecole Superieure de Physique et Chimie In-dustrielles, Paris, France
Jeremy Dahl, Department of Biomedical Engineering at Duke University.
Stephen Rosenzweig, Department of Biomedical Engineering at Duke University.
Gregg E. Trahey, Department of Biomedical Engineering at Duke University
References
- 1.Tranquart F, Grenier N, Eder V, Pourcelot L. Clinical use of ultrasound tissue harmonic imaging. Ultrasound Med. Biol. 1999 Jul;25(6):889–894. doi: 10.1016/s0301-5629(99)00060-5. [DOI] [PubMed] [Google Scholar]
- 2.Thomas JD, Rubin DN. Tissue harmonic imaging: Why does it work? J. Am. Soc. Echocardiography. 1998 Aug;11(8):803–808. doi: 10.1016/s0894-7317(98)70055-0. [DOI] [PubMed] [Google Scholar]
- 3.Humphrey VF. Nonlinear propagation in ultrasonic fields: Measurements, modelling, and harmonic imaging. Ultrason. 2000 Mar;38:267–272. doi: 10.1016/s0041-624x(99)00122-5. [DOI] [PubMed] [Google Scholar]
- 4.Wallace KD, Robinson BS, Holland MR, Rielly MR, Miller JG. Experimental comparisons of the impact of abdominal wall aberrators on linear and nonlinear beam patterns. Proc. IEEE Ultrasonics Symp. 2004 Aug;2:866–869. [Google Scholar]
- 5.Spencer KT, Bednarz J, Rafter PG, Korcarz C, Lang RM. Use of harmonic imaging without echocardiographic contrast to improve two-dimensional image quality. Am. J. Cardiol. 1998 Sep;82(6):794–799. doi: 10.1016/s0002-9149(98)00457-3. [DOI] [PubMed] [Google Scholar]
- 6.Varslot T, Masoy S-E, Angelsen TFJB. Aberration in nonlinear acoustic wave propagation. IEEE Trans. Ultrason. Fer-roelectr. Freq. Control. 2007 Mar;54(3):470–479. doi: 10.1109/tuffc.2007.271. [DOI] [PubMed] [Google Scholar]
- 7.Mast TD, Hinkelman LM, Orr MJ, Sparrow VW, Waag RC. Simulation of ultrasonic pulse propagation through the abdominal wall. J. Acoust. Soc. Am. 1997 Aug;102(2):1177–1190. doi: 10.1121/1.421015. [DOI] [PubMed] [Google Scholar]
- 8.Mast TD. Two- and three-dimensional simulations of ultrasonic propagation through human breast tissue. Acoust. Res. Lett. Online. 2002;3(2):53–58. [Google Scholar]
- 9.Tabei M, Mast TD, Waag R. Simulation of ultrasonic focus aberration and correction through human tissue. J. Acoust. Soc. Am. 2003;113(2):1166–1176. doi: 10.1121/1.1531986. [DOI] [PubMed] [Google Scholar]
- 10.Zabolotskaya EA, Khokhlov RV. Quasi-plane waves in the nonlinear acoustics of confined beams. Sov. Phys. Acoust. 1969;15:35–40. [Google Scholar]
- 11.Kuznetsov VP. Equations of nonlinear acoustics. Sov. Phys. Acoust. 1971;16:467–470. [Google Scholar]
- 12.Baker AC, Berg AM, Sahin A, Tj0tta JN. The nonlinear pressure field of plane, rectangular apertures—Experimental and theoretical results. J. Acoust. Soc. Am. 1995 Jun;97(6):3510–3517. [Google Scholar]
- 13.Khokhlova V, Souchon R, Tavakkoli J, Sapozhnikov O, Cathignol D. Numerical modeling of finite-amplitude sound beams: Shock formation in the near field of a cw plane piston source. J. Acoust. Soc. Am. 2001;110(1):95–108. [Google Scholar]
- 14.Lee Y-S, Hamilton MF. Time-domain modeling of pulsed finite-amplitude sound beams. J. Acoust. Soc. Am. 1995 Feb;97(2):906–917. [Google Scholar]
- 15.Tappert F. The parabolic approximation method in wave propagation and underwater acoustics. In: Keller JB, Papadakis JS, editors. Lectures in Physics. New York: Springer; 1977. pp. 224–287. [Google Scholar]
- 16.Westervelt PJ. Parametric acoustic array. J. Acoust. Soc. Am. 1963;35(4):535–537. [Google Scholar]
- 17.Hamilton MF, Blackstock DT. Nonlinear Acoustics. San Diego: Academic Press; 1997. [Google Scholar]
- 18.Hallaj IM, Cleveland RO. Fdtd simulation of finite-amplitude pressure and temperature fields for biomedical ultrasound. J. Acoust. Soc. Am. 1999 May;105(5):L7–L12. doi: 10.1121/1.426776. [DOI] [PubMed] [Google Scholar]
- 19.Berenger J-P. A perfectly matched layer for the absorption of electromagnetic waves. J. Comput. Phys. 1994 Oct;114:185–200. [Google Scholar]
- 20.Becache E, Collino F, Joly P. Higher-order numerical schemes and operator splitting for solving 3D paraxial wave equations in heterogeneous media. Technical Report 3497, INRIA: Institute National de Recherche en Informatique et en Automatique. 1998 Sep [Google Scholar]
- 21.Chew WC, Liu QH. Perfectly matched layers for elastody-namics: A new absorbing boundary condition. J. Comput. Acoust. 1996;4(4):72–79. [Google Scholar]
- 22.Liu Q-H, Tao J. The perfectly matched layer for acoustic waves in absorbtive media. J. Acoust. Soc. Am. 1997;102(4):2072–2082. [Google Scholar]
- 23.Norton GV, Novarini JC. Including dispersion and attenuation directly in the time domain for wave propagation in isotropic media. J. Acoust. Soc. Am. 2003;113(6):3024–3031. doi: 10.1121/1.1572143. [DOI] [PubMed] [Google Scholar]
- 24.Emmerich H, Korn M. Incorporation of attenuation into time-domain computations of seismic waves. Geophys. 1987;52(9):1252–1264. [Google Scholar]
- 25.Jensen JA, Svendsen NB. Calculation of pressure fields from arbitrarily shaped, apodized, and excited ultrasound transducers. IEEE Trans. Ultrason. Ferroelectr. Freq. Control. 1992;39(2):262–267. doi: 10.1109/58.139123. [DOI] [PubMed] [Google Scholar]
- 26.Jensen JA. Field: A program for simulating ultrasound systems. 10th Nordic-Baltic Conf. Biomedical Imaging. 1996;4(supplement 1):351–353. [Google Scholar]
- 27.Li YD, Zagzebski JA. Computer model for harmonic ultrasound imaging. IEEE Trans. Ultrason. Ferroelectr. Freq. Control. 2000 Sep;47(5):1259–1272. doi: 10.1109/58.869075. [DOI] [PubMed] [Google Scholar]
- 28.Cleveland RO, Hamilton MF, Blackstock DT. Time-domain modeling of finite-amplitude sound in relaxing fluids. J. Acoust. Soc. Am. 1996 Jun;99(6):3312–3318. [Google Scholar]
- 29.Strickwerda JC. Finite Difference Schemes and Partial Differential Equations. Wadsworth and Brooks/Cole; 1989. [Google Scholar]
- 30.Chew WC, Wheedon WH. A 3D perfectly matched medium from modified Maxwell’s equations with stretched coordinates. Mi-crow. Opt. Technol. Lett. 1994;7(13):599–604. [Google Scholar]
- 31.Tupholme GE. Generation of acoustic pulses by baffled plane pistons. Mathematika. 1969;16:209–224. [Google Scholar]
- 32.Stepanishen PR. The time-dependent force and radiation impedance on a piston in a rigid infinite planar baffle. J. Acoust. Soc. Am. 1971;49(3):841–849. [Google Scholar]
- 33.Stepanishen PR. Transient radiation from pistons in an infinite planar baffle. J. Acoust. Soc. Am. 1971;49:1627–1638. [Google Scholar]
- 34.Morse PM, Ingard KU. Theoretical Acoustics. Princeton University Press; 1986. [Google Scholar]
- 35.Peyret R. Spectral Methods for Incompressible Viscous Flow. Springer-Verlag; 2000. [Google Scholar]
- 36.Hinkelman LM, Liu D, Metlay LA, Waag RC. Measurements of ultrasonic pulse arrival time and energy level variations produced by propagation through abdominal wall. J. Acoust. Soc. Am. 1994;95:530–541. doi: 10.1121/1.408347. [DOI] [PubMed] [Google Scholar]


