Abstract
Photodynamic therapy (PDT) relies on light-dependent, tissue-targeted, oxidative stress in tumors that have accumulated a photosensitizing drug. Glutathione S-transferases (GSTs) are often up-regulated in tumors and they modulate oxidative stress by several isoform-dependent mechanisms. GSTs, therefore, are potential confounding factors in PDT. Therefore, we examined this possibility in human kidney 293 cells transfected with a plasmid encoding either green fluorescent protein alone (pIRES-GFP) or both GFP and GSTP1-1 (pIRES-GFP-GSTP). Cells were cultured and treated with light alone, the sensitizer hypericin (HYP) alone, or light and HYP. Cells harboring pIRES-GFP-GSTP exhibited a modest 2-fold increase in GSTP1-1 expression over control cells. On the basis of flow cytometry and microscopy, the light-dependent toxicity of HYP was reduced in cells over-expressing GSTP1-1. Paradoxically, the decreased toxicity in the cells with GSTP1-1 over-expression occurred concomitantly with a modest ~2-fold increase in cellular uptake of the drug. Immunoprecipitation of HYP and Western analysis indicated that GSTP1-1 is a major intracellular-binding site for HYP. These results are the first to demonstrate GST expression as a confounding variable of photodynamic therapy. Further, a high-affinity GST inhibitor reversed the GSTP1-1-dependent resistance, suggesting the possible utility of pharmacological strategies to optimize PDT.
Keywords: Photosensitizer, Oxidative stress, Hypericin, Flow cytometry
Photodynamic therapy (PDT)1 is a relatively new anti-cancer strategy in which photosensitizing drugs accumulate in tumors or their associated vasculature and are activated by visible light or IR radiation [1–5]. The wavelengths of light used in modern PDT do not include the UV region, and the biological responses to PDT are likely to be distinct from classic UV stress. Prototypical photosensitizers include porphyrin analogs and polycyclic aromatic dyes [1–5]. Other potentially useful PDT agents include hypericin (HYP) and hypocrellins that are found in the popular naturopathic anti-depressant St. John’s wort [6–9]. Although HYP has not been developed for clinical use in PDT it remains as a useful model compound. All of these photoactivated sensitizers generate reactive oxygen species (ROS), including cytotoxic singlet oxygen, hydroxyl radical, and superoxide anion. Depending on tissue type and conditions, cell death may result from necrosis or apoptosis [5,7,9,10]. In essence, PDT exploits targeted oxidative stress to selectively kill tumors or their associated vasculature. Specific cellular targets of PDT sensitizers, if any, have not been clearly identified and their mechanism, cellular distribution, and elimination are not completely characterized. Although the ROS generated during PDT are diffusive, specific targets may vary with subcellular location of the specific sensitizer, and organelle-dependent toxicity is likely to vary with subcellular distribution.
Cytosolic glutathione S-transferases (GSTs) are a canonical family of dimeric detoxification enzymes that comprise several classes with overlapping, but distinct, substrate specificity [11,12]. GSTs are frequently over-expressed in tumors [13–15]. The level of over-expression in tumors is variable, tissue-dependent, and GST isoform-dependent. Although the GSTP1-1 isoform is most commonly up-regulated in tumors, others may also be over-expressed in some cases, including GSTA1-1 and GSTM1-1. Of the many functions ascribed to GSTs, their potential roles in combating oxidative stress are of potential interest as a confounding factor in PDT. The GST-dependent anti-oxidative stress responses represent a wide range of molecular mechanisms. For example, GSTP1-1 and GSTM1-1 inhibit the signal transduction proteins, Jun kinase (JunK) and apoptosis signaling kinase 1 (Askl), respectively, and GST over-expression may prevent apoptosis via direct protein–protein interactions that modulate MAPK signaling [16–19]. Alternatively, GSTA4-4, GSTA1-1, and GSTA2-2 catalytically degrade lipid peroxides and their electrophilic products, including 4-hydroxynonenal, which otherwise contribute to toxicity and promote oxidative stress [20–25]. In addition, it is well established that GSTs bind pro-oxidant compounds such as porphyrins, aromatic dyes, and established photosensitizers [26–28]. Interestingly, sequestration of HYP by GSTP1-1 in vitro, but not GSTA1-1, causes passivation of the photophysical properties HYP, and decreases the yield of ROS [29]. Collectively, the passive ‘ligandin’ binding behavior, the catalytic activity against lipid peroxidation products, and the modulation of signal transduction could all be factors that alter the efficacy of PDT in tumors that over-express GSTs. Although GST-dependent modulation of other sources of oxidative stress has been demonstrated, effects of GST expression on PDT efficacy have not been previously demonstrated.
Here, we exploit a human kidney 293 cell culture model system to control the expression of GSTP1-1 with plasmid. The results demonstrate that increased GST expression is inversely correlated with HYP efficacy in PDT. Interestingly, this occurs even though GSTP1-1 over-expression leads to an increase in cellular uptake of HYP, and the results suggest that this may result from direct sequestration of HYP by GSTP1-1. Further, the results demonstrate that tissue-dependent or individual-dependent expression of GSTP1-1 is likely to be a confounding aspect of PDT therapy.
Materials and methods
Cell lines and culture
Human kidney Wbroblast line, K293, transformed with constructs pIRES-GFP and pIRES-GFP-GSTP was the kind gift of Professor Hans-Peter Kiem (Fred Hutchinson Cancer Research Center). K293 cells were transfected and selected on G418. Protein expression in the transfected cell lines is driven by the human cytomegalovirus immediate-early enhancer/promoter (CMV). The GSTP1-1 construct is a bicistronic transcription unit containing GSTP1-1 cDNA followed by an EGFP cDNA translated from an internal ribosome entry site (IRES). The pIRES-GFP construct, which lacks the GSTP cDNA, serves as a vector control. Dulbecco’s modified Eagle’s medium (D-MEM), phosphate-buffered saline (PBS), trypsin–EDTA, and penicillin–streptomycin were from Gibco (Grand Island, NY). Fetal bovine serum was from HyClone (Logan, UT). Hypericin was from Alexis (San Diego, CA). Hoechst 33258 fluorophore was from Molecular Probes (Eugene, OR) and used according to manufacturer’s directions. In all experiments, pIRES-GFP and pIRES-GFP-GSTP human kidney Wbroblast cells were plated at equal densities in D-MEM supplemented with 10% FBS on 35mm dishes, incubated at 37 °C, 5% CO2, 95% humidified air, and grown to 80% confluence. All experiments were performed in triplicate.
Western analysis and immunoprecipitation
Antibody to GSTP1-1 was from Alpha Diagnostics (San Antonio, TX, USA). HRP-labeled goat anti-rabbit Ig was from PharMingen (San Diego, CA). Protein A CL-4B Sepharose beads and ECL Western Blotting Detection Reagents were from GE Healthcare (Piscataway, NJ). Western blot densitometry measurements were calculated using ImageJ software (National Institutes of Health, USA).
Immunoprecipitations (IP) and Western blots were carried out following the BestProtocols™ manual from eBioscience with minor changes. Briefly, 1 mg of total cell lysate was precleared with 100 μ1 of a Protein A bead slurry to remove non-specific contaminants and proteins which may interact with Protein A. Precleared lysate was incubated with 10 μg of GSTP1-1 antibody for 2 h at 4 °C with rocking. Protein A beads were added and the mixture incubated for an additional 2 h at 4 °C. Protein A beads were precipitated by centrifugation, washed five times, and the resultant precipitated material was subjected to Western blot analysis.
Flow cytometry was performed on an EPICs Elite from Beckman/Coulter (Fullerton, CA) using EXPO32 software for both data acquisition and analysis. Cells were excited with a 488 nm argon ion laser and data collected in blue, green, and red channels with appropriate dichroic, band-pass, and long-pass filters for each PMT.
Brightfield and fluorescent images were obtained using a Nikon Optiphot microscope inline with an Spot RT Slider CCD camera from Diagnostics Instruments (Sterling Heights, MI) and Metamorph imaging software from Molecular Devices (Sunnyvale, CA).
Photodynamic treatment of cells
Cells were grown to 80% confluence as outlined above. Media were removed and replaced with fresh media containing 1 μM or no HYP and cells were incubated for an additional 24 h. HYP media were removed and plates were gently washed with PBS. Cells were overlaid with D-MEM minus phenol red indicator and maintained in the dark at 37 °C until treatment. To determine an effective light exposure level, cells were irradiated for 0, 1, 3, 5, and 10 min using a xenon arc lamp fixed 45 cm below each plate. A 590 long-pass and infrared absorbing filter from Reynard Corporation (San Clemente, CA) were placed in-line between plate and light source. The 590 long-pass filter, which excites HYP at its absorbance maximum, acts to prevent non-specific ultraviolet damage to cellular DNA and protein. The infrared absorbing filter acts to prevent non-specific heat damage of the cells. The 5-min timepoint was determined to be the most effective and used in all subsequent experiments. Control samples included untreated cells, those exposed to HYP in the absence of light, and light treatment in the absence of HYP. Following treatment, media, which included detached cells, were removed to 15 ml tubes. Subsequent washes and trypsinized cells from each plate were combined with cells detached during light treatment. Cells were stained with Hoechst 33258 as a measure of cell death and analyzed via flow cytometry.
Synthesis of GST inhibitor SX-324
All chemicals and solvents were obtained from Sigma–Aldrich (Milwaukee, WI). TLC analyses were performed on glass plates precoated with silica gel 60 F254 manufactured by EM Separations (Gibbstown, NJ). Analytical HPLC analyses were done on a Waters 510 HPLC (Phenomenex Jupiter C18 column, 4.6 × 250 mm) using a linear gradient of acetonitrile (5–95% over 30 min) containing 0.1% TFA at a flow rate of 1 ml/min. Positive mode electrospray ionization (ESI-MS) spectra were recorded on a Micromass Quattro II tandem quadrupole mass spectrometer (Manchester, UK).
1,3-Xylylenediamine (0.68 g, 5 mmol), Boc-6-aminohexanoic acid (2.31 g, 10 mmol), N-hydroxybenzotriazole (1.35 g, 10 mmol), and 4-dimethylaminopyridine (6.1 mg, 0.05 mmol) were dissolved in anhydrous DMF (40 ml) under nitrogen. The reaction mixture was cooled in an ice/H2O bath, and 1 M dicyclohexylcarbodiimide in CH2C12 (10 ml) was added via syringe. The reaction was kept at 0 °C for 1 h, then allowed to warm to r.t. and left overnight. The crystalline dicyclohexylurea side product was filtered, and the reaction was concentrated by rotary evaporation. The resulting oil was diluted with EtOAc (50 ml) and washed with H2O, 10% Na2CO3, H2O, 10% cold citric acid, H2O, saturated NaCl, dried over Na2SO4, filtered, and the solvent removed by rotary evaporation. The resulting white solid was recrystallized from hot EtOAc to yield 1.16 g (41%) as a white solid. TLC: Rf (CHCl3/MeOH, 9:1) = 0.26; HPLC: Rt = 27.2 min; ESI-MS: [M + H] = 563.3. The 1,3-(6-Boc-aminohexanoylamino)-xylylenediamine (140 mg, 0.25 mmol) was dissolved in 4 N HCl/dioxane (5 ml) at r.t. for 1 h and then the solvent was removed by rotary evaporation. The residue was dissolved in H2O and lyophilized to yield 105 mg (97%) as a hygroscopic white powder. HPLC: Rt = 13.6 min; ESI-MS: [M + H] = 363.3. The 1,3-(6-aminohexanoylamino)-xylylenediamine dihydrochloride (105 mg, 0.24 mmol) was suspended in anhydrous DMF (5 ml), and diisopropylethylamine (84 ml, 0.48 mmol), ethacrynic acid (145 mg, 0.48 mmol), and N-hydroxybenzotriazole (65 mg, 0.48 mmol) were added. The reaction was placed under nitrogen and cooled in an ice/H2O bath. One molar of dicyclohexylcarbodiimide in CH2C12 (480 μl, 0.48 mmol) was then added via syringe. The reaction mixture was kept at 0 °C for 3 h, then allowed to warm to r.t., and left overnight. The crystalline dicyclohexylurea side product was filtered and the reaction was concentrated by rotary evaporation. The resulting oil was diluted with CH2C12 (10 ml) and washed with H2O, 10% Na2CO3, H2O, 1 N HCl, H2O, saturated NaCl, dried over Na2SO4, filtered, and the solvent removed by rotary evaporation. The crude material was then purified by flash silica gel chromatography with CH2Cl2/MeOH (9:1) as an eluent to yield 87 mg (39%) as a white solid. TLC: Rf (CHCl3/MeOH, 9:1) = 0.72; HPLC: Rt = 33.8 min (92% purity); ESI-MS: [M + H] = 933.1.
Results
GSTP1-1 expression
The cell lines used here have been previously characterized by Harkey et al. [30]. Briefly, The GSTP1-1 gene (GSTP) was placed upstream of the internal ribosome entry site of the bicistronic expression vector, pIRES-GFP (Clontech Laboratories, Palo Alto, CA). This juxtaposition confers coordinate expression of the GST genes with the fluorescent reported green fluorescent protein (GFP) under the control of the CMV immediate early promoter. Cells were then clonally selected by FACS for high GFP fluorescence. The over-expression of GSTP, coordinate with GFP, has been verified at the protein level by Western Blot analysis (Fig. 1). While non-transfected cells exhibited constitutively expressed chromosomal GSTP1-1, the stably transfected cells containing piRES-GFP-GSTP exhibited a 1.5- to 2.5-fold increase in GSTP1-1 compared to pIRES-GFP. The level of GSTP1-1 cytosolic activity, based on the CDNB assay, was 1.7- to 2.0-fold higher than control cytosol from cells transfected with pIRES-GFP, as found previously for these cell lines. The basal levels of GSTA1-1 and GSTM1-1 were also determined by Western analysis. Although both A1-1 and M1-1 isoforms were detectable in these cells, the expression level was approximately 10-fold below P1-1, and it did not vary between pIRES-GFP and pIRES-GFP-GSTP cells (not shown).
Fig. 1.
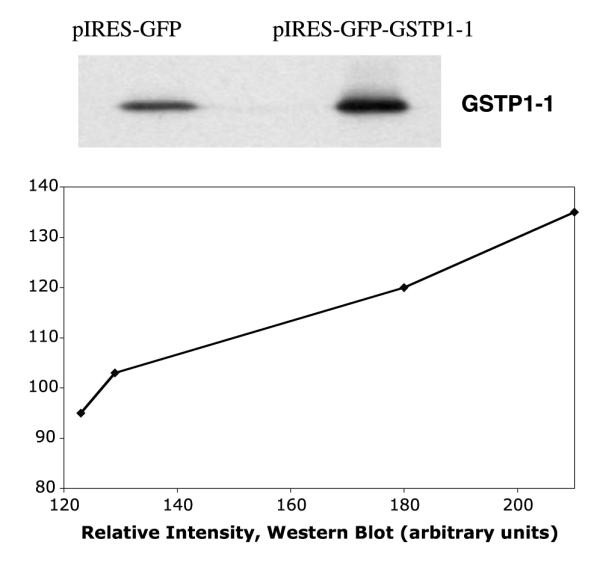
(Top) Western analysis of GSTP1-1 in cytosol from pIRES-GFP (left) and pIRES-GFP-GSTP (right). Each lane contained 50 μg total protein. The latter cell line expresses ~1.7- to 2-fold more GSTP1-1. (Bottom) Correlation between amount of GSTP1-1 detected by Western analysis and by GFP fluorescence, in clonally selected populations obtained by cell sorting. The lines are intended only as a visual aid and do not represent any mathematical relationship.
Attempts to further select for higher GSTP1-1 expression yielded transient populations, in which GFP content correlated well with GSTP1-1 detected by Western analysis (Fig. 1). Notably, in pIRES-GFP cells, the increase in GFP fluorescence associated with sorted cell populations is not matched with an increase in GSTP1-1 content. Thus, the GFP provides a faithful readout of plasmid-encoded GSTP1-1 expression. However, we had access only to a cell sorter with a low capacity. Therefore, only small populations of cells (<104 cells) could be sorted, thus requiring several days or a week to obtain confluent cells. Upon multiple passages, or upon storage as frozen stocks, thinning and reestablishing in culture, the populations reverted to the original ‘average’ expression levels of GFP and GSTP1-1. Therefore, although green fluorescence provided a convenient marker for GSTP1-1 over-expression, it was not possible to study in detail discrete clonally selected ‘subset’ populations with narrow ranges of GSTP1-1 expression.
Cellular uptake of hypericin
The dark sensitivity of cells to HYP was determined by incubating varying concentrations of HYP with late log phase cells (80% confluence) for different time periods. Concentrations of HYP less than 10 μM had no visible effects on cell growth or morphology, when kept in subdued light. Under conditions that did not alter cell growth or appearance, the uptake of HYP, with fluorescence emission at 600-700, was monitored by flow cytometry. At various times of incubation with 1 μM HYP, cells were analyzed by FACS for their red and green fluorescence. Under these conditions, which are not toxic to the cells, there is a modest but significant increase in HYP uptake in cells harboring pIRES-GFP-GSTP compared to pIRES-GFP. The increase in HYP uptake was consistently 1.6- to 2.5-fold compared to pIRES-GFP cells (Fig. 2). This was observed in, at least, five comparative studies between the two cell lines. Interestingly, HYP binds to GSTP1-1 HYP, in vitro, and inhibits catalytic activity with an IC50 of <200 nM [29]. As noted in that work, we observe no candidate products of GSH conjugation with HYP upon exposure to GSTP1-1. HYP is evidently not a substrate for GSTP1-1. However, it forms an inhibitory, reversible complex that is reminiscent of ‘ligandin-type’ GST complexes [26–28]. As noted already, GSTs possess a ‘ligandin’ function in which they bind, but do not metabolize, planar aromatic compounds, most frequently with anionic character. Thus, the increased HYP uptake we observe upon over-expression of GSTP1-1 is analogous to published reports with other dyes.
Fig. 2.
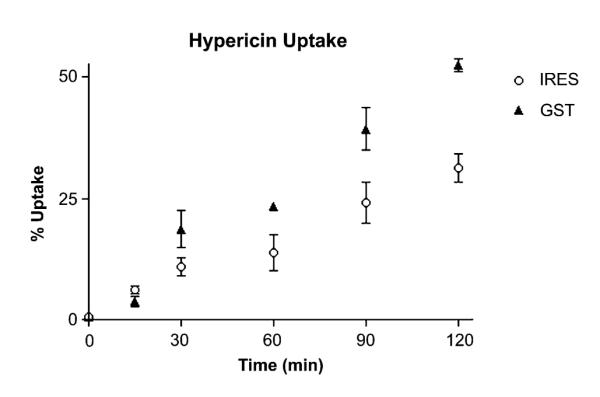
Cellular uptake of HYP. The time-dependent uptake of HYP, as measured by red fluorescence intensity in flow cytometry, is shown. The pIRES-GFP-GSTP cells (closed triangles) exhibit a ~2-fold increase in the rate of HYP uptake compared to pIRES-GFP cells (open circles).
GSTP1-1 interactions with HYP in cell cytosol
The high affinity of GSTP1-1 for HYP [29] could contribute to the observed increase in cellular uptake. In order to determine whether this occurs in intact cells, immunoprecipitation (IP) analysis was performed after treating cells, in the dark, with HYP. Cells were incubated with HYP for varying times, sonicated, and cytosol was treated with anti-GSTP1-1 and Protein A beads, or Protein A beads alone. The resulting pellets were analyzed by Western analysis and the relative fluorescence intensity was determined (Fig. 3). The Western analysis indicated a 1.6-fold increase in GSTP1-1 in pIRES-GFP-GSTP vs pIRES-GFP cells, and an identical 1.6-fold increase in the fluorescence intensity of the precipitated beads. Notably, no fluorescence was detectable in lysates precleared with Protein A beads but not exposed to anti-GSTP1-1. This approach does not provide an absolute measure of HYP concentration in cell because its quantum yield differs depending on the protein it is complexed with [29–31]. Nonetheless, this analysis suggests that some of the HYP in K293 cells is co-localized in the cytosol with GSTP1-1. This is also supported by confocal microscopy (Fig. 4). The results indicate a diffuse distribution of HYP throughout the cytosol. Certainly, some of the HYP in treated cells is in the nuclear and plasma membrane, and not entirely in the cytosol (Fig. 4). Obviously other cytosolic proteins are likely to bind HYP as well, and we do not propose that GSTP1-1 is the sole intracellular target. However, the co-immunoprecipitation results and the confocal microscopy strongly suggest that, among a complex mixture of cellular constituents, GSTP1-1 is one of the major intracellular proteins to which HYP is bound, consistent with the high affinity observed in vitro [29], and with the high expression levels of GSTP1-1 in these cells. Apparently, the combination of high affinity and high GSTP1-1 expression is sufficient to direct a significant fraction of HYP to GSTP1-1.
Fig. 3.
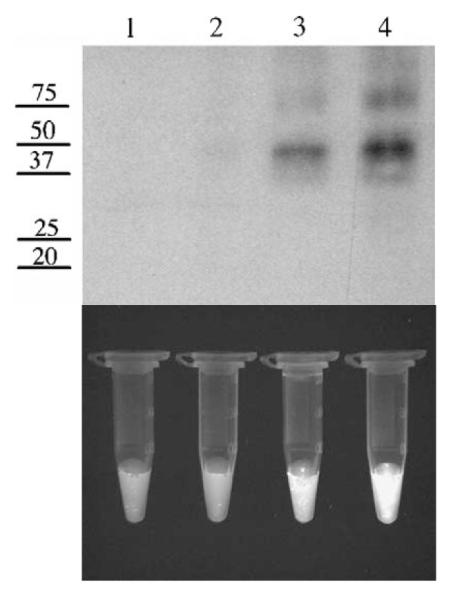
Immunoprecipitation of HYP with GSTP1-1. (Top panel) The numbers on the left refer to MW in kDa. Lane 1, Protein A beads used to preclear IRES-GFP total cell lysate. Lane 2, Protein A beads used to preclear IRES-GFP-GSTP1-1 total cell lysate. Lane 3, anti-GSTP1-1 immunoprecipitate from IRES-GFP lysate. Lane 4, anti-GSTP1-1 immunoprecipitate from IRES-GFP-GSTP1-1 lysate. Densitometry of anti-GSTP1-1 immunoprecipitated proteins indicates a 1.6-fold increase in GSTP1-1 in IRES-GFP-GSTP1-1 lysate (lane 3) compared to IRES-GFP (lane 4). (Bottom panel) Tubes containing equal amounts of Protein A beads from corresponding IP reactions subjected to UV exposure. Based on ImageJ analysis, the fluorescence intensity is 1.6-fold greater in IRES-GFP-GSTP1-1 lysate (lane 4) compared to IRES-GFP (lane 3). No fluorescence is detected in the tubes associated with lanes 1 and 2.
Fig. 4.
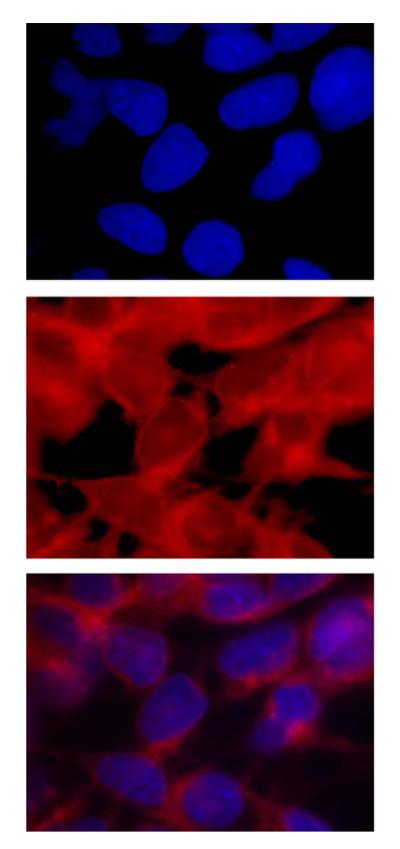
Cytosolic localization of HYP. (Top) Fluorescence microscopy of cells treated with HYP and stained with Hoescht 33342. The top panel shows localization of the stain in nuclei. The second panel is the direct visualization of the HYP, which is in cytosol and nuclear membranes. The third panel shows both HYP and Hoescht 33342. The HYP is excluded from the nuclear matrix, and predominates in the nuclear membrane and the cytosol.
Cell survival observed by microscopy
While attempting to examine the subcellular distribution of HYP via its intrinsic fluorescence, with confocal fluorescence microscopy, we observed that the pIRES-GFP cells directly exposed to the light from the argon laser were released from the plate, whereas the pIRES-GFP-GSTP cells remained. The cell detachment was specifically localized to the field scanned by the laser, clearly demonstrating the dependence of this effect on light. Neither pIRES-GFP nor pIRES-GFP-GSTP cells detached from the plate when scanned in the absence of HYP. The pIRES-GFP-GSTP cells directly within the field scanned by the laser appeared morphologically distinct, but were intact. This light- and HYP-dependent detachment of cells suggested a qualitative difference in the oxidative stress response of the two cell lines, presuming that the released cells were either dead or severely stressed. These observations prompted studies to quantitatively assess cellular survival.
Cell survival by flow cytometry
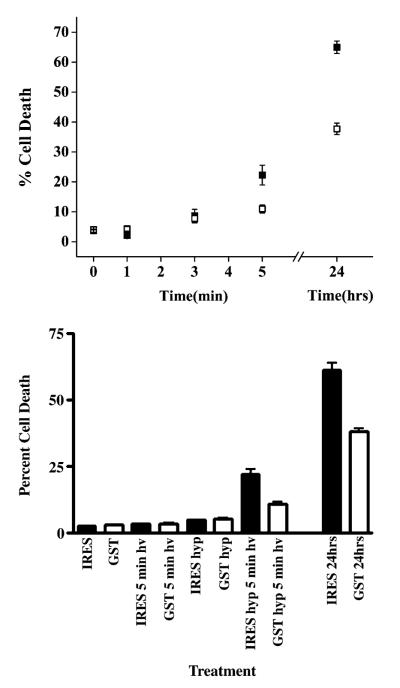
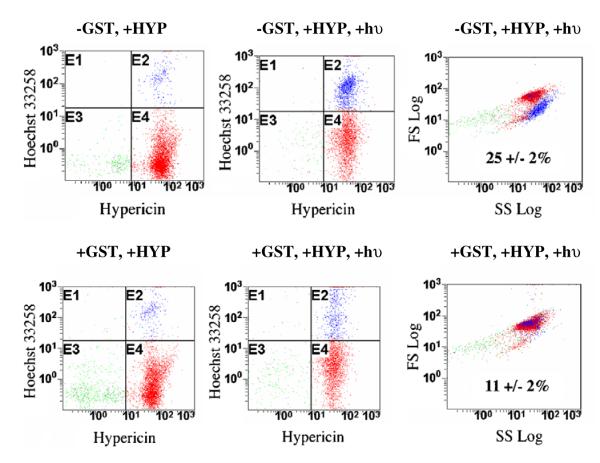
In order to quantitatively examine the effects of GSTP1-1 over-expression on HYP-dependent oxidative stress, cells exposed to HYP for 12 h were subsequently subjected to flow cytometry to assess HYP-dependent cell death, or irradiated for varying times with a mercury lamp fixed above a culture dish, with light at >400 nm. In the absence of irradiation, HYP had no effect on cell survival; no increase in the number of dead cells above a negligible background was observed. After irradiation, cells were analyzed within 2 h by flow cytometry using uptake of the cell membrane-impermeant DNA fluorochrome Hoechst 33258 to measure cell death. Fig. 5 demonstrates the irradiation time-dependent cell death, at a fixed concentration of HYP (5 μM). Under these conditions, both cell lines experience HYP-dependent, light-dependent cell death. However, the pIRES-GFP-GSTP cells exhibited 50% decrease in cell death after 5 min. Furthermore, this increased survival persisted for at least 24 h, based on the flow cytometry of cells that were cultured after the irradiation. The flow cytometry data for the 5-min light exposure are shown in Fig. 6, including plots of forward scatter vs side scatter. These plots clearly show increased survival for the cell over-expressing GSTP1-1 and a different cellular morphology for the subpopulation of dead cells in the pIRES-GFP cells, which is absent in the pIRES-GFP-GSTP cells.
Fig. 5.
Light- and Hyp-dependence of cell death. Cell death was quantified by treating cells with Hoescht 33258 and a measurement of the blue intensity by flow cytometry. (Top) Cells were treated with l μM HYP for 24 h and irradiated for 0, 1, 3, or 5 min before analysis. Cells irradiated for 5 min were also analyzed 24 h after treatment (24 h, far right). Closed squares, IRES-GFP cells. Open squares, IRES-GFP-GSTP1-1 cells. (Bottom) Cells were either irradiated for 5 min in the absence of HYP, treated with HYP for 24 h but not irradiated, or treated with HYP for 24 h and irradiated for 5 min, prior to quantitation of cell death by flow cytometry. The HYP-treated cells that were irradiated were also analyzed 24 h after treatment (far right). Cell death requires both HYP and light.
Fig. 6.
Flow cytometry analysis of cell survival. The red fluorescence intensity (Hypericin, x-axis) is plotted vs the blue fluorescence intensity (Hoescht 33258 y-axis). In the absence of light (left panels), the cell populations are essentially identical, with no significant cell death. Upon irradiation in the presence of HYP (center panels), a distinct population of dead cells is apparent only in the pIRES-GFP cells (−GSTP1-1, panel E2). A plot of side scatter intensity vs forward scatter intensity (right panels) indicates that the survivors and the dead cells are morphologically distinct. The percentages are the percent of cell death based on intensity of blue fluorescence. (For interpretation of the references to color in this figure legend, the reader is referred to the web version of this paper.)
Effect of a GST inhibitor
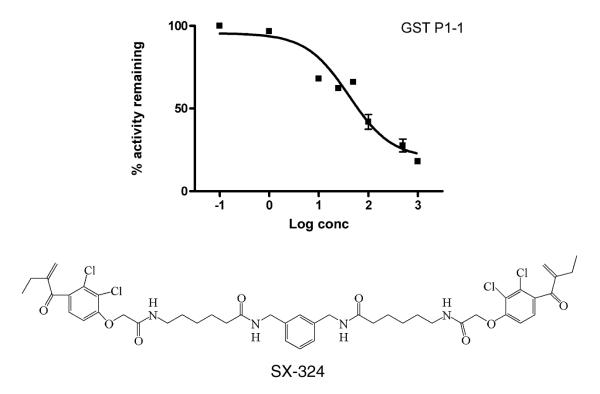
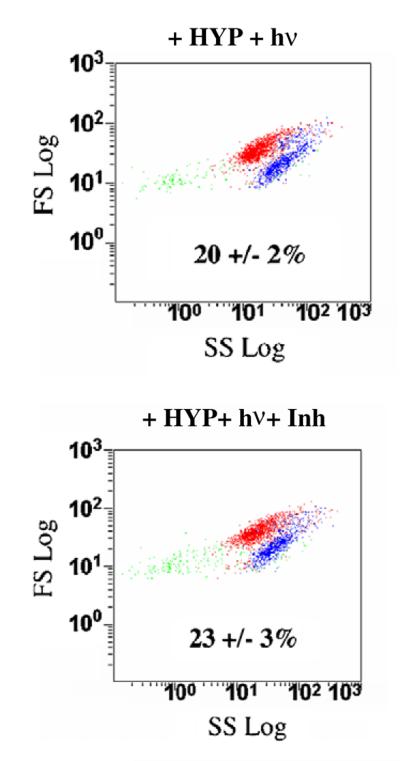
In order to further explore the role of GSTP1-1 in the cellular response to PDT with HYP, a tight-binding GST inhibitor was used. This inhibitor, SX-324, has not been previously characterized, so fundamental in vitro studies with this compound are included here. This bivalent inhibitor (Syntrix Biosystems, Inc., Fig. 7) is based on a published design strategy [32], exhibits an IC50 of 40 ± 16 and 34 ± 7 nM in vitro experiments with GSTP1-1 and with GSTA1-1, respectively, and thus represents the most potent general GST inhibitor known to date. Its design is based on ethacrynic acid, which is a well-known and thoroughly characterized inhibitor of GSTP1-1. The bivalent EA analog includes an aliphatic linker designed to span the intersubunit cleft of GSTP1-1 [33]. A full characterization of SX-324 and structural analogs will be provided elsewhere, but its introduction here was to evaluate the effect of a high affinity GSTP1-1 inhibitor. Incubation of cells with inhibitor for 1 h prior to HYP treatment resulted in a concentration-dependent reversal of the GSTP1-1-dependent resistance to HYP and light (Table 1). At the highest concentration of SX-324 used in culture (1 μM), no effects on cell morphology or survival were observed. Flow cytometry was performed as described above, and the percent of cell survival was determined with Hoechst 33258. The results (Fig. 8) indicate that SX-324 completely reversed the protective effect of GSTP1-1. The inhibitor-treated cells behaved essentially identical to the pIRES-GFP control cells.
Fig. 7.
Inhibition of GSTP1-1 by the inhibitor SX-324, used in cell survival studies. The activity of GSTP1-1 with CDNB as substrate was measured at carrying concentrations of SX-324. The IC50 is 40 ± 16 nM. The structure of SX-324 is shown.
Table 1.
Effects of GSTP1-1 inhibitor on cell survival
| Cells/conditions | Percent cell death |
|---|---|
| pIRES-GFP + inhibitor | 96.1 ± 0.03 |
| pIRES-GFP-GSTP + inhibitor | 95.7 ± 0.6 |
| pIRES-GFP + light + HYP | 24.6 ± 2.3 |
| pIRES-GFP-GSTP + light + HYP | 11.7 ± 2.1 |
| pIRES-GFP + light + HYP + inhibitor | 20.1 ± 2.3 |
| pIRES-GFP-GSTP + light + HYP + inhibitor | 21.9 ± 2.6 |
Fig. 8.
An inhibitor reverses the effect of GSTP1-1. Cells were incubated with the GSTP1-1 inhibitor (1 μM) for 12 h followed by HYP and light treatment. The inhibitor restores cell sensitivity to HYP-dependent PDT. The percentages are the percent cell death based on intensity of blue fluorescence. (For interpretation of the references to color in this figure legend, the reader is referred to the web version of this paper.)
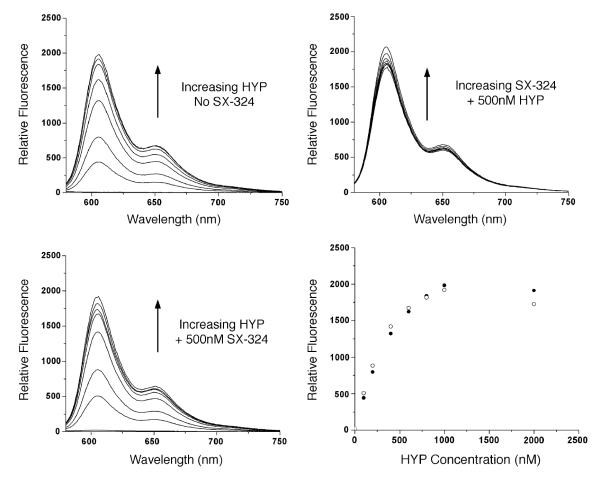
The inhibitor also provides a mechanistic probe. If SX-324 competitively displaces HYP from its binding site, then the observed effects of the inhibitor in cell culture could reflect a redistribution of HYP, leading to ‘release’ from the passivating effects of GSTP1-1 on the ROS. Alternatively, if SX-324 did not competitively displace HYP from its binding site on GSTP1-1, then its ability to reverse the effects of HYP would suggest a mechanism other than passivation of HYP via Ligandin-type binding. Therefore, we conducted in vitro titrations of SX-324 with GSTP1-1 preloaded with HYP and titrations of HYP with GSTP1-1 in the presence and absence of a single concentration of SX-324. HYP fluorescence is increased dramatically (~40-fold) when bound to GSTP1-1 compared to freeing aqueous solution, so it is straightforward to monitor binding. This titration reveals that up to 1 mM SX-324 no HYP is displaced from preloaded GSTP1-1, and titrations of HYP are nearly superimposable in the absence of SX-324 or in the presence of 500 nM SX-324 (Fig. 9). The data indicate that SX-324 is incapable of displacing HYP from its binding site on GSTP1-1. This suggests that the GSTP1-1-dependent cellular resistance to PDT is not caused directly by the sequestration of HYP.
Fig. 9.
Competitive binding titrations with HYP and SX-324. (Top left) Titration of GSTP1-1 with increasing HYP. The fluorescence of HYP increases. The concentrations of HYP were 10, 20, 50, 100, and 300 nM. (Bottom left) Identical titration in the presence of 500 nM SX-324. The inhibitor has no effect on the concentration-dependent fluorescence of HYP. (Top right) Titration of SX-324 in a sample with 500 nM HYP. The inhibitor does not displace the HYP. (Bottom right) Equilibrium binding isotherm of HYP in the presence and absence of SX-324. The isotherms are identical. SX-324 does not displace HYP from GSTP1-1.
Discussion
Photodynamic therapy is a relatively new cancer treatment modality, which provides a mechanism for tumor cell specificity not available with standard chemotherapy. However, detailed mechanistic information is sparse for many PDT sensitizers, and tissue-specific responses are not completely characterized. One mechanistic feature that appears certain is the induction of oxidative stress in cells targeted by PDT. Therefore, we hypothesized that GSTs could be a confounding variable in PDT, due to their over-expression in many tumors and their anti-oxidative stress functions. We further hypothesize that different GST isoforms will modulate PDT efficacy by different mechanisms, including Jun kinase inhibition, catalytic clearance of lipid peroxidation products, and possibly by passive sequestration.
In order to examine some of these possible effects, HK293 harboring pIRES-GFP-GSTP were used as a model for over-expression of GSTP1-1. One significant experimental result shown in this work is that over-expression of GSTP1-1 can be associated with increased uptake of HYP. This correlation suggests, but does not prove, that GSTP1-1 may ‘sequester’ HYP through a passive-binding mechanism analogous to ‘ligandin’-type behavior. Such behavior is well established for several GSTs, including GSTP1-1 that bind planar aromatic anions, steroids, porphyrins, and other dyes [26–29,33]. In fact, HYP binds with high affinity to GSTP1-1 in vitro [29], and apparently in vivo (Fig. 3). It is also possible that over-expression of GSTP1-1 causes a change in the expression of transport proteins, and thus alters the steady-state levels of intracellular HYP. Alternatively, the oxidative stress caused by PDT could lead to higher levels of lipid peroxidation products and GSH conjugates. These, in turn, could compete with HYP for transporter sites, thus leading to an increased intracellular concentration of HYP. Regardless of the mechanism of this increased cellular uptake, it is paradoxical in light of the simultaneous cellular resistance to HYP and light that accompanies GSTP1-1 over-expression. Intuitively, increased uptake should lead to increased sensitivity to HYP and light.
The data included here demonstrate that there is a negative correlation between the level of GSTP1-1 expression and cell death caused by HYP-dependent PDT. The flow cytometry experiments, together with the microscopy, suggest morphological differences and increased survival in cells with greater expression of GSTP1-1, even though these cells accumulate more of the sensitizer. This is a particularly interesting result with potential implications for PDT. This paradox underscores the complexity of possible effects of GSTs as a confounding variable is cellular response to PDT, and also suggests the possibility that cells over-expressing GSTP1-1 could protect neighboring cells from HYP-dependent PDT by sequestering the photosensitizer while remaining viable.
The effects on cell survival and uptake are both modest, with ~2- to 2.5-fold increases upon a similar 2-fold increase in GSTP1-1 levels. This agreement may be coincidental, but it is notable that even a modest 2-fold increase in GSTP1-1 expression can have a detectable effect on cell survival. This is important because many cancer cells only modestly over-express GSTP1-1. In many cases, the reported over-expression is only 2- to 5-fold over the corresponding non-cancerous cells [13,34]. Thus, even modest increases in GSTP1-1 could be sufficient to alter the cellular response to PDT and the therapeutic efficacy. By extension, it is important that pharmacological intervention with a GSTP1-1 inhibitor resulted in improved PDT efficacy. This suggests that clinical PDT may be optimized by simultaneous use of appropriate GST inhibitors.
Our results are interesting in comparison with the previously published work with these cell lines [30], wherein GSTP1-1 did not provide any survival advantage upon exposure to melphalan. In contrast, over-expression of the microsomal GST MGSTII did provide resistance. Clearly, different GST isoforms differentially protect cells from various sources of oxidative or chemical stress. In fact, it remains possible that other GST isoforms could provide even greater resistance to PDT with HYP than the GSTP1-1.
The mechanistic basis for the observed effects of GSTP1-1 on HYP-dependent PDT remains unknown. One possibility is that HYP is sequestered by GSTP1-1, which is known to passivate the oxidative potential of HYP. However, the inhibitor studies suggest that this is not the sole basis for GSTP1-1-dependent cellular resistance to HYP. Alternatively, the increased expression of GSTP1-1 could inhibit JunK, in turn slowing down the apoptotic response to the PDT [13,14]. Interestingly, the flow cytometry data reveal a decrease in intensity of the side scatter relative to forward scatter in the ‘dead’ cells that stain blue. In some cases, this can be a fingerprint for apoptosis, but in the absence of additional studies explicitly utilizing markers for apoptosis/necrosis, this remains to be demonstrated. Obviously, further work is required to determine the detailed mechanism of GSTP1-1-dependent resistance to PDT with HYP.
Footnotes
This work was supported by NIH Grants GM62284 (W.M.A.), and the UW sponsored Center for Ecogenetics and Environmental Health NIE-HSP30ES07033.
Abbreviations used: HYP, hypericin; GST, glutathione S-transferase; PDT, photodynamic therapy; JunK, cJun N-terminal kinase; MAPK, microtubule-associated protein kinase; EDTA, ethylenediaminetetraacetic acid; ROS, reactive oxygen species; PBS, phosphate-buffered saline; FBS, fetal bovine serum; Ask-1, apoptosis signaling kinase 1.
References
- [1].Moan J, Peng Q. Anticancer Res. 2003;23:3591–3600. [PubMed] [Google Scholar]
- [2].Zeitouni NC, Oseroff AR, Shiejh S. Mol. Immunol. 2003;39:1133–1136. doi: 10.1016/s0161-5890(03)00083-x. [DOI] [PubMed] [Google Scholar]
- [3].Capella MA, Capella LS. J. Biomed. Sci. 2003;10:361–366. doi: 10.1007/BF02256427. [DOI] [PubMed] [Google Scholar]
- [4].Agostinis P, Vantieghem A, Merlevede W, de Witte PA. Int. J. Biochem. Cell Biol. 2002;34:221–241. doi: 10.1016/s1357-2725(01)00126-1. [DOI] [PubMed] [Google Scholar]
- [5].Piette J, Volanti C, Vantieghem A, Matroule JY, Habraken Y, Agostinis YP. Biochem. Pharmacol. 2003;66:1651–1659. doi: 10.1016/s0006-2952(03)00539-2. [DOI] [PubMed] [Google Scholar]
- [6].Greeson JM, Sanford B, Monti DA. Psychopharmacology. 2001;153:402–414. doi: 10.1007/s002130000625. [DOI] [PubMed] [Google Scholar]
- [7].Ali SM, Chee SK, Yuen GY, Olivo M. Int. J. Mol. Med. 2002;9:461–472. [PubMed] [Google Scholar]
- [8].Kamuhabwa AA, Roskams T, D’Hallewin MA, Baert L, Van Poppel H, de Witte PA. Int. J. Cancer. 2003;107:460–467. doi: 10.1002/ijc.11396. [DOI] [PubMed] [Google Scholar]
- [9].Agostinis P, Assefa Z, Vantiegheeede A, Vandenheede JR, Merlevede W, De Witte P. Adv. Enzyme Regul. 2000;40:157–182. doi: 10.1016/s0065-2571(99)00021-7. [DOI] [PubMed] [Google Scholar]
- [10].Tong Z, Singh G, Valerie K, Rainbow AJ. J. Photochem. Photobiol. B. 2003;71:77–85. doi: 10.1016/j.jphotobiol.2003.08.001. [DOI] [PubMed] [Google Scholar]
- [11].Ketterer B. Chem. Biol. Interact. 2001;138:27–42. doi: 10.1016/s0009-2797(01)00277-0. [DOI] [PubMed] [Google Scholar]
- [12].Armstrong RN. Curr. Opin. Chem. Biol. 1998;2:618–623. doi: 10.1016/s1367-5931(98)80093-8. [DOI] [PubMed] [Google Scholar]
- [13].Tew KD, Monks A, Barone L, Rosser D, Akerman G, Montali JA, Wheatley JB, Schmidt DE. Mol. Pharmacol. 1996;50:149–159. [PubMed] [Google Scholar]
- [14].Shen H, Kauvar L, Tew KD. Oncol. Res. 1997;9:295–302. [PubMed] [Google Scholar]
- [15].Kauvar LM, Morgan AS, Sanderson PE, Henner WD. Chem. Biol. Interact. 1998;111-112:225–238. doi: 10.1016/s0009-2797(97)00163-4. [DOI] [PubMed] [Google Scholar]
- [16].Yin Z, Ivanov VN, Habelhah H, Tew KD, Ronai Z. Cancer Res. 2000;60:4053–7405. [PubMed] [Google Scholar]
- [17].Wang T, Arifoglu P, Ronai Z, Tew KD. J. Biol. Chem. 2001;276:20999–21003. doi: 10.1074/jbc.M101355200. [DOI] [PubMed] [Google Scholar]
- [18].Ruscoe JE, Rosario LA, Wang T, Gate L, Arifoglu P, Wolf CR, Henderson CJ, Ronai Z, Tew KD. Pharmacol. Exp. Ther. 2001;298:339–345. [PubMed] [Google Scholar]
- [19].Gate L, Majumdar RS, Lunk A, Tew KD. J. Biol. Chem. 2004;279:8608–8616. doi: 10.1074/jbc.M308613200. [DOI] [PubMed] [Google Scholar]
- [20].Cheng JZ, Singhal SS, Sharma A, Saini M, Yang Y, Awasthi S, Zimniak P, Awasthi YC. Arch. Biochem. Biophys. 2001;392:197–207. doi: 10.1006/abbi.2001.2452. [DOI] [PubMed] [Google Scholar]
- [21].Yang Y, Cheng JZ, Singhal SS, Saini M, Pandya U, Awasthi S, Awasthi YC. J. Biol. Chem. 2001;276:19220–19230. doi: 10.1074/jbc.M100551200. [DOI] [PubMed] [Google Scholar]
- [22].Engle MR, Singh SP, Czernik PJ, Gaddy D, Montague DC, Ceci JD, Yang Y, Awasthi S, Awasthi YC, Zimniak P. Toxicol. Appl. Pharmacol. 2004;194:296–308. doi: 10.1016/j.taap.2003.10.001. [DOI] [PubMed] [Google Scholar]
- [23].Zhao T, Singhal SS, Piper JT, Cheng J, Pandya U, Clark-Wronski J, Awasthi S, Awasthi YC. Arch. Biochem. Biophys. 1999;367:216–224. doi: 10.1006/abbi.1999.1277. [DOI] [PubMed] [Google Scholar]
- [24].Awasthi YC, Sharma R, Cheng JZ, Yang Y, Sharma A, Singhal SS, Awasthi S. Mol. Aspects Med. 2003;24:219–230. doi: 10.1016/s0098-2997(03)00017-7. [DOI] [PubMed] [Google Scholar]
- [25].Cao Z, Hardej D, Trombetta LD, Li Y. Cardiovasc. Toxicol. 2003;3:165–177. doi: 10.1385/ct:3:2:165. [DOI] [PubMed] [Google Scholar]
- [26].Ahmad H, Singh SV, Awasthi YC. Lens Eye Toxic. Res. 1991;8:431–440. [PubMed] [Google Scholar]
- [27].Smith A, Nuiry I, Awasthi YC. Biochem. J. 1985;229:823–831. doi: 10.1042/bj2290823. [DOI] [PMC free article] [PubMed] [Google Scholar]
- [28].Tipping E, Ketterer B, Koskelo P. Biochem. J. 1978;169:509–516. doi: 10.1042/bj1690509. [DOI] [PMC free article] [PubMed] [Google Scholar]
- [29].Lu WD, Atkins WM. Biochemistry. 2004;43:12761–12769. doi: 10.1021/bi049217m. [DOI] [PubMed] [Google Scholar]
- [30].Harkey MA, Czerwinkski M, Slattery J, Kiem HP. Cancer Invest. 2005;23:19–25. [PubMed] [Google Scholar]
- [31].Lend F, Angelini N, Ghetti F, Sgarbossa A, Losi A, Vecli A, Viappiani C, Taroni P, Pifferi A, Cubeddu R. Photchem. Photobiol. 1995;62:199–204. doi: 10.1111/j.1751-1097.1995.tb05259.x. [DOI] [PubMed] [Google Scholar]
- [32].Lyon R, Hill JJ, Atkins WM. Biochemistry. 2003;42:10418–10424. doi: 10.1021/bi0346188. [DOI] [PubMed] [Google Scholar]
- [33].Oakley AJ, Lo Bello M, Battistoni A, Ricci G, Rossjohn J, Villar HO, Parker MW. J. Mol. Biol. 1997;274:84–100. doi: 10.1006/jmbi.1997.1364. [DOI] [PubMed] [Google Scholar]
- [34].Hayes JD, Pulford DJ. Crit. Rev. Biochem. Mol. Biol. 1995;30:445–600. doi: 10.3109/10409239509083491. [DOI] [PubMed] [Google Scholar]


