Abstract
Macroscopic modeling of singlet oxygen (1O2) is of particular interest because it is the major cytotoxic agent causing biological effects for type II photosensitizers during PDT. We have developed a macroscopic model to calculate reacted singlet oxygen concentration ([1O2]rx for PDT. An in-vivo RIF tumor mouse model is used to correlate the necrosis depth to the calculation based on explicit PDT dosimetry of light fluence distribution, tissue optical properties, and photosensitizer concentrations. Inputs to the model include 4 photosensitizer specific photochemical parameters along with the apparent singlet oxygen threshold concentration. Photosensitizer specific model parameters are determined for several type II photosensitizers (Photofrin, BPD, and HPPH). The singlet oxygen threshold concentration is approximately 0.41 – 0.56 mM for all three photosensitizers studied, assuming that the fraction of singlet oxygen generated that interacts with the cell is (f = 1). In comparison, value derived from other in-vivo mice studies is 0.4 mM for mTHPC. However, the singlet oxygen threshold doses were reported to be 7.9 and 12.1 mM for a multicell in-vitro EMT6/Ro spheroid model for mTHPC and Photofrin PDT, respectively. The sensitivity of threshold singlet oxygen dose for our experiment is examined. The possible influence of vascular vs. apoptotic cell killing mechanism on the singlet oxygen threshold dose is discussed using the BPD with different drug-light intervals 3 hrs vs. 15 min. The observed discrepancies between different experiments warrant further investigation to explain the cause of the difference.
Keywords: photodynamic therapy, singlet oxygen production, oxygen dependence of singlet oxygen quantum yield
1. Introduction
Photodynamic therapy (PDT) is an anti-cancer treatment modality based on the interaction of light, a photosensitizing drug, and oxygen.1 PDT has been approved by the US Food and Drug Administration for the treatment of microinvasive lung cancer, obstructing lung cancer, and obstructing esophageal cancer and Barrett's esophagus with high grade dysplasia, as well as for age-related macular degeneration and actinic keratosis.2
Photodynamic therapy is inherently a complex process in which the PS, light and oxygen vary dynamically and interdependently on timescales specific to an individual treatment condition. Thus, the distribution of light is determined by the light source characteristics and the effective tissue optical absorption and scattering at the treatment wavelength. The effective absorption is affected by the local concentration of PS and the concentration and oxygenation status of the blood. The oxygen distribution is altered by photodynamic consumption and any PDT-induced changes in blood flow3. The effective PS concentration and distribution may change due to photobleaching. These effects make accurate PDT dosimetry extremely challenging, but this is critical to achieve optimal efficacy and safety, particularly when there is curative intent, as demonstrated in several tumor sites 4,5. For type-II PSs, excited-state singlet oxygen (1O2), the major cytotoxic species causing biological effects, is generated upon the absorption of light by the PS in the presence of ground-state molecular oxygen (3O2). Thus, direct measurement of 1O2 constitutes the ultimate PDT dosimetry method to correlate with PDT outcome. The production of singlet oxygen that has damaged the tissue can be expressed as: 6
| (1) |
where f depends on the localization of the photosensitizer at the cell level and thus depends on the photosensitizer and tissue types, the singlet oxygen quantum yield η gives the number of singlet oxygen molecules produced per an absorbed photon, which is a constant under ample oxygen supply. However, when insufficient oxygen supply exists, η is also a function of the oxygen concentration, or pO2, in tissue. D is the PDT dose defined as the number of photons absorbed by the PS, ɛ[S0]φ/ν, where [S0] is the PS concentration, φ is the total fluence, and ɛ is the extinction coefficient of PS. ρ is the mass density of the tissue so that ρD is in unit of ph/cm3. The purpose of this study is to estimate the magnitude of the threshold singlet oxygen concentration where tissue necrosis occurs in in-vivo model.
2. Method
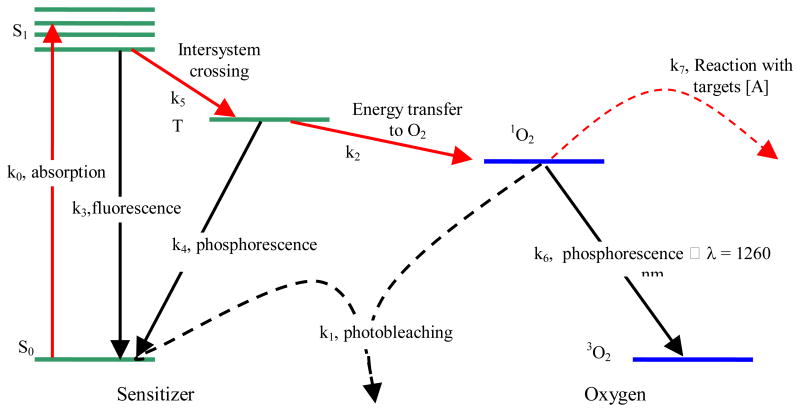
Most photosensitizers available for PDT utilize Type II photodynamic processes, i.e., the photodynamic effect is achieved through the production of singlet oxygen.7,8 The energy level diagram shown in Fig. 1 summarizes the underlying physical processes involved in type-II PDT. The process begins with the absorption of a photon by photosensitizer in its ground state, promoting it to an excited state. The photosensitizer molecule can return to its ground state by emission of a fluorescence photon, which can be used for fluorescence detection. Alternatively, the molecule may convert to a triplet state, a process known as intersystem crossing (ISC). A high intersystem-crossing yield is an essential feature of a good Type II photosensitizer. Once in its triplet state, the molecule may undergo a collisional energy transfer with ground state molecular oxygen (type II) or with the substrate (type I). In type II interaction, the photosensitzer returns to its ground state, and oxygen is promoted from its ground state (a triplet state) to its excited (singlet) state. Since the photosensitizer is not consumed in this process, the same photosensitizer molecule may create many singlet oxygen molecules.
Figure 1.
Jablonksi diagram of photosensitized singlet oxygen formation by Type II photosensitizer. The rate constants for monomolecular transition (solid lines) and bimolecular energy transfer (dashed lines) are indicated.
Once the singlet oxygen is created, it reacts almost immediately with cellular targets in its immediate vicinity. The majorities of these reactions are irreversible, and lead to consumption of oxygen. This consumption of oxygen is efficient enough to cause measurable decreases in tissue oxygenation when the incident light intensity is high enough. In addition to its reactions with cellular targets, singlet oxygen may react with the photosensitizer itself. This leads to its irreversible destruction (photobleaching). Photobleaching can decrease the effectiveness of PDT by reducing the photosensitizer concentration, however it can also be useful for dosimetry.9 Because of its high reactivity, singlet oxygen has a very short lifetime in tissue. However, a small fraction of the singlet oxygen produced may return to its ground state via emission of a phosphorescence photon, which can be detected optically.10,11 We use ki (i = 0, 1, …, 7) to designate the reaction rate. The definitions associated with the reaction rates are summarized in Table 1.
Table 1. Parameters used in the macroscopic kinetics equations for several photosensitizers.
| Symbol (unit) | Definition 12 |
|---|---|
| k0 (1/s) | Photon absorption rate of photosensitizer per photosensitizer concentration, k0 = ɛφ/hν, φ is the light fluence rate |
| k1 (1/s/μM) | Bimolecular rate for 1O2 reaction with ground-state photosensitizer |
| k2 (1/s/μM) | Bimolecular rate of triplet photosensitizer quenching by 3O2 |
| k3 (1/s) | Decay rate of first excited singlet state photosensitizer to ground state photosensitizer |
| k4 (1/s) | Rate of monomolecular decay of the photosensitizer triplet state |
| k5 (1/s) | Decay Rate of first excited state photosensitizer to triplet state photosensitizer |
| k6 (1/s) | 1O2 to 3O2 decay rate |
| k7 (1/s/μM) | Bimolecular rate of reaction of 1O2 with biological substrate [A] |
| Symbol | Definition | Value | References | |
|---|---|---|---|---|
| SΔ(k5/(k5+k3)) | Singlet oxygen quantum yield | Photofrin, ALA-PPIX: 0.56 mTHPC: 0.65 BPD: 0.76 HPPH: 0.48 |
13 13 13 14 |
|
| δ(μM) | Low concentration correction | Photofrin, ALA-PPIX: 33 mTHPC: 33 BPD: 33 HPPH: 33 |
15 15 15 15 |
|
| ɛ (cm/μM) | Extinction coefficient of photosensitizer | Photofrin, ALA-PPIX (630nm): 0.0035 mTHPC (650 nm): 0.048 BPD (690 nm): 0.034 HPPH (665 nm): 0.047 |
13 16 17 14 |
|
| ξ (cm2 mW-1 s-1) |
|
Photofrin: 3.7 × 10⁻³ Photofrin: (2.9±0.8) × 10-3 mTHPC: 30 × 10-3 ALA-PpIX: 3.7 × 10⁻³ BPD: (25 ± 11) × 10-3 HPPH: (33 ± 3) × 10-3 |
18,19 fitted value 18 ** fitted value fitted value |
|
| δ (μM-1) | k1/k7[A] | Photofrin: 7.6 × 10⁻⁵ Photofrin: (8.4±0.8) × 10-5 mTHPC: 2.97 × 10⁻⁵ ALA-PpIX: 9 × 10⁻⁵ BPD: (1.8±0.8) × 10-5 HPPH: (1.0±0.2) × 10-5 |
19 fitted value 18 20 fitted value fitted value |
|
| g (μM/s) | Macroscopic oxygen max perfusion rate | Photofrin: 0.76 Photofrin: 0.71±0.06 BPD: 1.32±0.7 HPPH: 1.3±0.4 |
21 fitted value fitted value fitted value |
|
| β(μM) | k4/k2 | Photofrin, ALA-PPIX*: 11.9 mTHPC: 8.7 BPD: 11.9 HPPH: 11.9 |
19 18 * * |
These photochemical parameters are currently not available in the literature; we have taken the value of Photofrin.
The parameter ξ are obtained using the study of Georgakoudi et al.19 and Mitra et al.18 from tumor spheroid studies, where ξ equals to βPDT/[S0], βPDT is a proportional constant between photochemical oxygen consumption rate and the fluence rate.18 ξ is either calculated according to the βPDT value from the literature 18,19,22 or based on the current mouse studies (fitted value).
2.1 Macroscopic kinetics rate equations
We adopted the rate equation approach first proposed by Foster et al 23 and later refined by Hu et al 24 to describe the PDT kinetics processes. The complete set of rate equations are published elsewhere.12,21 The life time of the singlet and triplet states of photosensitizer ([S1] and [T]) and the singlet oxygen (1O2) are very short (ns – μs time scale) since they either decay or react with cellular targets immediately after they are created. Thus, it is reasonable to set the time dependences, d[S1]/dt, d[T]/dt, and d[1O2]/dt to be zero. The simplified rate equations can be expressed as: 12,21
| (2) |
| (3) |
| (4) |
| (5) |
Here the reacted singlet oxygen concentration is defined as and is consistent with the definition in Eq. 1. Using Eq. 5, we can recover Eq. 1 with . Parameters for the rate equations are listed in Table 1 for several photosensitizers. The corresponding expressions for the instantaneous singlet oxygen, singlet, and triplet states of PS are:
| (6) |
| (7) |
| (8) |
The rate equations are implemented in the Matlab code. The calculation time is in seconds for the rate equation alone and minutes for the time and spatially coupled differential equations.
2.2 Mice necrosis experiment to determine singlet oxygen threshold dose
We have performed necrosis studies in mice to determine the necrosis generated by three photosensitizers (Photofrin, BPD, and HPPH) in RIF tumor model. Table 2 summarizes the conditions for the PDT.
Table 2. Parameters for the PDT experiments in RIF tumor model.
| Photosensitizers | HPPH | BPD | Photofrin |
|---|---|---|---|
| Incubation time | 24 hrs | 3 hrs | 24 hrs |
| Drug concentration | 0.25 mg/kg | 1 mg/kg | 5 mg/kg |
| Light wavelength | 665 nm | 690 nm | 630 nm |
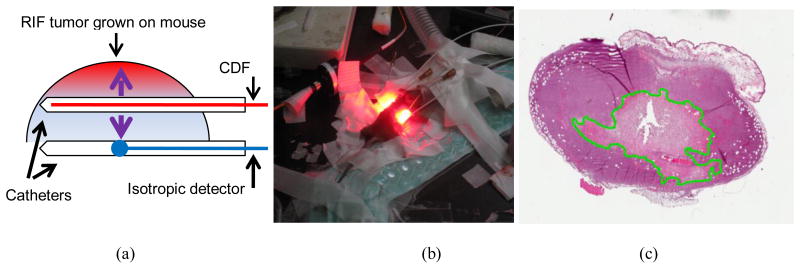
RIF tumor was grown on the shoulder. PDT was performed using 1-cm long cylindrical diffusing fiber (CDF) to deliver light with various fluence rate and total treatment time.21 The mice were sacrificed at 24 hours after PDT and the tumor is resected perpendicular to the CDF. Experimental setup and an example of H&E staining of RIF tumor resection were shown in Fig. 2.
Figure 2.
The mouse necrosis experiment: (a) Schematics of treatment catheter and isotropic detectors used to measure the light fluence rate, tissue optical properties, and photosensitizer drug concentrations; (b) A picture of mice undergoing PDT; (c) The resulting tumor H&E staining slides with the necrosis edge delineated.
3. Results and Discussion
3.1 Macroscopic modeling of singlet oxygen threshold dose
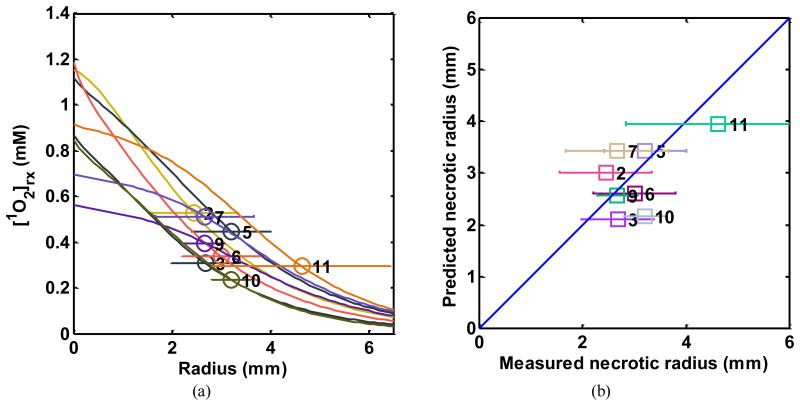
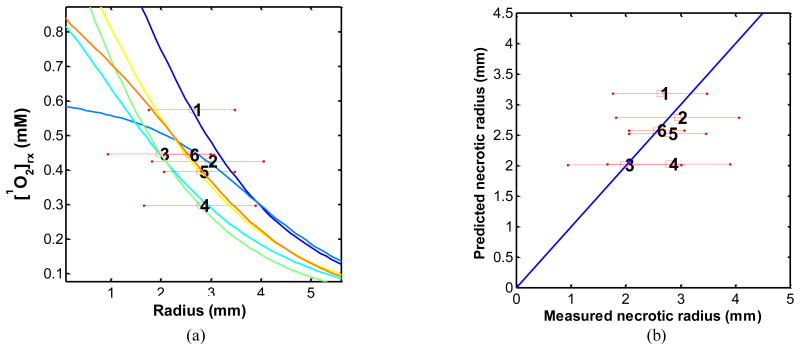
Figures 3 - 5 show the fitting results of (a) the reacted singlet oxygen production [1O2]rx vs. necrosis depth and (b) comparison of predicted and measured necrosis depths for Photofrin, BPD, and HPPH: The resulting fitting parameters are listed in Table 1.
Figure 3.
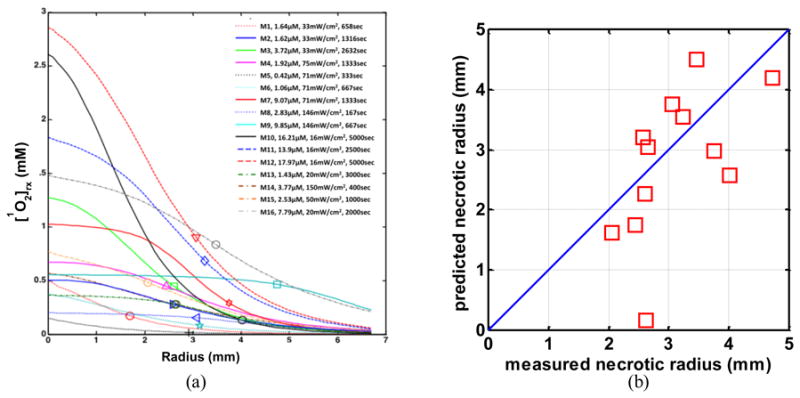
(a) [1O2]rx profiles for 16 mice using the model parameters (ξ, σ, β, g) in Table 1 for Photofrin. The corresponding initial photosensitizer concentration, source strength, and total treatment time for each mouse are shown in the legend. The symbol indicates the PDT-induced necrotic radius. The standard deviation for each mouse is 0.5 mm. (b) PDT-induced necrotic radius predicted vs. measured for mice shown in figure (a).
Figure 5.
(a) [1O2]rx profiles for 24 mice using the model parameters (ξ, σ, β, g) in Table 1 for HPPH. The corresponding source strength, total energy released per unit length, and initial photosensitizer concentration for each group of 3 mice are shown in Table 4. The symbol with error bar indicates the PDT-induced necrotic radius with standard deviation for each mouse. (b) PDT-induced necrotic radius predicted vs. measured for mice shown in figure (a).
The number of mice used for each photosensitizer is 16, 18, and 24 for Photofrin, BPD, and HPPH, respectively. The treatment conditions are listed in Tables 3 – 4 for BPD and HPPH, respectively. The treatment condition for Photofrin is included in the legend of Fig. 3.
Table 3.
Treatment conditions for BPD-mediated PDT (DLT 3 hrs) experiments in RIF tumor model. Each mouse group contains 3 mice.
| Mouse # | PS con. (μM) |
LS strength (mW)/cm2 |
TX time (s) | μa (cm-1) | μs′ (cm-1) | Necrosis radius (mm) |
|---|---|---|---|---|---|---|
| 1 | 0.79±0.15 | 12 | 3000 | 0.67±0.16 | 9.44±2.1 | 2.62±0.86 |
| 2 | 0.70±0.10 | 150 | 420 | 0.82±0.18 | 9.93±2.6 | 2.94±1.11 |
| 3 | 0.51±0.21 | 20 | 1600 | 0.60±0.14 | 8.00±1.5 | 1.97±1.03 |
| 4 | 0.70±0.16 | 12 | 2000 | 0.79±0.16 | 8.02±0.5 | 2.78±1.12 |
| 5 | 0.82±0.14 | 30 | 1020 | 0.80±0.05 | 6.93±1.6 | 2.76±0.71 |
| 6 | 0.59±0.25 | 75 | 660 | 0.83±0.22 | 10.25±2.1 | 2.56±0.50 |
Table 4.
Treatment conditions for HPPH-mediated PDT (DLT 24 hrs) experiments in RIF tumor model. Each mouse group contains 3 mice.
| Mouse # | PS con. (μM) |
LS strength (mW)/cm2 |
TX time (s) | μa (cm-1) | μs′ (cm-1) | Necrosis radius (mm) |
|---|---|---|---|---|---|---|
| 2 | 0.40±0.06 | 12 | 3600 | 0.63±0.10 | 9.1±0.8 | 2.44±0.9 |
| 3 | 0.59±0.30 | 30 | 660 | 0.74±0.08 | 8.9±0.2 | 2.68±0.7 |
| 5 | 0.39±0.10 | 75 | 996 | 0.79±0.01 | 8.5±0.9 | 3.21±0.8 |
| 6 | 0.47±0.30 | 30 | 1000 | 0.65±0.05 | 9.6±1.0 | 3.00±0.8 |
| 7 | 1.60±0.60 | 30 | 500 | 0.63±0.10 | 9.6±1.0 | 2.67±1.0 |
| 9 | 0.69±0.10 | 75 | 400 | 0.69±0.10 | 8.0±1.0 | 2.67±0.4 |
| 10 | 0.32±0.05 | 75 | 666 | 0.95±0.20 | 10.5±3.0 | 3.20±0.4 |
| 11 | 0.46±0.08 | 150 | 666 | 0.83±0.05 | 11.0±2.0 | 4.63±1.8 |
Table 5 summarizes the singlet oxygen threshold dose based on fit shown in Figs. 3-5. For comparison, singlet oxygen threshold dose for PDT from other studies are included. Clearly there is a different of singlet oxygen threshold dose between in-vivo results measured in mouse (0.4 – 0.6 mM) and that from spheroid measurement (8 – 12 mM). Our study is consistent with other in-vivo mice studies. However, the in-vivo results are at least 10 times smaller than those observed in spheroid, indicating possible other effect in PDT damage in-vivo.25 We have also included threshold dose obtained for BPD with DLI of 15 min (BPD 1mg/kg, 690 nm) where vascular effect is predominant. This lower singlet oxygen threshold dose of 0.08 mM26 is to be expected, given the PS concentration (∼0.15 μM) in tissue for BPD with 15 min DLI is much lower than that (∼0.6 μM) for BPD with apoptosis effect to be dominant for 3 hr DLI.
Table 5. Summary of singlet oxygen threshold dose (in mM).
| PS | Media | [1O2] threshold dose (mM) | References | |
|---|---|---|---|---|
| 1 | Photofrin 24 hr | Mice RIF | 0.56±0.26 | This study |
| 2 | Photofrin | EMT6/Ro Spheroid | 12.1±1.2 | 19 |
| 3 | mTHPC 24hr | Mice H-Meso1 | 0.4 | 25 |
| 4 | mTHPC | EMT6/Ro Spheroid | 7.9 ±2.2 | 27 |
| 5 | BPD 3hr | Mice RIF | 0.44±0.13 | This study. |
| 6 | BPD 15 min | Mice RIF | 0.08±0.05 | 26 |
| 7 | HPPH 24 hr | Mice RIF | 0.41 ±0.25 | This study. |
3.2 Uncertainty in singlet oxygen threshold dose determination
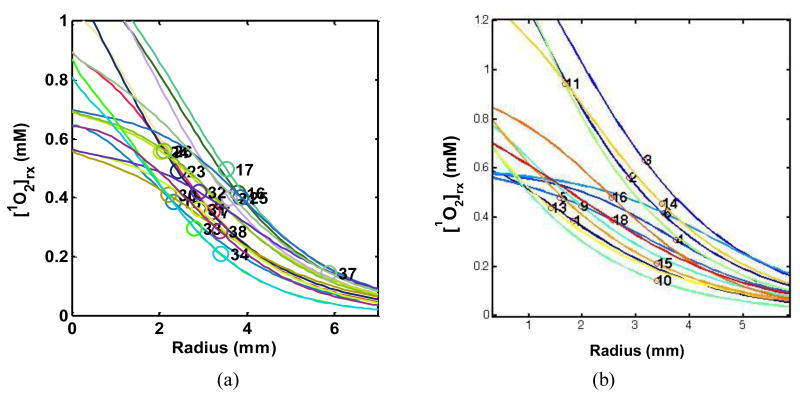
To examine the error in our experiments to determine the singlet oxygen threshold dose, we have plotted all the individual measurement between the reacted singlet oxygen and necrosis radius. Figure 6 shows all the necrosis results for HPPH and BPD while Fig. 3a shows that for Photofrin. We concluded that the maximum spreads of singlet oxygen dose are 0.2 – 0.95 mM for Photofrin, 0.1 – 0.73 mM for BPD, and 0.2 – 0.65 mM for HPPH. The upper limit of singlet oxygen threshold dose in vivo is thus 1 mM from our study.
Figure 6.
[1O2]rx profiles for 24 mice using the model parameters (ξ, σ, β, g) in Table 1 for (a) HPPH and (b) BPD.
3.3 Theoretical consideration of singlet oxygen threshold dose
One can write down the relationship between the singlet oxygen and the acceptors as:
| (9) |
The solution of this equation is thus
| (10) |
Thus, the threshold value of cumulative singlet oxygen production for sufficient cellular target killing is so that [A]/[A]0 = 10-3. This corresponding to [1O2]rx,sh = 6.91[A] = 5.7 mM. Here we have used an estimated value of accepter concentration in-vivo from literature ([A] = 0.83 mM).24 This value is an order of magnitude higher than our experimental value determined in-vivo (∼ 0.5 mM), but is consistent (to within a factor of 2) with the value determined in the spheroid model (∼10 mM), see Table 5.
Using the direct measurement of number of RIF tumor cells in-vivo, 5 × 10⁸/cm3, the measured singlet oxygen threshold dose (0.5 mM) can then be converted to number of singlet oxygen required to kill each cell to 1/e: 8.7 × 10⁷ (= 0.5 (mM)/6.91 × 10-3 (M/mM) × 6.022 × 10²³ (1/mole)/1000 (L/cm3)/5 × 108), where 6.91 (=3*ln10) is a factor to convert the cell killing from 10-3 to 1/e, assuming the cell killing is following Eq. 10. In comparison, in-vitro measurement in Mat-LyLu cells using mTHPC gives this value as 9 × 10⁸ molecules of singlet oxygen per cell to reduce the surviving fraction by 1/e.15 The in-vivo singlet oxygen threshold dose (8.7 × 10⁷/cell) is again about 10 times smaller than that determined in-vitro (9 × 10⁸/cell).
In conclusion, the singlet oxygen threshold dose measured in vivo is approximately 0.5 mM to produce necrosis or 8.7 × 10⁷ molecules of singlet oxygen per cell to reduce the surviving fraction by 1/e from our RIF tumor model. This value is at least an order of magnitude smaller than either Spheroid model (∼7.9 mM) to produce necrosis or in-vitro model of Mat-Lylu cells 9 × 10⁸ molecules of singlet oxygen per cell to reduce the surviving fraction by 1/e using mTHPC.
Conclusions
We have shown that using a set of rate equations and fitting the data to the necrosis radius in a RIF mouse model, we can determine the threshold dose of singlet oxygen in-vivo. Preliminary study has shown that singlet oxygen threshold dose is in the range of 0.41 – 0.56 mM for three photosensitizers studied, Photofrin, BPD, and HPPH. This value is about 10 times smaller than that determined in-vitro. We thus come to a conclusion that PDT is more potent in vivo than that in-vitro, as pointed out by Wang et al25 as well.
Figure 4.
(a) [1O2]rx profiles for 18 mice using the model parameters (ξ, σ, β, g) in Table 1 for BPD. The corresponding source strength, total energy released per unit length, and initial photosensitizer concentration for each group of 3 mice are shown in Table 3. The symbol with error bar indicates the PDT-induced necrotic radius with standard deviation for each mouse. (b) PDT-induced necrotic 4.radius predicted vs. measured for mice shown in figure (a).
Acknowledgments
This work is supported by grants from National Institute of Health (NIH) R01 CA154562-03 and P01 CA87971.
References
- 1.Dougherty TJ, Gomer DJ, Henderson BW, al e. Photodynamic Therapy. J Natl Cancer Inst. 1998;90:889–905. doi: 10.1093/jnci/90.12.889. [DOI] [PMC free article] [PubMed] [Google Scholar]
- 2.Zhu TC, Finlay JC. Prostate PDT dosimetry. Photodiagnosis and Photodynamic Therapy. 2006;4:234–246. doi: 10.1016/j.pdpdt.2006.08.002. [DOI] [PMC free article] [PubMed] [Google Scholar]
- 3.Yu G, Durduran T, Zhou C, Wang HW, Putt ME, Saunders M, Sehgal CM, Glatstein E, Yodh AG, Busch TM. Noninvasive monitoring of murine tumor blood flow during photodynamic therapy provides early assessment of treatment efficacy. Clin Can Res. 2005;11:3543–3552. doi: 10.1158/1078-0432.CCR-04-2582. [DOI] [PubMed] [Google Scholar]
- 4.Wilson BC, Patterson MS. The physics, biophysics and technology of photodynamic therapy. Phys Med Biol. 2008;53:R61–R109. doi: 10.1088/0031-9155/53/9/R01. [DOI] [PubMed] [Google Scholar]
- 5.Zhu TC, Finlay JC. The role of photodynamic therapy PDT physics. Med Phys. 2008;35:3127–3136. doi: 10.1118/1.2937440. [DOI] [PMC free article] [PubMed] [Google Scholar]
- 6.Hetzel FW, Brahmavar S, Chen Q, Jacques S, Patterson MS, Wilson BC, Zhu TC. In: 88. AAPM, editor. Med Phys Publishing; College Park, MD: 2005. [Google Scholar]
- 7.Foote CS. Photosenstizied oxidations and the role of singlet oxygen. Accounts Chem Res. 1967;1:104–110. [Google Scholar]
- 8.Ochsner M. Photophysical and photobiological processes in the photodynamic therapy of tumours. J Photochem Photobiol B. 1997;39:1–18. doi: 10.1016/s1011-1344(96)07428-3. [DOI] [PubMed] [Google Scholar]
- 9.Wilson BC, Patterson MS, Lilge L. Implicit and explicit dosimetry in photodynamic therapy: A new paradigm. Lasers Med Sci. 1997;12:182–199. doi: 10.1007/BF02765099. [DOI] [PubMed] [Google Scholar]
- 10.Niedre MJ, Patterson MS, Giles A, Wilson BC. Imaging of Photodynamically Generated Singlet Oxygen Luminescence In Vivo. Photochem Photobiol. 2005 doi: 10.1562/2005-03-15-TSN-462. [DOI] [PubMed] [Google Scholar]
- 11.Niedre M, Patterson MS, Wilson BC. Direct near-infrared luminescence detection of singlet oxygen generated by photodynamic therapy in cells in vitro and tissues in vivo. Photochem Photobiol. 2002;75:382–391. doi: 10.1562/0031-8655(2002)075<0382:DNILDO>2.0.CO;2. [DOI] [PubMed] [Google Scholar]
- 12.Zhu TC, Finlay JC, Zhou X, Li J. Macroscopic modeling of the singlet oxygen prodution during PDT. Proc SPIE. 2007;6427:642708, 642701–642712. doi: 10.1117/12.701387. [DOI] [PMC free article] [PubMed] [Google Scholar]
- 13.Lovell JF, Liu TWB, Chen J, Zheng G. Activatable Photosensitizers for Imaging and Therapy. Chem Rev. 2010;2010:2839–2857. doi: 10.1021/cr900236h. [DOI] [PubMed] [Google Scholar]
- 14.Bellnier DA, Greco WR, Loewen GM, Nava H, Oseroff AR, Pandey RK, Tsuchida T, Dougherty TJ. Population Pharmacokinetics of the Photodynamic Therapy Agent 2-[1-Hexyloxyethyl]-2-devinyl Pyropheophorbide-a in Cancer Patients. Can Res. 2003;63:1806–1813. [PubMed] [Google Scholar]
- 15.Dysart JS, Singh G, Patterson MS. Calculation of singlet oxygen dose from photosensitizer fluorescence and photobleaching during mTHPC photodynamic therapy of MLL cells. Photochem Photobiol. 2005;81:196–205. doi: 10.1562/2004-07-23-RA-244. [DOI] [PubMed] [Google Scholar]
- 16.Johansson A, Svensson J, Andersson-Eagels S, Bendsoe N, Svanberg K, Bigio I, Alexandratou E, Kyriazi M, Yova D, Grafe S, Trebst T. mTHPC pharmacokinetics following topical administration. Proc SPIE. 2006;6094:60940C. [Google Scholar]
- 17.Aveline B, Hasan T, Redmond RW. Photophysical and Photosensitizing properties of Benzoporphyrin derivative monoacid ring A (BPD-MA) Photochem Photobiol. 1994;59:328–335. doi: 10.1111/j.1751-1097.1994.tb05042.x. [DOI] [PubMed] [Google Scholar]
- 18.Mitra S, Foster TH. Photophysical parameters, photosensitizer retention and tissue optical properties completely account for the higher photodynamic efficacy of meso-tetra-hydroxyphenyl-chlorin vs Photofrin. Photochem Photobiol. 2005;81:849–859. doi: 10.1562/2005-02-22-RA-447. [DOI] [PubMed] [Google Scholar]
- 19.Georgakoudi I, Nichols MG, Foster TH. The mechanism of Photofrin photobleaching and its consequences for photodynamic dosimetry. Photochem Photobiol. 1997;65:135–144. doi: 10.1111/j.1751-1097.1997.tb01889.x. [DOI] [PubMed] [Google Scholar]
- 20.Georgakoudi I, Foster TH. Singlet oxygen- versus nonsinglet oxygen-mediated mechanisms of sensitizer photobleaching and their effects on photodynamic dosimetry. Photochem Photobiol. 1998;67:612–625. [PubMed] [Google Scholar]
- 21.Wang KKH, Finlay JC, Busch TM, Hahn SM, Zhu TC. Explicit dosimetry for photodynamic therapy: macroscopic singlet oxygen modeling. J Biophot. 2010;3:304–318. doi: 10.1002/jbio.200900101. [DOI] [PMC free article] [PubMed] [Google Scholar]
- 22.Nichols MG, Foster TH. Oxygen diffusion and reaction kinetics in the photodynamic therapy of multicell tumour spheroids. Physics in medicine and biology. 1994;39:2161–2181. doi: 10.1088/0031-9155/39/12/003. [DOI] [PubMed] [Google Scholar]
- 23.Foster TH, Murant RS, Bryant RG, Knox RS, Gibson SL, Hilf R. Oxygen consumption and diffusion effects in photodynamic therapy. Radiat Res. 1991;126:296–303. doi: 10.2307/3577919. [DOI] [PubMed] [Google Scholar]
- 24.Hu XH, Feng Y, Lu JQ, Allison RR, Cuenca RE, Downie GH, Sibata CH. Modeling of a Type II Photofrin-mediated Photodynamic Therapy Process in a Heterogeneous Tissue Phantom. Photochem Photobiol. 2005;81:1460–1468. doi: 10.1562/2005-05-04-RA-513. [DOI] [PubMed] [Google Scholar]
- 25.Wang KKH, Mitra S, Foster TH. Photodynamic dose does not correlate with long-term tumor response to mTHPC-PDT performed at several drug-light intervals. Med Phys. 2008;35:3518–3526. doi: 10.1118/1.2952360. [DOI] [PMC free article] [PubMed] [Google Scholar]
- 26.Kim MM, Liu B, Miller J, Busch TM, Zhu TC. Parameter determination for BPD mediated vascular PDT. Proc SPIE. 2014;8931 doi: 10.1117/12.2040305. In press. [DOI] [PMC free article] [PubMed] [Google Scholar]
- 27.Coutier S, Mitra S, Bezdetnaya LN, Parache RM, Georgakoudi I, Foster TH, Guillemin F. Effects of Fluence Rate on Cell Survival and Photobleaching in Meta-Tetra-(hydroxyphenyl)chlorin-photosensitized Colo 26 Multicell Tumor Spheroids. Photochem Photobiol. 2001;73:297–303. doi: 10.1562/0031-8655(2001)073<0297:EOFROC>2.0.CO;2. [DOI] [PubMed] [Google Scholar]


