Abstract
Photodynamic therapy (PDT) offers a cancer treatment modality capable of providing minimally invasive localized tumor necrosis. To accurately predict PDT treatment outcome based on pre-treatment patient specific parameters, an explicit dosimetry model is used to calculate apparent reacted 1O2 concentration ([1O2]rx) at varied radial distances from the activating light source inserted into tumor tissue and apparent singlet oxygen threshold concentration for necrosis ([1O2]rx, sd) for type-II PDT photosensitizers. Inputs into the model include a number of photosensitizer independent parameters as well as photosensitizer specific photochemical parameters ξ, σ, and β. To determine the specific photochemical parameters of benzoporphyrin derivative monoacid A (BPD), mice were treated with BPD-PDT with varied light source strengths and treatment times. All photosensitizer independent inputs were assessed pre-treatment and average necrotic radius in treated tissue was determined post-treatment. Using the explicit dosimetry model, BPD specific ξ, σ, and β photochemical parameters were determined which estimated necrotic radii similar to those observed in initial BPD-PDT treated mice using an optimization algorithm that minimizes the difference between the model and that of the measurements. Photochemical parameters for BPD are compared with those of other known photosensitizers, such as Photofrin. The determination of these BPD specific photochemical parameters provides necessary data for predictive treatment outcome in clinical BPD-PDT using the explicit dosimetry model.
Keywords: Explicit Dosimetry, BPD, Photodynamic Therapy
1. INTRODUCTION
Photodynamic therapy is a cancer treatment option which utilizes light and a photosensitizing agent1. Application of activating light in tissue with type-II photosensitizer present results in a transfer of energy capable of creating reactive singlet oxygen ([1O2]), the highly localized cytotoxic agent which causes PDT tissue damage via apoptosis and necrosis2. Because significant challenges in direct [1O2] measurement preclude general use in clinical applications, a explicit dosimetry model has been developed to predict [1O2]rx3.
The explicit dosimetry model is designed to account for the three traditional PDT elements of oxygen concentration, light fluence rate, and drug concentration in treated tissue4. In addition to drug concentration, specific photosensitizers show individualized energy transfer properties resulting in various treatment efficacies. In the model utilized the three main photochemical parameters are ξ, σ, and β. These parameters are uses to describe various ratios of intersystem energy transfers. Though there is a significant variety of PDT photosensitizers utilized for various treatments and conditions many photosensitizer photochemical parameters remain unknown. Determining the photochemical specific parameters of BPD remains significant to improve dose measurement and better determine treatment outcome in BPD approved eye, skin, and pancreatic treatments5.
In-vivo PDT treatment was performed utilizing the BPD on mice with radiation-induced fibrosarcoma (RIF) tumors. After treatment analysis of tumor necrosis and treatment time and fluence rate were used to optimize ξ, σ, and β parameters for the drug BPD.
2. MATERIALS AND METHODS
2.1 In-vivo Experiments
The patients used in the study were 9-11 week old female C3H mice (NCI-Frederick, Frederick, MD). Each mouse was injected with 3×10⁵ radiation-induced fibrosarcoma (RIF) cells into the right shoulders of the mice. Mice were prepared for treatment when the tumors reached approx. 8mm at the widest length. BPD was administered to the patient via tail vein injection 3 hours before treatment at a concentration 1mg/kg.
Immediately before PDT treatment both optical properties and BPD concentration in the tumor are measured. BPD concentration was measured using a side cut fiber inserted into the central catheter and measuring BPD fluorescence from a 405 nm source. Optical properties were measured using a 690 nm diode laser (B&W Tek, Newark, DE, USA) connected to a point source in the central catheter while an isotropic detector scanned parallel to the point source in the adjacent peripheral catheter 5 mm apart. A fluence rate profile was created in the tumor tissue and the optical properties of the tissue were extracted from the profile.
Once measurements were taken the peripheral catheter was removed. A 1 cm linear source was then inserted into the central catheter and treatment was carried out. Animals recovered for 24 hours after the treatment before being euthanized. Tumors were removed from the animal and marked to preserve correct orientation of the tumor during treatment before fixation in formalin. Sectioning and analysis of the resulting necrotic area was performed as described in [3]. A deviation in this protocol from that in [3] was tumors were individually assessed for reduction of necrotic radius from tissue shrinkage in the preservation process.
2.2 Explicit 1O2 Dosimetry Model
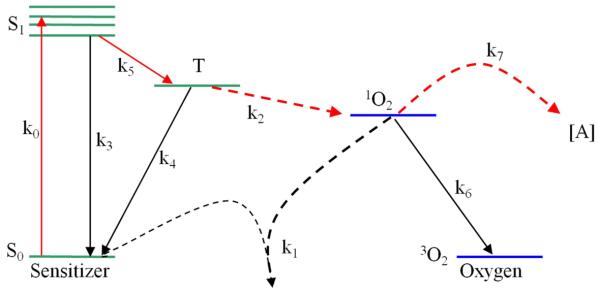
The macroscopic explicit dosimetry model is comprised of elements of a type-II PDT Jablonski diagram showing energy transitions in a photochemical system. The elemental states described are [S0], [S1], [T], [3O2], and [1O2] which represent, respectively, the ground state photosensitizer, excited singlet photosensitizer, excited triplet photosensitizer, ground state triplet oxygen, and excited singlet oxygen. The k0-7 terms describe energy transitions and [A] represents the concentration of 1O2 acceptors not including S0.
Based on this diagram of energy transitions in a type-II PDT system a series of coupled differential equations as derived and described in [3] are used below. Additional terms used in these equations are P, describing oxygen supply, SΔ, a term used to describe the fraction of 3O2 reactions which produce 1O2 (0.5), and δ, a correction for low photosensitizer concentration. The apparent reacted s nglet oxygen during the course of PDT treatment is characterized in equation (7) below. Equation (8) describes the modeled light diffusion, where ¢ represents treatment fluence rate, S source strength, μa tissue absorption, and μs tissue scattering. Equations (9-11) represent equations (1-6) condensed under assumptions that , and all equal approximately zero in time scales seen in clinical applications (sec, min, hr). The ξ, σ, and β parameters introduced in equations (9-11) correspond to ratios of k0-7 terms.
| (1) |
| (2) |
| (3) |
| (4) |
| (5) |
| (6) |
| (7) |
| (8) |
| (9) |
| (10) |
| (11) |
The condensed equations (9-11) and radial light distribution profile of equation (8) were solved using the finite element method and software described in [3]. Parameters ξ, σ, and β are expected to be variable depending on the photochemical used. Other parameters used in the model, including δ and g, were not altered when fitting necrotic radii to parameters was performed.
2.3 Treatment Parameters
An initial set of treatments were tested to gain an understanding of approximate ranges of treatment times and powers which would prove useful in ascertaining photochemical parameters of BPD. After the initial experiments were performed ξ, σ, and β parameters were fitted to the measured necrotic radii. A [1O2]rx vs. necrotic radii profile was produced with the fitted parameters using a ([1O2]rx, sd) of approx. 0.4-1.0. The ([1O2]rx, sd) established in [3] for Photofrin is not believed to be photosensitizer dependent and should be observed in BPD-PDT treatment. Measured vs. predicted necrotic radii profiles were created using varied ξ, σ, and β parameters.
With initial photochemical parameters established for BPD simulations were run to predict BPD-PDT efficacy. Mean μa, μs’, and [BPD] from the first set of treatments were used as inputs in predicting treatment efficacy for the second set of treatments.
3. RESULTS AND DISCUSSION
3.1 Initial Experiment
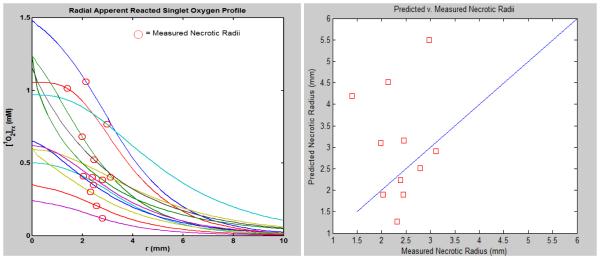
Using this data parameters for ξ, σ, and β were fitted to produce a [1O2]rx vs. necrotic radii and predicted vs. observed necrotic radii profile. Once the fitting model was able to produce parameters in the approx. range of those of photofrin3 and have predicted similar to observed necrotic radii parameters were manually adjusted in order to have the observed and predicted necrotic radii be closer together. The following figure shows the resultant profiles of the initial experiment after parameters were determined.
The three photochemical parameters for BPD were initially fitted as: ξ=0.023, σ=8.4−6, and β=11.9 to best represent the predicted necrotic radii of the model to come closest to the actual necrotic radii at a (1O2)rx,sd=0.42 mM.
3.2 Predictions for Follow-up Experiment
Based on the initial experiment, supplementary treatment times and source strengths were evaluated to provide additional data for evaluating photochemical parameters consistent with BPD necrotic radii. Seventeen mice were treated at generally lower treatment times and source powers in order to decrease the possibility of the necrotic radii infringing on the tumor edge. Three control mice were used and thirteen mice were evaluated for PDT effect.
3.3 Comparison with other Photosensitizers
The ξ, σ, and β parameters analyzed in this study are expected to be consistent on scales of orders of magnitude with those of Photofrin analyzed in [3]. All ξ values referenced in [3], including the value fitted in the paper, span a range of approximately 10−3−10−2. The value for BPD is expected to be on the higher end of that range due to the k7[A]⁄k6 of Photofrin and BPD being approximately equal as none of these factors are photosensitizer dependent, SΔ is expected to be the same for BPD and Photofrin, and the for each photosensitizer has been evaluated as similar [6,7]. With the extinction coefficient for BPD measured at approximately 10× greater than that of Photofrin, the ξ value is expected as approx. 10× greater than that of Photofrin at approx. 2×10⁻³[3].
The σ value, based on k7[A] not being photosensitizer dependent and various photosensitizer σ values as seen in [3] in a similar range, is expected to be in the 10−5−10−4 range.
4. CONCLUSIONS AND FUTURE DIRECTION
Presently unavailable as an important dynamic in the creation of (1O2)rx profiles, and evaluation of appropriate ξ and σ values for the mice in the follow-up experiments are in vivo BPD concentrations for the follow-up experiment. Initial extractions of BPD concentrations provided unlikely values and were not used. Experimental BPD concentrations are being corrected based on the optical properties of the tumor tissue and refitting of the initial BPD photochemical parameters can be done. With BPD concentrations accounted for refitting of predicted tumor necrotic radii will be performed. With refitted necrotic radii, the relationship between measured and predicted necrotic radii will be evaluated and photochemical parameters will be optimized.
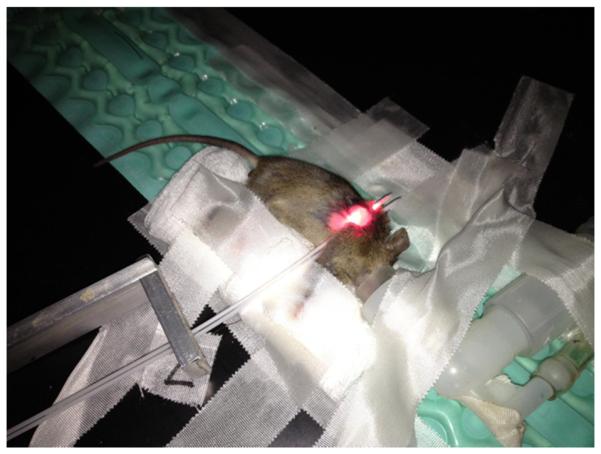
Figure 1.

Typical arrangement of patient and equipment for BPD-PDT treatment. Silver bracket is used to space catheters at a consistent 5mm distance. A central catheter is used for the linear source during treatment, for BPD concentration measurement, and for a point source to measure optical properties of the tumor tissue. The peripheral catheter is used for an isotropic detector during optical property measurement.
Figure 2.

Jablonski diagram of type-II PDT energy transitions and energy states utilized in explicit dosimetry model.
Figure 3.
The figure at left depicts the predicted radial [1O2]rx for the mice in the initial experiment. At right an (1O2)rx,sd of 0.42 mM depicts how the predicted and measured necrotic radii are related.
Table 1.
Variable parameters used in the explicit dosimetry model. Approximate values are those used in [3] and serve as a guide for potential range of values BPD parameters.
| Parameter (units) | Designation | Fitted Values |
|---|---|---|
| ξ (cm2mW−1s−1) | 0.023 | |
| σ (μM−1) | 8.4×10⁻⁶ | |
| β(μM) | 11.9 | |
| δ (mM) | Low [photochemical] correction | 33 |
| g (μM/sec) | Maximum oxygen supply rate | 0.7 |
| [1O2]rx, sd(mM) | [1O2]rx where necrosis is expected | 0.42 |
Table 2.
Data from initial round of BPD-PDT treatments.
| Mouse # | BPD concentration (μM) |
LS strength (mW/cm) |
Treatment time (sec) |
μa
(cm−1) |
μs’ (cm−1) |
Measured Necrotic radius (mm) |
|---|---|---|---|---|---|---|
| 1 | 0.414 | 75 | 1800 | 0.661 | 10.44 | 2.14 |
| 2 | 0.347 | 30 | 1980 | 0.549 | 10.78 | 1.99 |
| 3 | 0.294 | 30 | 4500 | 0.533 | 14.28 | 1.40 |
| 4 | 0.139 | 150 | 660 | 0.396 | 18.852 | 2.030 |
| 5* | 0.174 | 150 | 180 | 0.529 | 9.75 | 2.786 |
| 6* | 0.165 | 12 | 6000 | 0.142 | 11.163 | 3.112 |
| 7 | 0.326 | 12 | 4000 | 0.226 | 6.54 | 2.454 |
| 8* | 0.181 | 12 | 3000 | 0.207 | 15.5 | 2.445 |
| 9* | 0.394 | 12 | 2000 | 0.152 | 7.41 | 2.789 |
| 10* | 0.254 | 75 | 300 | 0.376 | 12.18 | 2.550 |
| 11 | 0.270 | 20 | 4000 | 0.138 | 15.153 | 2.978 |
| 12* | 0.172 | 20 | 3000 | 0.283 | 13.45 | 2.386 |
| 13 | 0.183 | 75 | 660 | 0.352 | 9.013 | 2.325 |
Mice with an next to their number represent those whose average necrotic radius infringed on the radius of the tumor, not providing a clean view of the necrotic radius produced by the treatment.
Table 3.
Computed predictions for necrotic radius of mice under assumptions of average μa, μs’, and BPD concentration from mice in first set of treatments.
| Mouse # | LS strength (mW/cm) |
Treat ment time (sec) |
μa
(cm−1) |
μs (cm−1) | Measured Necrotic radius (mm) |
|---|---|---|---|---|---|
| 1 | 75 | 660 | 0.5 | 11.53 | 1.901 |
| 2 | 75 | 1800 | 1.2888 | 31.26 | 1.968 |
| 3 | 150 | 180 | 0.8048 | 26.625 | 1.884 |
| 4 | 30 | 1200 | 0.3198 | 73.8475 | 2.229 |
| 5 | 20 | 2000 | 0.2608 | 56.9775 | 3.007 |
| 6 | 12 | 2000 | 1.1003 | 6.3375 | 3.056 |
| 7 | 75 | 540 | 0.3045 | 67.1325 | 2.908 |
| 8 | 150 | 420 | 1.0593 | 8.24 | 2.574 |
| 9 | 30 | 1500 | 0.3150 | 23.0825 | 2.922 |
| 10 | 20 | 1600 | 1.4953 | 10.6075 | 1.735 |
| 11 | 20 | 2400 | 0.2370 | 53.1475 | 3.483 |
| 12 | 12 | 3400 | 1.5625 | 2.255 | 4.983 |
| 13 | 30 | 1020 | 0.1725 | 59.1775 | 2.034 |
ACKNOWLEDGEMENTS
This work is funded by grants NIH R01 CA154562 and P01 CA87971. Support for collaboration is greatly appreciated from SUPERS@PENN and the NCI.
REFERENCES
- [1].Dougherty TJ, Henderson BW, Gomer CJ, Jori G, Kessel D, Korbelik M, Moan J, Peng Q. Photodynamic therapy. Journal of the National Cancer Institute. 1998;90(12):889–905. doi: 10.1093/jnci/90.12.889. [DOI] [PMC free article] [PubMed] [Google Scholar]
- [2].Robertson CA, Evans DH, Abrahamse H. Photodynamic therapy (PDT): A short review on cellular mechanisms and cancer research applications for PDT. Journal of Photochemistry and Photobiology B: Biology. 2009;96(1):1–8. doi: 10.1016/j.jphotobiol.2009.04.001. [DOI] [PubMed] [Google Scholar]
- [3].Wang KK, Finlay JC, Busch TM, Hahn SM, Zhu TC. Explicit dosimetry for photodynamic therapy: macroscopic singlet oxygen modeling. Journal of Biophotonics. 2010;3(5-6):304–318. doi: 10.1002/jbio.200900101. [DOI] [PMC free article] [PubMed] [Google Scholar]
- [4].Henderson BW, Dougherty TJ. How does photodynamic therapy work? Photochemistry and photobiology. 2008;55(1):145–157. doi: 10.1111/j.1751-1097.1992.tb04222.x. [DOI] [PubMed] [Google Scholar]
- [5].Agostinis P, Berg K, Cengel KA, Foster TH, Girotti AW, Gollnick SO, Hahn SM, Golab J. Photodynamic therapy of cancer: an update. CA: a cancer journal for clinicians. 2011;61(4):250–281. doi: 10.3322/caac.20114. [DOI] [PMC free article] [PubMed] [Google Scholar]
- [6].Aveline B, Hasan T, Redmond RW. Photophysical and Photosensitizing Properties of Benzoporphyrin Derivative Monoacid Ring A (BPD-MA)*. Photochemistry and photobiology. 2008;59(3):328–335. doi: 10.1111/j.1751-1097.1994.tb05042.x. [DOI] [PubMed] [Google Scholar]
- [7].Mitra S, Foster TH. Photophysical Parameters, Photosensitizer Retention and Tissue Optical Properties Completely Account for the Higher Photodynamic Efficacy of meso-Tetra-Hydroxyphenyl-Chlorin vs Photofrin. Photochemistry and photobiology. 2005;81(4):849–859. doi: 10.1562/2005-02-22-RA-447. [DOI] [PubMed] [Google Scholar]


