

Abstract
Detection of bacteria in bloodstream infections and their antibiotic susceptibility patterns is critical to guide therapeutic decision-making for optimal patient care. Current culture-based assays are too slow (>48 hrs), leading to excessive up-front use of broad-spectrum antibiotics and/or incorrect antibiotic choices due to resistant bacteria, each with deleterious consequences for patient care and public health. To approach this problem, we describe a method to rapidly isolate bacteria from whole blood using inertial microfluidics and directly determine pathogen identity and antibiotic susceptibility with hybridization-based RNA detection. Using the principle of Dean flow fractionation, bacteria are separated from host blood cells in a label-free separation method with efficient recovery of even low abundance bacteria. Ribosomal RNA detection can then be applied for direct identification of low abundance pathogens (~100/mL) from blood without culturing or enzymatic amplification. Messenger RNA detection of antibiotic-responsive transcripts after brief drug exposure permits rapid susceptibility determination from bacteria with minimal culturing (~105/mL). This unique coupling of microfluidic cell separation with RNA-based molecular detection techniques represents significant progress towards faster diagnostics (~8 hours) to guide antibiotic therapy.
Introduction
Bacterial infections continue to be a major cause of morbidity and mortality in the United States and worldwide 1–4. Management of these infections is becoming more difficult as our antibiotics are becoming increasingly ineffective in the face of rising antibiotic resistance. In addition to new antibiotics to combat these resistant organisms, it is clear that more rapid diagnostics are also desperately needed 5, 6.
Standard diagnostic methods for typical bacterial infections involve several sequential growth steps followed by biochemical assays to identify the species and antibiotic susceptibility patterns 7, 8, requiring 48–72 hours. More recently, alternative methods like MALDI-TOF mass spectrometry are being implemented for earlier pathogen identification 9, but these methods still require culture and cannot provide antibiotic susceptibility data. Multiplex PCR assays have also been explored that can rapidly report organism identity and the presence of a select few resistance-causing genes from positive blood cultures 10. During the time required to return antibiotic susceptibility data, clinicians must empirically administer broad-spectrum antibiotics to seriously infected patients, because delays in effective antibiotic therapy increase patient mortality 11.
There has been tremendous interest in developing molecular diagnostics that circumvent the need for bacterial growth and culture in order to hasten species identification and antibiotic susceptibility determination. Most molecular diagnostics for bacteria to date have targeted DNA 12, 13, taking advantage of the uniqueness of bacterial genomes for species identification. Some efforts have even been extended to antibiotic susceptibility determination by detecting genetic lesions (genes or mutations) associated with antibiotic resistance; however, knowledge of the genetic basis for antibiotic resistance is at present limited to special cases such as the identification of mecA in methicillin resistant Staphylococcus aureus 14, 15. We have reported an alternative molecular approach that leverages RNA sequence information for pathogen identification and RNA expression levels to provide phenotypic antibiotic susceptibility information based on transcriptional changes detected in sensitive but not resistant bacteria in response to antibiotic exposure 16.
While molecular diagnostics for infection holds the promise to greatly accelerate diagnosis, they are currently challenged when the abundance of a pathogen is very low, and even more so when host cell background is high. For example, in bacteremias where pathogen burden can be as low as ~10–100/mL 17, host cellular material in whole blood is in vast excess (RBCs: ~109/mL; platelets: ~108/mL; leukocytes: ~107/mL). PCR-based diagnostics, though increasing in prevalence of late 18–20, can suffer from several drawbacks, including the need for expensive and laborious nucleic-acid purification steps 21; false negatives due to enzymatic inhibition from residual blood components including heme, which inhibits DNA polymerases 22; false negatives due to intrinsically low tolerance for naturally occurring sequence diversity in primer annealing regions among clinical strains 23–25; and false positives due to amplification of low-level contaminants. Thus, there is a critical need for new methods to enrich for bacterial pathogens from whole blood in a manner compatible with rapid, sensitive, ideally non-enzymatic pathogen detection.
Microfluidics technology is an attractive alternative; numerous microfluidics platforms for bacterial detection have been reported based on plug-based microfluidics 26, on-chip bacterial DNA purification 27, 28 and affinity-based capture 29–33. Most recently, a magnetic-microfluidic capture device using a modified version of the human opsonin mannose-binding lectin was reported to bind to a wide variety of pathogens 34, taking advantage of the human immune system’s solution to this recognition problem. High separation efficiencies (>80%) and throughput (20–600 mL/hr) were achieved using blood samples 29–34, but as with any affinity-based approach, the theoretical risk exists that variant pathogens may escape binding and detection by this method.
Therefore what is needed is a label-free separation which can isolate bacteria based on intrinsic biophysical properties. One approach involves the use of inertial microfluidics - the lateral migration of particles or cells across streamlines to focus at distinct positions due to dominant inertial lift forces (FL) at high Reynolds number, Re 35. This phenomenon has been exploited for efficient cell separation, but can only work with diluted blood samples (< 1% hematocrit (Hct)) to allow precise focusing of individual components 35–37. Recently, we developed an inertial microfluidics-based technique termed Dean Flow Fractionation (DFF) for direct isolation of circulating tumor cells (CTCs) from whole blood with high blood processing throughout (>15% hematocrit) 38. Here we modify this DFF technology to isolate low numbers of bacteria (~10–100/mL) in whole blood based on physical size difference, which overcomes many limitations of affinity-based methods and can be employed generically without knowledge of the pathogen species. Our novel separation method enables sufficient bacterial recovery from the cellular components of blood to permit direct identification of the bacterial species in infected blood via coupling to a hybridization-based RNA detection method targeting species-specific regions of highly abundant ribosomal RNA (rRNA) molecules, a method that will not work directly on infected whole blood. This unique diagnostic strategy enables timely (~8 hours) identification of bacterial species, with sensitivity that approaches that needed for identification directly from blood without culture or enzymatic amplification. Antibiotic resistance profiles can also be more rapidly determined than current gold-standard culture methods through a similar RNA-based approach measuring messenger RNA (mRNA) signatures of antibiotic response, with sensitivity permitting susceptibility determination from cultured blood 16. This increased speed can be critical in guiding early effective and targeted antibiotic therapy in infected patients.
Materials and Methods
Device fabrication
Microfluidic devices were fabricated in polydimethylsiloxane (PDMS) using standard microfabrication soft-lithographic techniques described previously 39. Briefly, patterned silicon wafers were silanized with trichloro (1H,1H,2H,2H-perfluorooctyl) silane (Sigma Aldrich, USA) and PDMS prepolymer (Sylgard 184, Dow Corning, USA) mixed in 10:1 (w/w) ratio with curing agent was poured onto the silanized wafer and cured at 80 °C for 1–2 hrs. The cured PDMS mold was silanized and acted as a template (negative replica) for subsequent PDMS casting which gave the final PDMS microchannels. Holes (1.5 mm) for fluidic inlets and outlets were punched and the PDMS devices were irreversibly bonded to microscopic glass slides using an air plasma machine (Harrick Plasma Cleaner, USA).
Bacterial culture
Bacterial cultures were grown to mid-log phase in either lysogeny broth (LB, Difco) for E. coli, K. pneumoniae, P. aeruginosa, or S. aureus or Todd-Hewitt Broth (THB, Difco) for E. faecalis before being diluted into blood at the appropriate concentration based on optical density measurements of the mid-log cultures. Expected colony forming units (cfu) were verified by plating serial dilutions for colony counting. For the majority of experiments, bacteria were inoculated directly into whole blood immediately prior to loading on the cell culture device. For a subset of the experiments in Fig. 5, E. coli was inoculated into blood culture bottles at ~1 cfu/mL and incubated for 7.5 hours to reach a concentration of >105 cfu/mL (verified by plating), then the resulting solution was processed as described.
Figure 5.
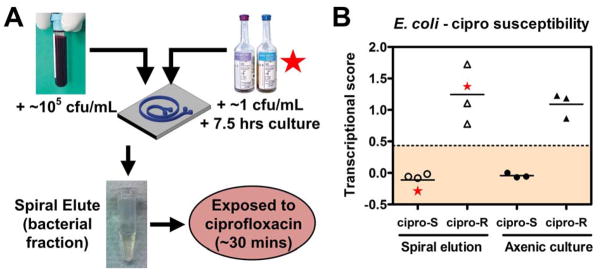
Antibiotic susceptibility determination of pathogens from blood after DFF by mRNA recognition. (A) Schematic of experimental approach: whole blood spiked with E. coli at 105 cfu/mL, or BACTEC blood cultures grown from 1 cfu/mL to >105 cfu/mL of E. coli, were processed by DFF, and the recovered bacteria were concentrated, then exposed to ciprofloxacin at 2.5 mcg/mL for 30 minutes at 37 °C, lysed, and detected by the NanoString assay using a probeset directed against ciprofloxacin-responsive mRNAs (see Methods for details). (B) Transcriptional susceptibility scores (see Methods for details) from E. coli inoculated into whole blood (left panel, open symbols) compared with axenic culture controls (right panel, closed symbols), each from ciprofloxacin-resistant (circles) vs ciprofloxacin-responsive (triangles) E. coli strains. Star symbols depict data from one susceptible (at left) and one resistant (at right) E. coli strain grown in BACTEC blood culture bottle. Dashed horizontal line represents four standard deviations from the mean transcriptional susceptibility score of the derivation cohort of susceptible E. coli strains.
Sample preparation
Fresh human whole blood with EDTA anticoagulant (Research Blood Components, Brighton, MA) was diluted 1:3 (v/v) with sample buffer consisting of 1× phosphate buffered saline (PBS) and 0.1% bovine serum albumin (BSA) (Miltenyi Biotec, USA). BSA was used to prevent non-specific adsorption to the tubing and microchannel walls. For blood culture experiments, whole blood was diluted with culture media (1:5 v/v) in a BACTEC blood culture bottle (identical to those used for clinical blood culture) and used directly for microfluidic experiments after incubation with bacteria. Alexa Fluor® 488 E. coli (K-12 strain) BioParticles® conjugates (Invitrogen, USA) were added to sample buffer and diluted blood samples (106–7/mL) for characterization of flow rate and separation efficiency, respectively. Cultured E. coli were spiked at various concentrations (10–10000/mL) in diluted blood samples to determine bacterial recovery from the device by cfu counting. For whole blood analysis, blood was incubated at 4°C directly without washing for 30 minutes with fluorescein isothiocyanate (FITC) conjugated CD41a antibodies (1:50, BD Biosciences, USA) and allophycocyanin (APC) conjugated CD45 marker (1:100, BD Biosciences, USA) to identify platelets and leukocytes, respectively. For leukocyte high speed imaging experiments, whole blood was treated with RBC lysis buffer (eBioscience, USA) according to the manufacturer’s instructions to obtain a pure population of leukocytes. To compare the separation performance between the spiral device and centrifugation, 1mL of whole blood spiked with different E. coli concentrations (100–10000/mL) was spun at 100 x g for 10 mins and 300 μL of plasma were aspirated for cfu counting and RBC enumeration using a hemacytometer.
Device characterization and analysis
Bacteria and diluted blood samples (~15% hematocrit) filled in a 5 mL syringe were pumped through the spiral device using a syringe pump (PHD 2000, Harvard Apparatus, USA) while sheath fluid (1× PBS supplemented with 0.1% BSA) was filled in a 60 mL syringe and pumped into the device with a separate syringe pump (PHD 2000, Harvard Apparatus, USA). The flow rate ratio between the sample and sheath flow was fixed at ~1:10 to form a tight sample stream at the outer wall. The microchannels were mounted on an inverted phase contrast microscope (Olympus IX71) equipped with a Hamamatsu Model C4742-80-12AG CCD camera (Hamamatsu Photonics, Japan) for imaging of fluorescent bacteria. A high speed CCD camera (Phantom v9, Vision Research Inc., USA) was also used to capture videos of inertially-focused blood cells at the channel outlet and analyzed offline using ImageJ® software. For E. coli BioParticles® and whole blood analysis, eluents were collected from the bacteria and waste outlets and separation efficiency was determined by flow cytometry (BD Accuri™ C6, BD Biosciences, USA).
RNA detection
Eluate from the bacterial outlet of the device was pelleted by centrifugation at 16,000 x g, then resuspended in 50 μL of 1x PBS and lysed by vigorously mixing with a 4-fold excess of RLT buffer (Qiagen) with beta-mercaptoethanol, then incubating x 5 minutes at RT and either using immediately or storing at −80°C for later use. This lysate was used as input for the NanoString assay for quantitative RNA detection, which was carried out essentially per manufacturer’s protocol 40 for both rRNA and mRNA detection. Briefly, two adjacent 50 nucleotide probes were designed to complement the target RNA sequence in unique regions. One probe was biotinylated, while the other was labeled with an ordered series of fluorophores (one of 4 colors in each of 7 positions), allowing multiplex probe detection. Probes were mixed with crude lysate for hybridization, then processed on the NanoString PrepStation to immobilize biotinylated probes and associated complexes on a streptavidin surface, followed by quantitative detection of immobilized fluorescent probes on the NanoString nCounter Digital Analyzer. We found for this application that hybridization time could be shortened to 2 hours with minimal loss in signal intensity, allowing the entire RNA detection process to take <8 hours. Transcriptional data were interpreted using nSolver analysis software (NanoString Technologies) and normalized for lane-to-lane variation per protocol using both positive and negative control probes provided by the manufacturer.
Species identification by rRNA recognition
The 5S, 16S, and 23S rRNA sequences for E. coli, K. pneumoniae, and P. aeruginosa were aligned using the ClustalOmega method for multiple sequence alignment, and regions of maximal interspecies variability were identified (Figure S5). Probes were designed to these variable regions in conjunction with the NanoString company to incorporate their proprietary algorithms for probe design to minimize cross-hybridization, considering each rRNA gene copy from every sequenced isolate of these three species in NCBI. Recognition patterns were validated against the three organisms grown in axenic culture, and non-reactive or pan-reactive probes were eliminated from the analysis, yielding the 13 discriminatory probes displayed in Table S1 (3 specific to E. coli, 1 specific to K. pneumoniae, 5 specific to P. aeruginosa, and 4 dually specific to either E. coli or K. pneumoniae but not P. aeruginosa). These discriminatory probes were tested against samples as described above. Normalized Organism Score for a given species was defined as the geometric mean of the species-specific probe readings for that species as a fraction of the sum total of these geometric means for all three species.
Antibiotic susceptibility detection by mRNA recognition
NanoString probes were designed to a set of 6 ciprofloxacin-responsive transcripts from E. coli and to a set of 3 control transcripts whose expression is unaffected by ciprofloxacin exposure based on transcriptional studies41, 42. Probe sequences are shown in Table S2. Expression values for the responsive transcripts were mathematically transformed into a single transcriptional metric essentially as previously described 16, with one distinction: instead of normalizing responsive transcripts to untreated controls as in our prior study, we normalized the antibiotic-responsive transcripts to the geometric mean of the expression level of control (non-responsive) transcripts in the same hybridization assay performed on the same lysate. This alteration allows us to precisely control for variation in cell number and thus improves the precision of the transcriptional score. Briefly, these normalized expression levels of responsive transcripts were determined for a derivation set of clinical E. coli strains in axenic culture, some ciprofloxacin-susceptible and some resistant. These derivation samples were scaled to a Transcriptional Susceptibility Score (exactly analogous to the Squared Pyramidal Distance metric reported in our prior work, but normalized by the expression of the control genes) of 0 for the centroid of susceptible strains, and of 1 for the centroid of resistant strains in transcriptional space. Unknown samples, which included those processed by the Dean Flow Device in this work, were then determined by projection onto a vector between these two centroids in transcriptional space, where scores near 0 are susceptible-like and scores near 1 are resistant-like.
Results
Device design and characterization
In curvilinear channels, particles experience additional lateral drag force (FD) 43 due to the presence of transverse Dean flows arising from centrifugal acceleration of fluid flow 44, which offers high separation resolution 43, 45, 46. Based on the concept of differential inertial focusing and Dean migration, DFF has been used to separate the largest cell components (circulating tumor cells, or CTCs) from whole blood based on the large size difference between CTCs and hematologic cells (CTCs ~10–20 μm; RBC ~8 μm; leukocytes ~7–12 μm) 38. The larger CTCs focus inertially near the channel inner wall while blood cells (RBCs and leukocytes) are predominantly affected by the Dean drag and transposed to the outer wall.
Using this same principle, we sought to apply DFF to achieve highly efficient isolation of viable bacteria (the smallest cells present) from whole blood (Figure 1). In comparison to CTC isolation, inertial focusing of bacteria (< 1 μm) is highly challenging due to the requirement for a much smaller channel cross section (ratio of particle size (ap) to channel hydraulic diameter (Dh), ap/Dh > 0.07; hence Dh ≤ ~10 μm for bacterial focusing) 35 and for higher flow rates that result in large flow-induced channel deformation 47. To address these issues, we needed to modify the channel dimensions to obtain “tight” Dean migration of our small targets (bacteria) towards the outer wall while larger blood cells remain inertially focused at the inner wall. We designed and fabricated a microdevice in polydimethylsiloxane (PDMS) consisting of a 2-inlet, 2-outlet spiral microchannel (500 μm (w) × 80 μm (h)) with a total length of ~10 cm (Figure 1A). As it has been previously reported that particle focusing depends on the shortest channel dimension (microchannel height, h) due to varying shear rates across the channel cross-section (ap/h > 0.07)48, we fixed the channel height at 80 μm so that only the larger leukocytes and RBCs undergo inertial focusing, while platelets and bacteria are solely affected by Dean drag (i.e., only leukocytes and RBCs satisfy the ap/h ~ 0.07 ratio).
Figure 1.

Overview of spiral microchannel device. (A) Schematic illustration of the separation principle for pathogen isolation from blood using Dean Flow Fractionation (DFF). Under the influence of Dean drag forces (FD (orange arrows)), platelets and bacteria migrate along the Dean vortices towards the inner wall, then back to the outer wall again (Dean cycle 1). Larger hematologic cells (RBCs and leukocytes) experience additional strong inertial lift forces (FL (black arrows)) and focus along the microchannel inner wall. (B) Overall workflow for rapid clinical diagnostics from whole blood. The high volume throughput (20 mins/mL of whole blood) and efficient recovery (10–100 bugs/mL) of the spiral device facilitate RNA detection for identification of pathogen and antibiotic susceptibility within 8 hours.
To operate the device (Figure 1B), a blood sample (3× diluted whole blood, ~15% Hct) is pumped into the outer inlet (75 μm width) while sheath fluid (PBS buffer) is pumped through the inner inlet (425 μm width) at a higher flow rate to confine the sample stream near the outer wall. As the sample traverses through the spiral channel, all the cells (bacteria and blood cells) experience a lateral drag force (FD) and migrate towards the inner wall. Larger leukocytes and red blood cells (RBCs) equilibrate near the inner wall as they experience strong inertial lift forces (FL) which prevent them from migrating further under the influence of Dean drag, while smaller platelets and bacteria continue flowing along the Dean vortices and recirculate towards the outer wall, thus completing a full Dean cycle (DC 1).
With the set dimensions, we empirically determined the optimal flow rate to be 1700 μLmin−1 using fluorescent E. coli bioparticles spiked in PBS buffer (Fig. S1). At this flow rate, bacteria (ap/h ≪ 0.07), achieved a full recirculation prior to outlet bifurcation and sorted into the bacterial outlet (200 μm width) (Movie S1).
To determine the maximum sample hematocrit that the spiral chip can process, whole blood (~45% Hct) diluted to various concentrations was pumped through the device at the same optimized flow condition (DC 1). At high hematocrits, the inertially-focused RBC band broadened due to dispersion induced by cell-cell interactions (Fig. S2). We found that a final hematocrit of ~15% (3-fold dilution) or less was optimal and resulted in minimal RBC contamination at the bacterial outlet (Movie S2). Combining the flow rate (150 μL min−1) with this dilution factor, this translates to ~20 minutes to process 1 mL of whole blood (with a 45% Hct) per chip; throughput can be further scaled up with additional chips placed in parallel 49.
Differential Dean migration and inertial focusing of bacteria and blood cells
To test the distinct influence of Dean migration and inertial focusing on different cell types, we first loaded the device with samples of either RBCs or fluorescent E. coli bioparticles. We imaged their equilibrium positions at different points along the device channel at DC 1, using high speed imaging for RBCs and average composite fluorescent images for bacteria (Fig. 2A). The smaller bacteria (<1 μm) migrated completely towards the inner wall at position 2 while larger RBCs (~6–8 μm) experienced higher Stokes’ drag (∝ particle size, ap) and resulted in slower lateral migration. Once the RBCs reached the inner wall (position 3), they experienced additional inertial forces and remained focused along the channel inner wall until their removal into the waste outlet (position 4). In contrast, bacteria continued to migrate as a tight band (< 200 μm wide) towards the outer wall and into the bacterial outlet.
Figure 2.

Device characterization using bacteria and whole blood at Dean Cycle 1 (DC 1). (A) Optical image of the PDMS-fabricated spiral device (microchannel was filled with blue dye for visualization). Equilibrium positions of FITC-conjugated E. coli bioparticles (averaged composite images) and RBCs (high speed images) illustrate their differences in Dean migration and inertial focusing along the channel. Corresponding positions of the captured images are shown on the device. (B) Recovery plot (log scale) indicating high bacterial recovery (>65%) over a range of bacterial loads (E. coli) spiked into 1 mL of whole blood. (C) Histogram plot indicates the bacterial load and recovery for different pathogenic strains at clinically relevant concentrations (~10–50 cells/mL). Bacteria were successfully detected as colony forming units (cfu) from the bacterial outlet in all cases.
We also tested leukocytes in the device using high-speed imaging. Similar to RBCs, larger leukocytes focused tightly near the inner wall due to appreciable inertial forces (ap/h > 0.07) (Fig. S3). This is important as efficient separation of nucleated leukocytes (~5–10 million per mL) from the bacterial outlet significantly reduces background noise for subsequent nucleic acid detection and analysis of clinically relevant pathogen loads (~10–100 cells per mL).
Finally, we used whole blood stained with immunofluorescence markers (CD41a for platelets, CD45 for leukocytes) or spiked with fluorescent E. coli bioparticles to quantify separation efficiency at DC 1 using flow cytometry. Using blood samples spiked with a high bacteria concentration (~106/mL), a bacterial recovery of ~75% was achieved in the bacterial outlet; the incomplete recovery could be attributed to RBCs hindering the complete Dean migration of bacteria towards the outer channel wall (Fig. S3). Platelet recovery at the bacterial outlet was also lower (~40%) due to the larger cell size (~2–3 μm), resulting in higher Stokes’ drag as they traversed laterally across the channel width.
Efficient bacterial recovery at low bacterial load
To determine bacterial recovery, we spiked E. coli (clinical isolate) into 1 mL of whole blood over a range of bacterial loads and processed the spiked samples using the spiral device. The outflow streams collected from the bacterial outlet were then centrifuged, resuspended in a smaller volume (~100 μL), and collected bacteria were enumerated by cfu count on LB agar plates. A high bacterial recovery (>65%) was achieved for a range of load concentrations (102~104/mL) (Fig. 2B). We further compared the separation performance of our spiral device with low speed centrifugation of whole blood to recover plasma-borne bacteria across a range of bacterial concentrations (see Methods for details). Under centrifugation conditions that achieved similar RBC removal (103~104 -fold RBC reduction), bacterial recovery in the plasma of centrifuged samples was significantly lower (~30%) across all tested bacterial concentrations, thus demonstrating the superior separation performance of our spiral device and its potential for clinical applications (Fig. S4). Moreover, the bacteria recovered in the platelet-rich plasma fraction were unsuitable for further enrichment for downstream molecular analysis, as the sample clotted when concentrated.
We next assessed the ability of our device to isolate different clinically relevant bacterial species (E. coli, Pseudomonas aeruginosa, Staphylococcus aureus, and Enterococcus faecalis) at low concentrations (~10–50 organisms/mL) that are characteristic of bacteremias 17, representing several distinct classes of important bacterial pathogens with different shapes and surface characteristics: enteric and non-enteric Gram negative rods, and Gram positive cocci. 1 mL of blood spiked with clinical isolates of these different bacterial species were processed in the device, followed by plating the outflow stream collected from the bacterial outlet. In all 20 samples spiked with only 10–50 bacteria, bacteria were successfully recovered (Fig. 2C), clearly demonstrating the versatility of our label-free separation approach to isolate diverse bacterial pathogens based on physical properties rather than affinity for surface epitopes. Our device operates at high flow rates to reproducibly isolate small numbers of pathogens from whole blood despite a large excess of host blood cells (~109/mL), which is an important feature for detection of low-abundance bacteria in blood.
RNA-based pathogen detection
Current standard diagnostic methods such as organism identification and susceptibility determination on the VITEK-2 50, 51 require culturing blood to organism densities greater than 106 cfu/mL, with attendant delays required for bacterial replication and expansion. The potential for DFF to accelerate the diagnosis of bacteremia is feasible not only because of its ability to rapidly process large volumes (mLs) of infected blood but also because it is able to isolate bacteria into a buffer solution that facilitates rapid and sensitive molecular analysis steps. Direct molecular detection of bacteria is not reliable from whole blood because of inhibitory factors that prevent robust molecular biology 21, 22. In contrast, we sought to demonstrate that we could directly detect and identify bacteria from blood that has been processed through our DFF device without the time delay required for bacterial replication and expansion. In order to obtain the sensitivity required for the detection of ~100 bacteria per 1 mL of DFF processed, infected blood, we applied a modified version of the principle of hybridization-based RNA detection that we have previously described 16 for identifying pathogens and detecting transcriptional signatures of antibiotic susceptibility.
Species identification through rRNA detection
In order to identify bacteria at low organism burden that approaches the uncultured pathogen burden in clinical bacteremia, estimated at 10–100 cfu/mL 17, we used NanoString (NanoString Technologies, Seattle WA) technology for multiplexed, quantitative RNA detection 40 directly from sorted blood samples. To achieve the desired degree of sensitivity, we modified our previous approach to target rRNA rather than mRNA. rRNA is a naturally abundant RNA species 52, 53 with an estimated >1000-fold excess over even the most abundant mRNA, thereby enabling detection of very low numbers of bacteria without amplification 17, 41. Its sequence is highly conserved within a bacterial species, and even quite conserved across many different bacterial species 54, 55. Nevertheless, we were able to identify variable regions of the 16S and 23S rRNA molecules that were sufficiently divergent between species of interest that, even given the hybridization rules required for NanoString probes, we could distinguish three clinically important Gram-negative pathogens, E. coli (Ec), Klebsiella pneumoniae (Kp), and P. aeruginosa (PsA), when grown in axenic culture (Fig. 3, left column). We were able to design at least one probe pair that specifically recognized each of these species (Supp. Fig S5). For the two closely-related Enterobacteriaceae species E. coli and K. pneumoniae, we further designed additional probes that recognized either of these two pathogens but not P. aeruginosa (Ec/Kp).
Figure 3.

Pathogen identification from blood after DFF by rRNA recognition. (A) E. coli, (B) K. pneumoniae, or (C) P. aeruginosa were either grown to mid-log phase in axenic culture and diluted 1:1000 (left panel); inoculated at 1000 cfu/mL in whole blood (middle panel); or inoculated at 1000 cfu/mL in whole blood, processed by DFF, and concentrated (right panel) before being detected by the NanoString assay using a probeset directed against rRNA from these three organisms (see Methods for details). On each graph, bars 1–3 represent E. coli-specific probes (Ec = blue), bars 4–7 represent probes that recognize either E. coli or K. pneumoniae but not P. aeruginosa (Ec/Kp = purple), bar 8 represents a K. pneumoniae-specific probe (Kp = red), and bars 9–13 represent P. aeruginosa-specific probes (PsA = green). Organism burden was enumerated by plating for CFU enumeration.
We next tested the ability of rRNA detection to identify bacteria isolated from our spiral device. We inoculated 1 mL of whole blood with one of these three common pathogens at 1000 cfu/mL, which is >3 orders of magnitude lower than the current threshold for detecting positive blood cultures in a BACTEC system. We passed these samples over the spiral device and subjected the bacterial outlet stream to RNA detection by hybridization using the NanoString assay. Attempts to identify the infecting bacteria from whole blood that has not been processed by the spiral device results in an uninterpretable hybridization pattern that fails to identify the pathogen (Fig. 3, middle column; Fig S6) due to interference from blood products and cells. In contrast, after processing on the spiral device followed by concentration of the bacterial stream, each species was readily identified from the blood sample based on its characteristic rRNA hybridization pattern (Fig. 3, right column), which paralleled that from axenic culture. This method can currently be performed in its entirety in under 8 hours, including both sample processing and RNA detection.
We repeated this procedure with all 3 possible pairwise combinations of these three pathogens at 1000 cfu/mL apiece (Fig. 4A). Signal from each rRNA probe pair is aggregated into a single Organism Score metric as described in Methods. Each organism present was readily detected, while the absent organism was not.
Figure 4.

Detection of pathogens in multiple combinations or at very low organism burden by rRNA recognition. (A) Each of the 3 possible pairwise combinations of E. coli, K. pneumoniae, and P. aeruginosa were inoculated into whole blood at 1000 cfu/mL, processed by DFF, and concentrated before being detected by the NanoString rRNA detection assay. (B) E. coli, K. pneumoniae, or P. aeruginosa were inoculated into whole blood at 100 cfu/mL, processed by DFF, and concentrated before being detected by the NanoString rRNA detection assay. In both panels, normalized probe counts from the NanoString assay were converted into a single Organism Score as described in Methods. Organism burden was enumerated by plating for CFU.
We also repeated this procedure with 100 cfu/mL of each pathogen individually (Fig. 4B), which enters the range of bacterial burden in the uncultured blood of septic patients 17. In order to obtain meaningful signal, we processed 3 mL of inoculated whole blood rather than 1 mL (~10 mL of blood are recommended and routinely collected for blood culture in patients with suspected bacteremia). We could unambiguously identify each of these three pathogens at this physiologically important organism burden, again demonstrated by the aggregated metric, Organism Score.
Antibiotic susceptibility determination through mRNA detection
We have previously reported that quantification of an expression signature, which consists of selected mRNAs, after antibiotic exposure can distinguish susceptible organisms from resistant ones 16, but we had not previously demonstrated that these mRNA signatures can determine antibiotic susceptibility of bacteria in blood samples. Here we validate this method for antibiotic susceptibility testing in blood that was processed using our spiral device (Fig. 5A). Clinical E. coli isolates that were either susceptible or resistant to ciprofloxacin (a fluoroquinolone antibiotic) were spiked at 105/mL into 1 mL of blood and processed on the spiral device. Bacteria obtained from the outlet were exposed to ciprofloxacin for 30 minutes prior to lysis, and the resulting lysate was subjected to NanoString detection of a set of transcripts that is differentially expressed in susceptible versus resistant organisms after antibiotic exposure 41, 42. The expression levels of these transcripts can be mathematically transformed into a Transcriptional Susceptibility Score as described in Methods that is able to distinguish between susceptible and resistant strains (Fig. 5B, solid symbols). After processing on the spiral device, we were able to readily distinguish blood samples spiked with susceptible versus resistant organisms based on the Transcriptional Susceptibility Score as measured by the NanoString assay (Fig. 5B, open symbols).
Because of the lower abundance of mRNA compared to rRNA, the current level of sensitivity of Nanostring requires 105 cfu/mL for direct susceptibility testing, which exceeds the concentration of bacteria in most bacteremias. However, this current level of sensitivity is still over an order of magnitude better than current requirements for pathogen identification and characterization of the antibiotic susceptibility patterns from a positive blood culture in a clinical microbiology laboratory (>106 cfu/mL) 56. In order to demonstrate this, we inoculated a BACTEC blood culture bottle (identical to those used in clinical microbiology labs) with 1 cfu/mL of E. coli and incubated it for 7.5 hours at 37°C until it reached a concentration of >105 cfu/mL. This cultured blood was then separated on the spiral device, and the bacteria collected at the outlet were subjected to mRNA detection by NanoString to determine ciprofloxacin susceptibility. Susceptible or resistant strains prepared in this manner could likewise be easily distinguished (Fig 5B, starred symbols).
Discussion
New infectious disease diagnostics to rapidly identify pathogens and provide antibiotic susceptibilities are desperately needed in this era of increasing antibiotic resistance. Such tests are needed to guide improved, early therapeutic decision making with likely mortality benefit in the case of severe infections like septic shock. Toward that end, we have developed a method to isolate low-abundance bacteria from infected blood that allows their direct, sensitive and rapid detection, approaching limits of detection that would permit identification without requiring the time for culture.
The Dean Flow Fractionation (DFF) cell sorting technology described here and applied to bacterial isolation was previously developed by our group for direct isolation of circulating tumor cells (CTCs) from whole blood 38. Unlike CTCs (~10–20 μm), bacteria (< 1 μm) are significantly smaller and therefore challenging to focus using conventional inertial microfluidics 37. To overcome this, we introduced a sheath flow at the inlet to “pinch” the bacteria-containing sample and demonstrated well-controlled Dean migration of bacteria towards the outer wall to achieve efficient bacteria recovery, even over a large background of other cells. This enables continuous, species-independent isolation of bacteria from whole blood without laborious affinity-based target labeling. In addition, this process leaves the recovered cells in a buffer of our choice (sheath fluid), significantly facilitating direct downstream molecular detection assays by removing cellular components of blood and diluting serum-borne inhibitory factors.
We have coupled this novel isolation technology to a highly sensitive and rapid method for bacterial identification and antibiotic susceptibility testing that we have previously developed based on RNA hybridization (NanoString) with a fluorescent barcoded detection system to quantitatively detect levels of specific RNA transcripts. Due to the extremely low abundance of bacterial pathogens in blood, a vast majority of past attempts at early pathogen detection from blood rely on polymerase chain reaction (PCR) based amplification of pathogen-specific targets. While target-specific amplification even from a single copy is theoretically possible, in reality many practical challenges limit the use of PCR-based techniques for the detection of low-abundance bloodborne pathogens, including expertise required, expense, false negatives from inhibitors in serum, inability to sufficiently concentrate the starting sample, and false positives from contaminants. Our work here addresses these significant challenges of sample preparation and detection by combining high-volume label-free pathogen separation (inertial microfluidics) with non-enzymatic nucleic acid detection (NanoString). A unique feature of our microfluidic separation technique is minimal sample preparation and simple device setup and operation (only syringe pumps are required). By achieving separation of pathogens from the dominant cellular constituents of blood into a common buffer (here, phosphate-buffered saline), this novel spiral device permits concentration of these pathogens far beyond that achievable in whole blood, into a solution that is compatible with many downstream molecular diagnostic techniques. The ability of this device to interface with such diagnostic methods is exemplified here by its compatibility with a commercially available RNA detection system. RNA detection represents a novel detection method that shows promise as a diagnostic modality in clinical infectious disease, both for sensitive species identification and for rapid phenotypic antibiotic susceptibility determination 16. In fact, a NanoString-based assay has recently been cleared by the FDA as a diagnostic test for improved prognostication through transcriptional phenotyping of clinical samples from patients with breast cancer 57.
Coupling this novel bacterial separation microdevice to RNA detection facilitates multiple important diagnostic goals. First, species-specific rRNA detection from the enriched bacterial fraction enables highly sensitive detection of bacteria from blood, an improvement of over 100-fold in sensitivity from our prior efforts with mRNA detection for species identification 16 that importantly approaches the critical threshold required to directly detect pathogens from the blood of bacteremic patients without requiring time for culture, although further refinements are needed to fully realize this degree of sensitivity. The limit of detection of this approach is set by the sensitivity of the RNA detection assay and interface between the separation and detection modules due to mass of remaining host platelets. Improving either platelet removal and concentration, or RNA detection efficiency, offer avenues for improvement in a next generation detection module. Second, detection of antibiotic-responsive mRNA transcripts allows rapid determination of the antibiotic susceptibility of populations of bacteria from cultured blood in under 8 hours, much faster than current methods which require days for subculture and then growth in the presence of antibiotics from the time of a blood culture turns positive.
This extension of the concepts underlying our previous work of RNA detection for pathogen identification and antibiotic susceptibility determination 16, facilitated by a novel microfluidic cell separation device to apply directly to blood samples for the first time, thus represents important progress in infectious disease diagnostics. By coupling microfluidic cell separation techniques with validated RNA detection methods to improve the interface between clinical samples and downstream molecular diagnostics, the potential exists for further improvements to increase the sensitivity and decrease the time required for diagnosing bacteremias in patients.
Supplementary Material
Acknowledgments
This work is supported by the use of MIT’s Microsystems Technology Laboratories, as well as the financial support by DARPA DLT (Dialysis-Like Therapeutics) program, under SSC Pacific grant N66001-11-1-4182. This work was also conducted with the support of a KL2/Catalyst Medical Research Investigator Training award (an appointed KL2 award, to R.P.B.) from Harvard Catalyst | The Harvard Clinical Translational Science Center (National Center for Research Resources and the National Center for Advancing Translational Sciences, National Institutes of Health Award 1KL2TR001100-01). The content is solely the responsibility of the authors and does not represent the official views of Harvard Catalyst, Harvard University and its affiliated academic health care centers, the National Institutes of Health, or DARPA. H.W.H. is supported by Lee Kong Chian School of Medicine (LKCMedicine, Singapore) Postdoctoral Fellowship.
Footnotes
Author contribution
H.W.H., R.P.B., D.T.H. and J.H. designed research, H.W.H., R.P.B. performed experiments and analyzed the data. All authors wrote the manuscript.
Competing financial interests: H.W.H, R.P.B., D.T.H. and J.H., along with others, have filed a patent application on the technology described here.
References
- 1.Morens DM, Folkers GK, Fauci AS. Nature. 2004;430:242–249. doi: 10.1038/nature02759. [DOI] [PMC free article] [PubMed] [Google Scholar]
- 2.Fauci AS, Morens DM. New England Journal of Medicine. 2012;366:454–461. doi: 10.1056/NEJMra1108296. [DOI] [PubMed] [Google Scholar]
- 3.Jawad I, Luksic I, Rafnsson SB. Journal of global health. 2012;2:010404. doi: 10.7189/jogh.02.010404. [DOI] [PMC free article] [PubMed] [Google Scholar]
- 4.Martin GS. Expert review of anti-infective therapy. 2012;10:701–706. doi: 10.1586/eri.12.50. [DOI] [PMC free article] [PubMed] [Google Scholar]
- 5.Kothari A, Morgan M, Haake DA. Clinical Infectious Diseases. 2014;59:272–278. doi: 10.1093/cid/ciu292. [DOI] [PMC free article] [PubMed] [Google Scholar]
- 6.I. D. S. o. America. Clinical Infectious Diseases. 2011;52:S384–S395. doi: 10.1093/cid/cir055. [DOI] [PubMed] [Google Scholar]
- 7.Ince J, McNally A. Expert Review of Medical Devices. 2009;6:641–651. doi: 10.1586/erd.09.46. [DOI] [PubMed] [Google Scholar]
- 8.Weile J, Knabbe C. Analytical and Bioanalytical Chemistry. 2009;394:731–742. doi: 10.1007/s00216-009-2779-8. [DOI] [PMC free article] [PubMed] [Google Scholar]
- 9.Clark AE, Kaleta EJ, Arora A, Wolk DM. Clinical Microbiology Reviews. 2013;26:547–603. doi: 10.1128/CMR.00072-12. [DOI] [PMC free article] [PubMed] [Google Scholar]
- 10.Strommenger B, Kettlitz C, Werner G, Witte W. Journal of Clinical Microbiology. 2003;41:4089–4094. doi: 10.1128/JCM.41.9.4089-4094.2003. [DOI] [PMC free article] [PubMed] [Google Scholar]
- 11.Kumar A, Roberts D, Wood KE, Light B, Parrillo JE, Sharma S, Suppes R, Feinstein D, Zanotti S, Taiberg L, Gurka D, Kumar A, Cheang M. Critical Care Medicine. 2006;34:1589–1596. doi: 10.1097/01.CCM.0000217961.75225.E9. [DOI] [PubMed] [Google Scholar]
- 12.Fournier PE, Drancourt M, Colson P, Rolain JM, Scola BL, Raoult D. Nat Rev Micro. 2013;11:574–585. doi: 10.1038/nrmicro3068. [DOI] [PMC free article] [PubMed] [Google Scholar]
- 13.Lupo A, Papp-Wallace KM, Sendi P, Bonomo RA, Endimiani A. Diagnostic microbiology and infectious disease. 2013;77:179–194. doi: 10.1016/j.diagmicrobio.2013.06.001. [DOI] [PMC free article] [PubMed] [Google Scholar]
- 14.Carroll K. Molecular Diagnosis & Therapy. 2008;12:15–24. doi: 10.1007/BF03256265. [DOI] [PubMed] [Google Scholar]
- 15.Jolivet-Gougeon A, Kovacs B, Le Gall-David S, Le Bars H, Bousarghin L, Bonnaure-Mallet M, Lobel B, Guillé F, Soussy CJ, Tenke P. Journal of Medical Microbiology. 2011;60:563–573. doi: 10.1099/jmm.0.024083-0. [DOI] [PubMed] [Google Scholar]
- 16.Barczak AK, Gomez JE, Kaufmann BB, Hinson ER, Cosimi L, Borowsky ML, Onderdonk AB, Stanley SA, Kaur D, Bryant KF, Knipe DM, Sloutsky A, Hung DT. Proceedings of the National Academy of Sciences; 2012; [DOI] [PMC free article] [PubMed] [Google Scholar]
- 17.Yagupsky P, Nolte FS. Clinical Microbiology Reviews. 1990;3:269–279. doi: 10.1128/cmr.3.3.269. [DOI] [PMC free article] [PubMed] [Google Scholar]
- 18.Chang SS, Hsieh WH, Liu TS, Lee SH, Wang CH, Chou HC, Yeo YH, Tseng CP, Lee CC. PLoS ONE. 2013;8:e62323. doi: 10.1371/journal.pone.0062323. [DOI] [PMC free article] [PubMed] [Google Scholar]
- 19.Wellinghausen N, Kochem AJ, Disqué C, Mühl H, Gebert S, Winter J, Matten J, Sakka SG. Journal of Clinical Microbiology. 2009;47:2759–2765. doi: 10.1128/JCM.00567-09. [DOI] [PMC free article] [PubMed] [Google Scholar]
- 20.Murray PR, Masur H. Critical Care Medicine. 2012;40:3277–3282. doi: 10.1097/CCM.3270b3013e318270e318771. [DOI] [PMC free article] [PubMed] [Google Scholar]
- 21.Gosiewski T, Szała L, Pietrzyk A, Brzychczy-Włoch M, Heczko P, Bulanda Mg. Current Microbiology. 2014;68:149–155. doi: 10.1007/s00284-013-0451-1. [DOI] [PMC free article] [PubMed] [Google Scholar]
- 22.Gosiewski T, Brzychczy-Włoch M, Pietrzyk A, Sroka A, Bulanda M. Acta Biochimica Polonica. 2013;60:603–606. [PubMed] [Google Scholar]
- 23.García-Garrote F, Cercenado E, Marín M, Bal M, Trincado P, Corredoira J, Ballesteros C, Pita J, Alonso P, Vindel A. Journal of Antimicrobial Chemotherapy. 2014;69:45–50. doi: 10.1093/jac/dkt327. [DOI] [PubMed] [Google Scholar]
- 24.Paterson GK, Harrison EM, Holmes MA. Trends in Microbiology. 2013;22:42–47. doi: 10.1016/j.tim.2013.11.003. [DOI] [PMC free article] [PubMed] [Google Scholar]
- 25.Francois P, Bento M, Renzi G, Harbarth S, Pittet D, Schrenzel J. Journal of Clinical Microbiology. 2007;45:2011–2013. doi: 10.1128/JCM.00232-07. [DOI] [PMC free article] [PubMed] [Google Scholar]
- 26.Boedicker JQ, Li L, Kline TR, Ismagilov RF. Lab on a Chip. 2008;8:1265–1272. doi: 10.1039/b804911d. [DOI] [PMC free article] [PubMed] [Google Scholar]
- 27.Mahalanabis M, Al-Muayad H, Kulinski MD, Altman D, Klapperich CM. Lab on a Chip. 2009;9:2811–2817. doi: 10.1039/b905065p. [DOI] [PubMed] [Google Scholar]
- 28.Cady NC, Stelick S, Kunnavakkam MV, Batt CA. Sensors and Actuators B: Chemical. 2005;107:332–341. [Google Scholar]
- 29.Boehm DA, Gottlieb PA, Hua SZ. Sensors and Actuators B: Chemical. 2007;126:508–514. [Google Scholar]
- 30.Xia N, Hunt T, Mayers B, Alsberg E, Whitesides G, Westervelt R, Ingber D. Biomedical Microdevices. 2006;8:299–308. doi: 10.1007/s10544-006-0033-0. [DOI] [PubMed] [Google Scholar]
- 31.Yung CW, Fiering J, Mueller AJ, Ingber DE. Lab on a Chip. 2009;9:1171–1177. doi: 10.1039/b816986a. [DOI] [PubMed] [Google Scholar]
- 32.Lee JJ, Jeong KJ, Hashimoto M, Kwon AH, Rwei A, Shankarappa SA, Tsui JH, Kohane DS. Nano Letters. 2014;14:1–5. doi: 10.1021/nl3047305. [DOI] [PubMed] [Google Scholar]
- 33.Cho YK, Lee JG, Park JM, Lee BS, Lee Y, Ko C. Lab on a Chip. 2007;7:565–573. doi: 10.1039/b616115d. [DOI] [PubMed] [Google Scholar]
- 34.Kang JH, Super M, Yung CW, Cooper RM, Domansky K, Graveline AR, Mammoto T, Berthet JB, Tobin H, Cartwright MJ, Watters AL, Rottman M, Waterhouse A, Mammoto A, Gamini N, Rodas MJ, Kole A, Jiang A, Valentin TM, Diaz A, Takahashi K, Ingber DE. Nat Med. 2014 doi: 10.1038/nm.3640. advance online publication. [DOI] [PubMed] [Google Scholar]
- 35.Di Carlo D, Irimia D, Tompkins RG, Toner M. Proc Natl Acad Sci U S A. 2007;104:18892–18897. doi: 10.1073/pnas.0704958104. [DOI] [PMC free article] [PubMed] [Google Scholar]
- 36.Hur SC, Henderson-MacLennan NK, McCabe ERB, Di Carlo D. Lab on a Chip. 2011;11:912–920. doi: 10.1039/c0lc00595a. [DOI] [PubMed] [Google Scholar]
- 37.Mach AJ, Di Carlo D. Biotechnol Bioeng. 2010;107:302–311. doi: 10.1002/bit.22833. [DOI] [PubMed] [Google Scholar]
- 38.Hou HW, Warkiani ME, Khoo BL, Li ZR, Soo RA, Tan DS-W, Lim W-T, Han J, Bhagat AAS, Lim CT. Sci Rep. 2013;3 doi: 10.1038/srep01259. [DOI] [PMC free article] [PubMed] [Google Scholar]
- 39.Hou HW, Bhagat AAS, Chong AGL, Mao P, Tan KSW, Han J, Lim CT. Lab on a Chip. 2010;10:2605–2613. doi: 10.1039/c003873c. [DOI] [PubMed] [Google Scholar]
- 40.Geiss GK, Bumgarner RE, Birditt B, Dahl T, Dowidar N, Dunaway DL, Fell HP, Ferree S, George RD, Grogan T, James JJ, Maysuria M, Mitton JD, Oliveri P, Osborn JL, Peng T, Ratcliffe AL, Webster PJ, Davidson EH, Hood L, Dimitrov K. Nat Biotech. 2008;26:317–325. doi: 10.1038/nbt1385. [DOI] [PubMed] [Google Scholar]
- 41.Bhattacharyya RP, Boykin R, Livny J, Hung DT. 2014 Manuscript in preparation. [Google Scholar]
- 42.Shishkin AA, Giannoukos G, Kucukural A, Ciulla D, Busby M, Surka C, Chen J, Bhattacharyya RP, Rudy RF, Patel MM, Novod T, Hung DT, Gnirke A, Garber M, Guttman M, Livny J. 2014 doi: 10.1038/nmeth.3313. Submitted. [DOI] [PMC free article] [PubMed] [Google Scholar]
- 43.Bhagat AAS, Kuntaegowdanahalli SS, Papautsky I. Lab on a Chip. 2008;8:1906–1914. doi: 10.1039/b807107a. [DOI] [PubMed] [Google Scholar]
- 44.Dean W. Philosophical Magazine Series 7. 1928;5:673–695. [Google Scholar]
- 45.Kuntaegowdanahalli SS, Bhagat AAS, Kumar G, Papautsky I. Lab on a Chip. 2009;9:2973–2980. doi: 10.1039/b908271a. [DOI] [PubMed] [Google Scholar]
- 46.Wu L, Guan G, Hou HW, Bhagat AAS, Han J. Analytical Chemistry. 2012;84:9324–9331. doi: 10.1021/ac302085y. [DOI] [PubMed] [Google Scholar]
- 47.Sollier E, Murray C, Maoddi P, Di Carlo D. Lab on a Chip. 2011;11:3752–3765. doi: 10.1039/c1lc20514e. [DOI] [PubMed] [Google Scholar]
- 48.Bhagat AAS, Kuntaegowdanahalli SS, Papautsky I. Physics of Fluids. 2008;20:101702. [Google Scholar]
- 49.Warkiani ME, Khoo BL, Tan DSW, Bhagat AAS, Lim WT, Yap YS, Lee SC, Soo RA, Han J, Lim CT. Analyst. 2014;139:3245–3255. doi: 10.1039/c4an00355a. [DOI] [PubMed] [Google Scholar]
- 50.Ligozzi M, Bernini C, Bonora MG, de Fatima M, Zuliani J, Fontana R. Journal of Clinical Microbiology. 2002;40:1681–1686. doi: 10.1128/JCM.40.5.1681-1686.2002. [DOI] [PMC free article] [PubMed] [Google Scholar]
- 51.Funke G, Funke-Kissling P. Journal of Clinical Microbiology. 2004;42:4067–4071. doi: 10.1128/JCM.42.9.4067-4071.2004. [DOI] [PMC free article] [PubMed] [Google Scholar]
- 52.Taniguchi Y, Choi PJ, Li GW, Chen H, Babu M, Hearn J, Emili A, Xie XS. Science. 2010;329:533–538. doi: 10.1126/science.1188308. [DOI] [PMC free article] [PubMed] [Google Scholar]
- 53.Amann RI, Binder BJ, Olson RJ, Chisholm SW, Devereux R, Stahl DA. Applied and environmental microbiology. 1990;56:1919–1925. doi: 10.1128/aem.56.6.1919-1925.1990. [DOI] [PMC free article] [PubMed] [Google Scholar]
- 54.Woese CR. Microbiological reviews. 1987;51:221–271. doi: 10.1128/mr.51.2.221-271.1987. [DOI] [PMC free article] [PubMed] [Google Scholar]
- 55.Clarridge JE., 3rd Clin Microbiol Rev. 2004;17:840–862. doi: 10.1128/CMR.17.4.840-862.2004. table of contents. [DOI] [PMC free article] [PubMed] [Google Scholar]
- 56.US Pat. 1998 [Google Scholar]
- 57.Nielsen T, Wallden B, Schaper C, Ferree S, Liu S, Gao D, Barry G, Dowidar N, Maysuria M, Storhoff J. BMC Cancer. 2014;14:177. doi: 10.1186/1471-2407-14-177. [DOI] [PMC free article] [PubMed] [Google Scholar]
Associated Data
This section collects any data citations, data availability statements, or supplementary materials included in this article.