Abstract
Objective
Ventricular kinetic energy measurements may provide a novel imaging biomarker of declining ventricular efficiency in patients with repaired Tetralogy of Fallot (rTOF). Our purpose was to assess differences in ventricular kinetic energy (KE) with four-dimensional (4D) Flow MRI between patients with rTOF and healthy volunteers.
Methods
Cardiac MR (CMR), including 4D Flow MRI, was performed at rest in 10 subjects with rTOF and nine healthy volunteers using clinical 1.5T and 3T MRI scanners. Right and left ventricular kinetic energy (KERV and KELV), main pulmonary artery flow (QMPA), and aortic flow (QAO) were quantified using 4D Flow MRI data. Right and left ventricular size and function were measured using standard CMR techniques. Differences in peak systolic KERV and KELV in addition to the QMPA/KERV and QAO/KELV ratios between groups were assessed. KE indices were compared to conventional CMR parameters.
Results
Peak systolic KERV and KELV were higher in rTOF subjects (6.06±2.27mJ and 3.55±2.12mJ, respectively) than healthy volunteers (5.47±2.52mJ and 2.48±0.75mJ, respectively) but not statistically significant (p= .65 and p= .47, respectively). The QMPA/KERV and QAO/KELV ratios were lower in rTOF subjects (7.53±5.37mL/(cycle-mJ) and 9.65±6.61mL/(cycle-mJ), respectively) than healthy volunteers (19.33±18.52mL/(cycle-mJ) and 35.98±7.66mL/(cycle-mJ), respectively; p< .05). QMPA/KERV and QAO/KELV were weakly correlated to ventricular size and function.
Conclusions
Greater ventricular KE is necessary to generate flow in the pulmonary and aortic circulations in rTOF. Quantification of ventricular KE in patients with rTOF is a new observation. Future studies are needed to determine if changes in ventricular KE can provide earlier evidence of ventricular dysfunction and guide future medical and surgical interventions.
Background
Without surgical intervention, the natural history of Tetralogy of Fallot (TOF) can lead to mortality rates of 25% in infants with severe obstruction within the first year of life and up to 95% by age 40 years.1 Tetralogy of Fallot is the most common cyanotic congenital heart disease accounting for 9-14% of all congenital cardiovascular defects.2 With advancements in technology and surgical technique, most patients now undergo corrective surgical repair early in life and live into adulthood. Surgical correction of Tetralogy of Fallot typically involves ventricular septal defect closure, relief of right ventricular outflow tract obstruction, disruption of the pulmonary valve that results in pulmonary regurgitation, and placement of an outflow patch.3 Expected postoperative pulmonary regurgitation has been associated with progressive right ventricular dilatation and ventricular dysfunction.4 Alterations in hemodynamics that frequently occur after repair ultimately contribute to poor long-term outcomes, including progressive exercise intolerance, ventricular arrhythmia, and sudden cardiac death.5
Cardiac MR (CMR) has become the gold standard to monitor patients with repaired Tetralogy of Fallot (rTOF). Volumetric and functional CMR parameters are used to guide the decision of when to perform pulmonary valve replacement in order to protect from the long term sequelae of chronic pulmonary insufficiency.6 Monitoring with conventional CMR relies on detecting underlying morphologic changes such as RV dilatation to signify dysfunction. The newer 4D Flow MRI technique can detect abnormal right ventricular diastolic flow patterns in rTOF even when RV volumes or function are not substantially abnormal.7,8 Although pulmonary valve replacement results in reversal of RV dilation, the risk of cardiac death and arrhythmias may not be averted.9 More sensitive markers of RV dysfunction could help guide therapy and timing of pulmonary valve insertion.
Ventricular kinetic energy (KE) measurements provide a novel method of monitoring cardiac function10,11 and may provide an earlier imaging biomarker of declining ventricular efficiency in rTOF patients compared with conventional measurements of ventricular size and function, which are based on morphological changes. Previous studies have demonstrated the feasibility of calculating KE non-invasively with 4D flow MRI.12,13 In addition, 4D flow MRI provides aortic and main pulmonary artery flow data allowing the relationship of kinetic energy and the generated ventricular outflow to be evaluated. Traditionally, the ventricular-vascular relationship or coupling is described by elastance of each component, derived from pressure volume loops.14 With the availability of 4D flow MR, an analogous ventricular kinetic energy and vascular outflow relationship can also be studied. To our knowledge, there have been no previous studies that have examined ventricular kinetic energy measurements in patients with rTOF. The purpose of this study was to assess differences in ventricular kinetic energy between rTOF and healthy volunteers using 4D flow magnetic resonance imaging.
Methods
Subjects
This single-center prospective cohort study was approved by the university Institutional Review Board. Data was acquired in compliance with all applicable Health Insurance Portability and Accountability Act regulations. Written informed consent was obtained from all subjects ≥18 years of age. For subjects ≤18 years of age, written informed consent was obtained from parents or legal guardians and assent obtained from subjects ≥6 years of age. Ten patients with repaired Tetralogy of Fallot (age 20.6 ± 12.2 years) and nine healthy volunteers (age 38.9 ± 15.1 years) were included in this study. Healthy volunteers responded to public recruitment advertisements and were selected to participate after passing a health screening for cardiovascular disease. All subjects underwent CMR examinations after obtaining appropriate consent/assent.
Cardiac MR
In rTOF subjects, the clinically indicated CMR done to measure ventricular size and function was followed by an investigational 4D Flow MRI acquisition. rTOF subjects were scanned at either 1.5T (HDx, GE Healthcare, Waukesha, WI) or 3.0T (MR750, GE Healthcare, Waukesha, WI), depending on clinical availability of the scanners at the time of the exam and need for sedation. In healthy volunteers, 4D Flow MRI and 2D cine balanced steady state free precession (bSSFP) were performed on 3.0T scanners (MR750, GE Healthcare, Waukesha, WI).
Details of the 4D Flow MRI sequence, Phase Contrast with Vastly undersampled Isotropic Projection Reconstruction (PC VIPR), have been reported previously.7,15 Briefly, 4D Flow MRI parameters were as follows: field-of-view = 260-320mm, spatial resolution = 1.3mm isotropic, repetition time = 8.8-10.9ms (1.5T) and 6.2-3.7 (3.0T), echo time = 2.8-3.7ms (1.5T), and 2.0-2.2ms (3.0T), velocity encoding = 40-400cm/s (adjusted to maximize image quality while minimizing velocity aliasing artifact), scan time = 9-17 minutes using respiratory and retrospective ECG gating. Nominal temporal resolution was 35-44 ms at 1.5T and 25-27 ms at 3.0T. 4D Flow MRI was performed after intravenous (IV) administration of 0.1 mmol/kg gadobenate dimeglumine (Bracco Diagnostics, Princeton, NJ) in all healthy volunteers and seven subjects with rTOF to improve signal-to-noise performance.16 IV contrast was not given to three rTOF subjects (poor renal function n=1, inability to obtain IV access n=2). Although many of the rTOF subjects had previous surgeries, no significant postoperative artifacts were encountered that would have affected local signal to noise or flow measurements.
Subjects and healthy volunteers underwent 2D cine bSSFP imaging oriented along LV short axis to obtain clinical CMR values for functional assessment. MR parameters were as follows: FOV = 36 × 29-36cm, TR 3.2ms, TE 1.1-1.2ms, FA 45 deg, matrix = 256 × 192, bandwidth 90.9kHz, views per segment 12-16, slice thickness 6-8 mm, slice spacing 0 mm.
Post-Processing
Segmentation of the right (RV) and left (LV) ventricle was conducted using Mimics (Materialise, Leuven, Belgium). Time averaged magnitude images derived from the PC VIPR data set were utilized for segmentation.17 Segmentation directly applied to the intrinsic magnitude images allowed for seamless integration of the segmented RV and LV with the accompanying 4D Flow MRI velocity data. Using a time averaged sequence allowed for a single segmentation to be applied to the average of the velocity data throughout the cardiac cycle.
Ensight (CEI, Apex, NC) was used for 4D Flow MRI visualization and reconstruction of two-dimensional planes orthogonal to the direction of flow through ascending aorta and main pulmonary artery, which provided pulmonary artery and aortic flow (QMPA and QAO). Customized Matlab (The MathWorks, Natick, MA) routines were utilized to calculate right and left ventricular kinetic energy (KERV and KELV, respectively).
RV and LV end-diastolic volume index (EDVI), end-systolic volume index (ESVI), and ejection fraction (EF) were determined from cine bSSFP acquisitions. Volumetric post processing was performed on all subjects and healthy volunteers using Report Card software (GE Healthcare, Waukesha, WI, USA) by the same board certified radiologist.
Kinetic Energy Calculation
The KE of a voxel of blood was calculated using the equation , where the mass (m) represents the voxel volume multiplied by the density of blood (1.05g/ml)18 and the velocity (v) of each voxel was determined from 4D Flow MRI. KERV and KELV were determined from the sum of the KE of the voxels within the segmented RV or LV blood pool, respectively, at each phase of the cardiac cycle. In the KE equation and concurrent with previous studies, the directionality component of velocity is removed since velocity is squared.12 Therefore blood flowing in opposite directions within the ventricle would lead to additive KE values.12 Kinetic energy values were calculated in millijoules (mJ) and measured at 20 phases throughout the cardiac cycle.
Data Analysis
Statistical analyses were conducted using SPSS (version 20, Chicago, IL). Differences in peak systolic KERV and KELV in addition to the QMPA/KERV peak systolic and QAO/KELV peak systolic ratios between rTOF and healthy volunteer groups were assessed using Wilcoxon rank-sum. The QMPA/KERV peak systolic and QAO/KELV peak systolic ratios were measured as a marker of ventricular-vascular efficiency, or ventricular KE loss. This is a novel ratio which allows quantitative evaluation of the relationship between ventricular outflow and kinetic energy. KERV and QMPA/KERV were compared to the RV EF, EDVI, and ESVI using the Pearson correlation coefficient. KELV and QAO/KELV were also compared to the LV EF, EDVI, and ESVI using the Pearson correlation coefficient. A p-value < 0.05 was considered statistically significant.
Results
Ten patients with repaired Tetralogy of Fallot (age 20.6 ± 12.2 years, 5 females) and nine healthy volunteers (age 38.9 ± 15.1 years, 3 females) were included in this study. Characteristics of the rTOF group are summarized in Table 1. Seven of the ten rTOF patients had transannular patch correction. The type of repair in the other three patients was not available. All rTOF subjects underwent surgical correction when they were under 2 years of age. None of the patients had significant residual ventricular septal defects and all had some degree of pulmonary insufficiency. Seven rTOF subjects were symptomatic at the time of CMR, including fatigue, palpitations, dyspnea or chest discomfort.
Table 1. Characteristics of rTOF subjects.
| Subject | Age at time of CMR (years) | Gender | Body Surface Area (m2) | Type of repair | Prior shunt | Age of last repair | Symptoms at time of CMR |
|---|---|---|---|---|---|---|---|
| 1 | 7 | F | 0.98 | Transannular patch | N/A | 2 months | None |
| 2 | 9 | M | 0.96 | Transannular patch and pulmonary valvectomy | Blalock-Taussig | 6 months | Dyspnea on exertion |
| 3 | 11 | F | 1.17 | Transannular patch | Blalock-Taussig x2 | 8 months | Palpitations, chest discomfort |
| 4 | 13 | F | 1.51 | Transannular patch | N/A | 6 months | Palpitations |
| 5 | 15 | F | 1.59 | Transannular patch | Blalock-Taussig | 2 years | None |
| 6 | 17 | F | 1.62 | Transannular patch | N/A | 2 years | Fatigue |
| 7 | 19 | M | 1.90 | Transannular patch | N/A | 10 months | None |
| 8 | 34 | M | 2.17 | N/A | Waterston | 16 years | Palpitations |
| 9 | 38 | M | 2.31 | N/A | Waterston | N/A | Palpitations |
| 10 | 43 | M | 1.71 | N/A | Waterston | N/A | Shortness of breath |
N/A – not available
Figure 1 shows the distribution of RVKE during systole and early diastole in a healthy volunteer and rTOF subject. During systole in healthy volunteers, focal red signal in the figure shows the highest kinetic energy at the RV outflow tract. During diastole, the highest KE was seen along the RV inner curvature, between the tricuspid valve and RV outflow tract. This distribution of RVKE was typical for the healthy volunteer group. In rTOF subjects, the highest KE was seen along the RV outflow tract in both diastole and systole due to the presence of pulmonic regurgitation. This distribution of RVKE was typical for the rTOF group.
Figure 1.
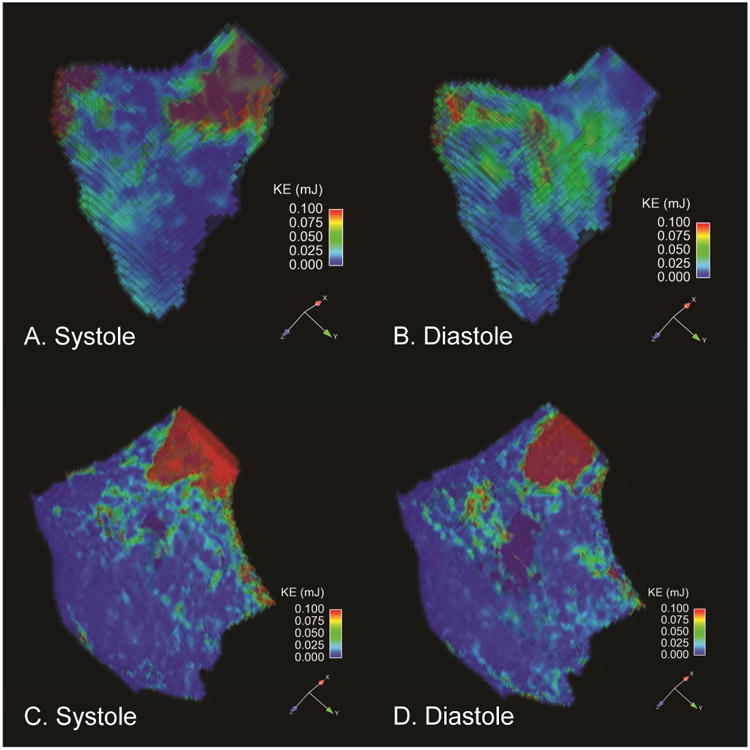
[A-B]. Healthy Volunteer RV Kinetic energy maps in a long axis orientation. The figures demonstrate the KE values of each voxel of blood in the segmented plane where the highest KE values are marked in red. Note that highest kinetic energies are seen along the RV outflow tract during systole and along the RV inner curvature during diastole. [C-D]. rTOF RV Kinetic energy maps oriented along the RV outflow tract. Note that highest kinetic energies are seen along the RV outflow tract during systole and diastole due to the presence of pulmonic regurgitation in this patient.
Table 2 summarizes volumetric CMR measurements, ventricular KE calculations, and flow measurements. The mean peak systolic KERV in rTOF patients, 6.06±2.27mJ, was higher than in healthy volunteers, 5.47±2.52mJ, although this difference was not significant (p = .65) (Figure 2, A). The mean peak systolic KELV in rTOF patients, 3.55±2.12mJ, was also slightly higher than in healthy volunteers, 2.48±0.75mJ (p = .47) (Figure 2, A). When corrected for body surface area, peak systolic KERV and KELV remained higher in rTOF (3.89±1.30mJ/m2 and 3.55±2.12mJ/m2, respectively) than in healthy volunteers (2.97±1.36mJ/m2 and 2.48±0.75mJ/m2, respectively; p= .15 and p= .08 respectively). There was no significant difference between BSA corrected QMPA (p= 0.25) and QAO (p=0.17), between rTOF and healthy volunteers (Table 2). The mildly higher QMPA and QAO in healthy volunteers compared to rTOF is attributable to larger scale increase in flow relative to increase in BSA. The QMPA/KERV and QAO/KELV ratios were lower in rTOF subjects than in healthy volunteers (P < .05, Figure 2B). The differences in BSA corrected QMPA and QAO (1.3× and 1.3× higher in healthy volunteers, respectively) were less compared to the differences in QMPA/KERV and QAO/KELV (2.02 and 2.76 higher in healthy volunteers, respectively). In rTOF subjects with pulmonary or aortic insufficiency, the QMPA/KERV and QAO/KELV ratios were adjusted to include all forward flow, rather than net flow. These adjusted ratios remained significantly lower in rTOF than healthy volunteers (P < .05).
Table 2. Summary of standard volumetric and kinetic energy measurements in healthy volunteers and subjects with repaired tetralogy of Fallot.
| Mean ± SD | Healthy Volunteers | rTOF | P values |
|---|---|---|---|
| RVEDVI (mL/m2) | 74 ± 18 | 116 ± 52 | .03 |
| RVESVI (mL/m2) | 31 ± 9 | 60 ± 27 | .007 |
| RVEF (%) | 58 ± 8 | 48 ± 6 | .005 |
| LVEDVI (mL/m2) | 78 ± 17 | 71 ± 20 | .33 |
| LVESVI (mL/m2) | 30 ± 8 | 31 ± 12 | .93 |
| LVEF (%) | 62 ± 3 | 56 ± 7 | .02 |
| Mean peak systolic KERV (mJ) | 5.5 ± 2.5 | 6.1 ± 2.3 | .65 |
| Mean peak systolic KERV/BSA (mJ/m2) | 3.0 ± 1.4 | 3.9 ± 1.3 | .15 |
| Mean peak systolic KELV (mJ) | 2.5 ± 0.8 | 3.5 ± 2.1 | .47 |
| Mean peak systolic KELV/BSA (mJ/m2) | 1.4 ± 0.4 | 2.2 ± 1.1 | .08 |
| Qmpa/BSA (mL/cycle*m2) | 42.4 ± 9.8 | 32.4 ± 26.7 | .25 (NS) |
| Qao/BSA (mL/cycle*m2) | 45.8 ± 9.8 | 34.3 ± 23.6 | .17 (NS) |
| Qmpa/KERV peak/BSA | 19.3 ± 18.4 | 7.5 ± 5.4 | .015 |
| Qao/KELV peak/BSA | 36.0 ± 7.7 | 9.7 ± 6.6 | .0003 |
|
| |||
| Pearson correlation | R | R | P values |
|
| |||
| Qmpa/KERV vs RVEF | 0.46 | 0.06 | .21 (healthy), .87 (rTOF) |
| Qmpa/KERV vs RVEDVI | -0.14 | 0.68 | .72 (healthy), .03 (rTOF) |
| Qao/KELV vs LVEF | 0.20 | 0.60 | .61 (healthy), .07 (rTOF) |
| Qao/KELV vs LVEDVI | 0.53 | 0.09 | .14 (healthy), .80 (rTOF) |
SD, Standard deviation; rTOF, repaired tetralogy of Fallot; RVEDVI, right ventricular end-diastolic volume index; RVESVI, right ventricular end-systolic volume index; RVEF, right ventricular ejection fraction; LVEDVI, left ventricular end-diastolic volume index; LVESVI, left ventricular end-systolic volume index; LVEF, left ventricular ejection fraction; KERV, right ventricular kinetic energy; BSA, body surface area; KELV, left ventricular kinetic energy; Qmpa, main pulmonary artery flow; NS, nonsignificant; Qao, aortic flow.
Figure 2.
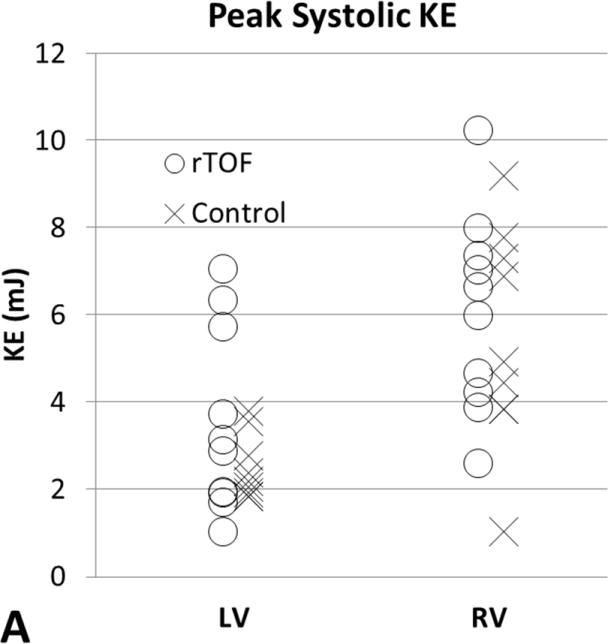
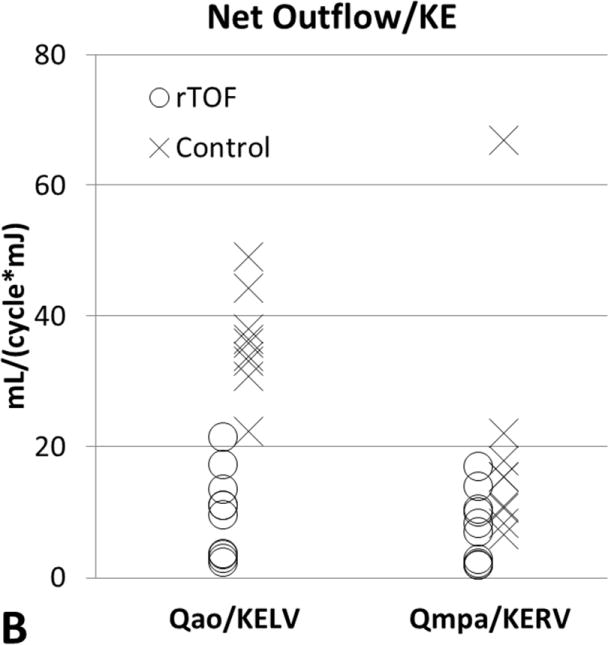
[A] Peak systolic KERV and KELV comparison between subjects with rTOF and healthy volunteers. Differences in KERV (P = .65) and KELV (P = .47) are not statistically significant. [B] Ratios of outflow to peak systolic ventricular KE as markers for ventricular-vascular efficiency. QMPA/KERV was significantly lower in rTOF than in healthy volunteers (P = .015). QAo/KELV was also significantly lower in rTOF than in healthy volunteers (P = .0003). KE, Kinetic energy; rTOF, repaired tetralogy of Fallot; LV, left ventricular; RV, right ventricular; Qmpa, main pulmonary artery flow; KERV, right ventricular kinetic energy; Qao, aortic flow; KELV, left ventricular kinetic energy.
The relationship between QMPA/KERV and QAO/KELV and standard CMR measurements of EDVI, ESVI, and EF are shown in Table 2. Although there was a moderately positive correlation between ventricular-vascular efficiency and RV EDVI and RV ESVI in rTOF subjects (r = 0.67, P = .03), the other comparisons did not reach statistical significance. In Figure 3, rTOF subjects were grouped according to normal and abnormal standard RV volumetric measurements and peak KERV was plotted. No significant KERV differences were seen between these subgroups.
Figure 3.
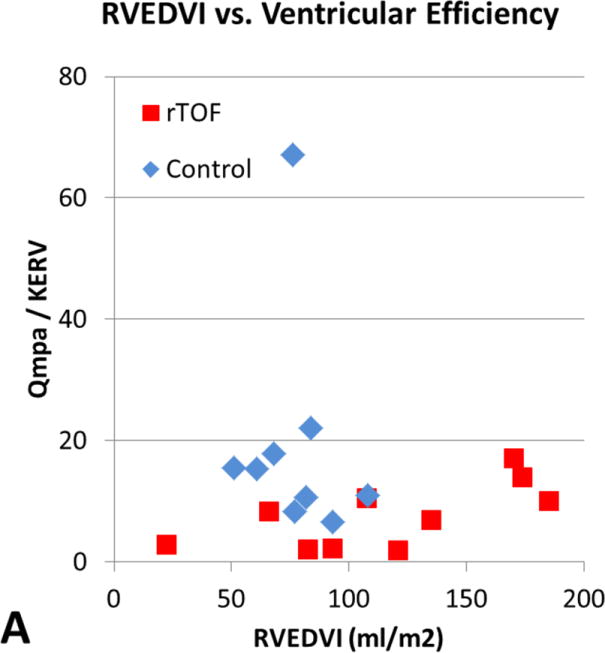
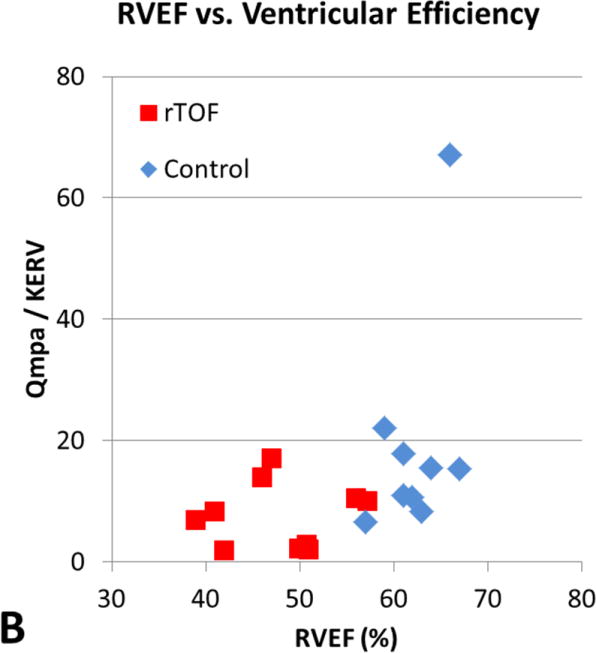
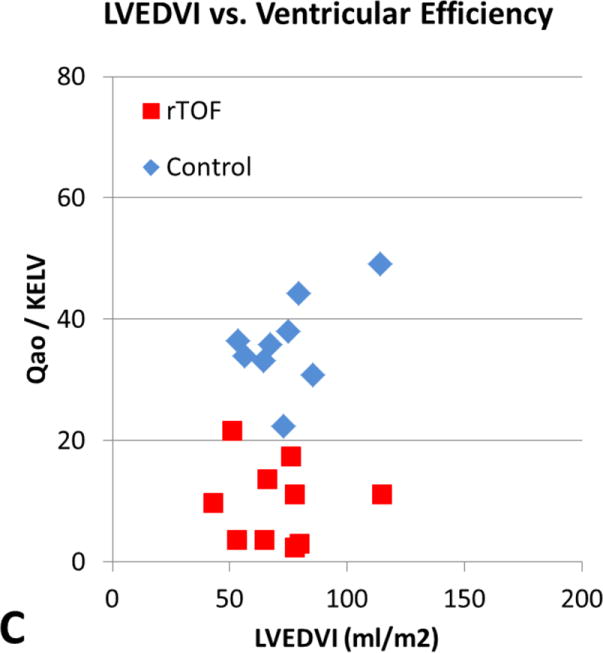
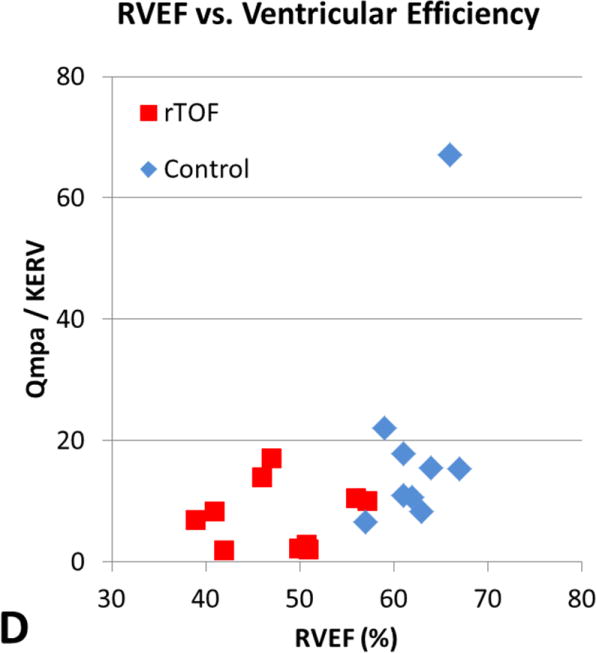
[A] RVEDVI versus ventricular efficiency. [B] RVEF versus ventricular efficiency. [C] LVEDVI versus ventricular efficiency. [D] LVEF versus ventricular efficiency. There is a moderately positive correlation between ventricular efficiency and RVEDVI in subjects with rTOF (r = 0.68, P = .03) demonstrated by the red boxes in A. However, the other comparisons did not reach statistical significance. RVEDVI, Right ventricular end-diastolic volume index; Qmpa, main pulmonary artery flow; KERV, right ventricular kinetic energy; rTOF, repaired tetralogy of Fallot; RVEF, right ventricular ejection fraction; LVEDVI, left ventricular end-diastolic volume index; Qao, aortic flow; KELV, left ventricular kinetic energy; LVEF, left ventricular ejection fraction.
Discussion
In this study, time-resolved kinetic energy in the right and left ventricles of healthy volunteers and subjects with repaired Tetralogy of Fallot was calculated non-invasively using 4D Flow MRI. While KERV and KELV were higher in rTOF compared to healthy volunteers, QMPA and QAO were the same between groups. This reflects the decreased ventricular-vascular efficiency in rTOF for both pulmonary and systemic circulations. These observations may indicate that patients with rTOF have greater energy loss in the right and left ventricles compared to healthy volunteers without a corresponding ability to generate increased pulmonary or systemic flow. This study helps illustrate the complex relationship between kinetic energy and flow between the ventricles and vasculature, within the left and right ventricles, and during systole and diastole in patients with repaired Tetralogy of Fallot compared to healthy volunteers.
Previously, accurate measurements of cardiac pressure and energy required invasive methods such as cardiac catheterization, limiting their utility in standard clinical practice.10,20,21 The development of 4D flow magnetic resonance imaging has provided a noninvasive method of collecting 4D velocity data needed to determine pressure, flow, and energy measurements throughout the cardiac cycle.19 Noninvasive measurements of KE in the LV and RV were first described in prior studies utilizing 4D flow acquisitions and were thought to provide a nondirectional measure of the amount of work invested in overcoming the inertia of intracardiac blood during the cardiac cycle.12,22 Although KE comprises only approximately 1% of the total LV work and 6% of total RV work at rest,10,22 it plays a larger role in the myocardial work under exercise conditions than at rest.10,11 Furthermore, over longer time spans any inefficiencies will contribute to excess work and presumably earlier failure.
To our knowledge, this study was the first to measure time-resolved KERV and KELV in subjects with rTOF using 4D Flow MRI. Initial studies utilizing MRI to calculate KE during early diastole using a single slice estimated total KELV to be four to five times higher than the values measured in that single slice.23 However, these studies considered only the rotating vortex-like portion of flow without the straight streams of blood flow. Diastolic KE was later quantified in the RV by Fredriksson et al.13 with 4D Flow MRI using calculated pathlines forward and backward in time from the isovolumetric contraction. Subsequently, Carlsson et. al12 calculated KERV and KELV throughout the cardiac cycle using a method very similar to that used in our study. The peak systolic KE values calculated in our healthy volunteers were 2.48 ± 0.75 mJ in the LV and 5.47 ± 2.52 mJ in the RV, whereas Carlsson et al. obtained values of 4.9±0.4 mJ in the LV and 7.5±0.8 mJ in the RV.12 The lower KE values calculated using our 4D Flow MRI technique are probably related to the fact that the peak velocities measured using PC VIPR were lower than those measured using Cartesian based 4D Flow MRI methods employed by Carlsson et al. due to temporal blurring and averaging of velocities over the length of the scan.24 Since KE is proportional to the velocity squared, small differences in velocity are magnified when calculating KE values. Future studies using both approaches for 4D Flow MRI will be necessary to confirm this. A benefit of using PC VIPR for 4D Flow MRI is that it provides a larger field of view and higher spatial resolution than Cartesian approaches in the same scan acquisition time.
Previous research has shown the mortality rate in rTOF increases from 0.27% per year to 0.94% per year in the third decade of life, with sudden cardiac death as the major cause of death.25 It may often be too late to intervene by the time conventional measures such as LV ejection fraction have declined, as the patient's risk of sudden cardiac death has already increased.26 Even after repair of TOF, research comparing patients with rTOF to healthy subjects found an increased number of vortical flow patterns in the right ventricle, illustrating altered intracardiac flow patterns.7 RV-PA coupling has been shown to be impaired in patients with rTOF and proposed as a maladaptive response of the pulmonary arterial system to chronic right ventricular hemodynamic derangements.27 Disorganized flows within the ventricle may contribute to kinetic energy but not necessarily to ventricular outflow, representing ventricular-vascular inefficiency. Ericksson et al. reported higher KELV in patients with dilated cardiomyopathy than in healthy volunteers despite similar stroke volumes in both groups.28 Although the ventricular-vascular relationship has been previously expressed as the ratio between arterial elastance and end-systolic elastance,14 we employed the relationship between peak systolic kinetic energy and ventricular outflow to serve as an indirect measure of ventricular-vascular inefficiency with respect to the blood pool. The range of QMPA/KERV and QAO/KELV efficiency ratios was relatively large in our healthy volunteers, and this could be explained by the small peak systolic KE denominator component of 1.83 to 3.80 mJ in the LV and 1.03 to 9.18 mJ in the RV. Although the KE values and flows were similar throughout healthy volunteers, a wider range of normal values would be expected when the ratio is taken. The rTOF ventricular efficiency ratios had a narrower range due to the higher peak systolic KE values.
Overall, there were no strong correlations between (A) KERV, KELV, QMPA/KERV, and QAO/KELV and (B) conventional measurements of ventricular size or function. These results indicate that ventricular KE and the flow/KE ratios are an earlier indicator of abnormal cardiac function than EDVI, ESVI and EF. We hypothesize that these altered hemodynamics precede the gross morphological changes of the myocardium that are quantified with these standard cardiac measurements. Consequently, KE as a reflection of disordered flow and ventricular inefficiency may provide an earlier indicator of ventricular dysfunction.
While altered hemodynamics may precede gross morphological changes in the myocardium, the relationship between KE, hemodynamic derangements, and microscopic myocardial changes warrant further study. Moderate RV or LV systolic dysfunction has been associated with poor clinical status of long-term rTOF survivors, and reduced LVEF in patients with rTOF has been shown to be one of the strongest predictors of mortality.5,27 Further studies have shown correlation between RV and LV systolic dysfunction, suggesting unfavorable ventriculo-ventricular interactions.27,29 Our results demonstrate increased KE and decreased efficiency in both the RV and LV of patients with rTOF. We found higher KE in the LV compared with the RV, which is compatible with previous findings.10,13 Interestingly, Carlsson et al.12 reported higher peak systolic KE in the RV than the LV. However, the exact mechanisms of how altered hemodynamics and energy might contribute to ventricular dysfunction are unclear. LV contraction contributes to RV pressure development, and RV loading affects LV function, but additional factors such as shared myocardial fibers and septal deviation have been implicated in producing unfavorable inter-ventricular interactions that contribute to ventricular dysfunction in rTOF.5,30 This ventricular dyssynchrony reduces net cardiac output and reduces myocardial efficiency.31 Ventricular strain, or local myocardial deformation, evaluated by cardiac magnetic resonance and echocardiography speckle-tracking may be an earlier predictor of regional ventricular dysfunction compared to ejection fraction in patients with rTOF.3,5,26 Whether microscopic myocardial changes or changes in KE and altered hemodynamics provide better indicators for declining ventricular function warrant further investigation.
In addition to examining biventricular KE, we also explored the time-resolved KE changes throughout the cardiac cycle. As in previous studies,12 we observed one systolic and two diastolic KE peaks. Carlsson et al. showed that the KERV was highest along the RV outflow tract during systole and KERV was highest from the tip of the tricuspid valve to the center of the ventricle during diastole.12 Our findings showed a similar distribution of kinetic energy in healthy volunteers throughout the cardiac cycle. In subjects with rTOF, higher diastolic KERV was seen along the RV outflow tract due to the presence of locally increased retrograde flow from pulmonic regurgitation.
Limitations
Although the magnitude images from 4D Flow MRI have lower contrast between blood-pool and myocardium than steady-state free precession images, Roldan-Alzate et al. reported that ventricular volumes measured using this method are accurate.17 Using a time average of the magnitude images allowed for a single ventricular segmentation to be performed on images intrinsic to the 4D Flow MRI data. An alternative would have been to segment the ventricles on all phases using time resolved magnitude images. However, this method would be much more time consuming. Using time averaged images in the segmentation would be more limited in the setting of hyperdynamic ventricular motion but would be less limited in the setting of decreased ventricular wall motion.
Some of the rTOF subjects were scanned at 1.5T and others at 3T, while all healthy volunteers were scanned at 3T with minor differences in parameters between 1.5 and 3T. This introduces a possible source of variability in the data. In addition, 3 rTOF subjects did not receive IV contrast due to IV access difficulty and poor renal function. While previous studies have shown that phase contrast imaging post IV contrast administration improves signal to noise,16 adequate phase contrast imaging was obtainable both pre and post contrast.
Other limitations of this study include the small size of the two cohorts and heterogeneity of the rTOF subjects. The study could have been strengthened with age and BSA matched healthy volunteers which may have reduced differences in flow data. Further studies in rTOF subjects with similar repairs and with imaging performed earlier after repair will be necessary to determine the longitudinal significance of quantifying these hemodynamic abnormalities on long-term outcomes. Although we calculated the intraventricular KE, we did not account for the earliest stages of generating ventricular energy at the myocardial level which other studies have evaluated.31,32 Also, the ventricular efficiency ratio proposed in this study used the peak systolic ventricular kinetic energy and aortic or main pulmonary artery outflow. This was introduced as one marker for ventricular efficiency with respect to kinetic energy of the ventricular blood pool. An alternative consideration of ventricular efficiency could include the myocardial work that relates to generating ventricular outflow, which was not directly evaluated in this study. Correlation with pressure volume loops available through catheterization would offer further insight into the degree of myocardial work that is transferred into kinetic energy. Finally, these metrics were all obtained at rest in the supine position. Patients with rTOF often have decreased exercise tolerance, which is may be a reflection of inefficient ventricular contractions. During exercise, the flow rates and flow patterns that were observed in this study would likely change with kinetic energy playing a larger role.
Conclusion
Quantification of increased ventricular KE in patients with rTOF is a new observation. Our study illustrates the complex relationship between ventricular KE and flow through the great vessels. KERV and KELV were higher and QMPA/KERV and QAO/KELV ratios were lower in patients with rTOF than in healthy volunteers. This is indicative of significantly greater energy losses in the RV and LV in rTOF patients without a corresponding ability to generate increased pulmonary or systemic flow. Additionally, KE constitutes a greater portion of the total work in the right heart than the left heart at baseline and during activity. Future studies may determine a closer relationship of KERV and KELV with exercise performance and capacity than standard CMR measurements. While KE measurements derived from 4D flow MRI provide a novel noninvasive method of monitoring cardiac function, future investigations will be needed to determine if changes in ventricular KE can provide earlier evidence of ventricular dysfunction and guide future medical and surgical interventions.
Acknowledgments
NIH grant R01HL07226.
Department of Radiology Research and Development Fund.
Footnotes
Author's contributions: DJ organized and implemented the original study and assisted with study design, data acquisition, analysis, and manuscript preparation.
PVA assisted with analysis and manuscript preparation.
AR assisted with study design, data acquisition, analysis, and manuscript preparation
SS assisted with analysis and manuscript preparation.
MLS assisted with analysis and manuscript preparation.
OW assisted with study design, analysis, and manuscript preparation.
CJF conceived the original study and assisted with study design, data acquisition, analysis, and manuscript preparation.
All authors read and approved the final manuscript.
Disclosures: The University of Wisconsin receives research support from GE Healthcare.
Publisher's Disclaimer: This is a PDF file of an unedited manuscript that has been accepted for publication. As a service to our customers we are providing this early version of the manuscript. The manuscript will undergo copyediting, typesetting, and review of the resulting proof before it is published in its final citable form. Please note that during the production process errors may be discovered which could affect the content, and all legal disclaimers that apply to the journal pertain.
References
- 1.Starr JP. Tetralogy of Fallot: yesterday and today. World J Surg. 2010;34(4):658–668. doi: 10.1007/s00268-009-0296-8. [DOI] [PubMed] [Google Scholar]
- 2.Lloyd-Jones D, Adams RJ, Brown TM, Carnethon M, Dai S, De Simone G, et al. Heart disease and stroke statistics--2010 update: a report from the American Heart Association. Circulation. 2010;121:e46–e215. doi: 10.1161/CIRCULATIONAHA.109.192667. [DOI] [PubMed] [Google Scholar]
- 3.Zhong L, Gobeawan L, Su Y, Tan J, Ghista D, Chua T, et al. Right ventricular regional wall curvedness and area strain in patients with repaired tetralogy of Fallot. Am J Physiol Heart Circ Physiol. 2012;302:H1306–H1316. doi: 10.1152/ajpheart.00679.2011. [DOI] [PMC free article] [PubMed] [Google Scholar]
- 4.Adamson L, Vohra HA, Haw MP. Does pulmonary valve replacement post repair of tetralogy of Fallot improve right ventricular function? Interact Cardiovasc Thorac Surg. 2009;9:520–527. doi: 10.1510/icvts.2009.211011. [DOI] [PubMed] [Google Scholar]
- 5.Khalaf A, Tani D, Tadros S, Madan S. Right- and left- ventricular strain evaluation in repaired pediatric Tetralogy of Fallot patients using magnetic resonance tagging. Pediatr Cardiol. 2013;34:1206–1211. doi: 10.1007/s00246-013-0631-6. [DOI] [PubMed] [Google Scholar]
- 6.Therrien J, Provost Y, Merchant N, Williams W, Colman J, Webb G. Optimal timing for pulmonary valve replacement in adults after tetralogy of Fallot repair. Am J Cardiol. 2005;95(6):779–782. doi: 10.1016/j.amjcard.2004.11.037. [DOI] [PubMed] [Google Scholar]
- 7.Francois CJ, Srinivasan S, Schiebler ML, Reeder SB, Niespodzany E, Landgraf BR, et al. 4D cardiovascular magnetic resonance velocity mapping of alterations of right heart flow patterns and main pulmonary artery hemodynamics in Tetralogy of Fallot. J Cardiovasc Magn Reson. 2012;14:16. doi: 10.1186/1532-429X-14-16. [DOI] [PMC free article] [PubMed] [Google Scholar]
- 8.Geiger J, Markl M, Jung B, Grohmann J, Stiller B, Langer M, et al. 4D-MR flow analysis in patients after repair for tetralogy of Fallot. Eur Radiol. 2011;21:1651–1657. doi: 10.1007/s00330-011-2108-4. [DOI] [PubMed] [Google Scholar]
- 9.Harrild DM, Berul CI, Cecchin F, Geva T, Gauvreau K, Pigula F, Walsh EP. Pulmonary Valve Replacement in Tetralogy of Fallot: Impact on Survival and Ventricular Tachycardia. Circulation. 2009;119:445–451. doi: 10.1161/CIRCULATIONAHA.108.775221. [DOI] [PMC free article] [PubMed] [Google Scholar]
- 10.Prec O, Katz N, Sennett L, Rosenman RH, Fishman AP, Hwang W. Determination of kinetic energy of the heart in man. Am J Physiol. 1949;159(3):483–491. doi: 10.1152/ajplegacy.1949.159.3.483. [DOI] [PubMed] [Google Scholar]
- 11.Rao PS, Awa S, Linde LM. Role of kinetic energy in pulmonary valvar pressure gradients. Circulation. 1973;48:65–73. doi: 10.1161/01.cir.48.1.65. [DOI] [PubMed] [Google Scholar]
- 12.Carlsson M, Heiberg E, Toger J, Arheden H. Quantification of left and right ventricular kinetic energy using four-dimensional intracardiac magnetic resonance imaging flow measurements. Am J Physiol Heart Circ Physiol. 2012;302:H893–H900. doi: 10.1152/ajpheart.00942.2011. [DOI] [PubMed] [Google Scholar]
- 13.Fredricksson AG, Zajac J, Eriksson J, Dyverfeldt P, Bolger AF, Ebbers T, et al. 4D blood flow in the human right ventricle. Am J Physiol Heart Circ Physiol. 2011;301:H2344–H2350. doi: 10.1152/ajpheart.00622.2011. [DOI] [PubMed] [Google Scholar]
- 14.Antonini-Canterin F, Poli S, Vriz O, Pavan D, Bello VD, Nicolosi GL. The ventricular-arterial coupling: from basic pathophysiology to clinical application in the echocardiography laboratory. J Cardiov Echography. 2013;23(4):91–95. doi: 10.4103/2211-4122.127408. [DOI] [PMC free article] [PubMed] [Google Scholar]
- 15.Gu T, Korosec FR, Block WF, Fain SB, Turk Q, Lum D, et al. PC VIPR: a high-speed 3D phase-contrast method for flow quantification and high-resolution angiography. Am J Neuroradiol. 2005;26:743–749. [PMC free article] [PubMed] [Google Scholar]
- 16.Bock J, Frydrychowicz A, Stalder AF, Bley TA, Burkhardt H, Hennig J, et al. 4D phase contrast MRI at 3 T: effect of standard and blood-pool contrast agents on SNR, PC-MRA, and blood flow visualization. Magn Reson Med. 2010;63:330–338. doi: 10.1002/mrm.22199. [DOI] [PubMed] [Google Scholar]
- 17.Roldan-Alzate A, Jensen L, Frydrychowicz A, Nagle SK, Kellihan H, Chesler N, et al. Free breathing measurement of ventricular volumes from magnitude data of 4D flow-sensitive MRI in a canine model of acute pulmonary arterial hypertension [abstract]. Proceedings of the 20th Annual Meeting of the International Society for Magnetic Resonance in Medicine; 5-11 May 2012; Melbourne. [Google Scholar]
- 18.Hinghofer-Szalkay H, Greenleaf JE. Continuous monitoring of blood volume changes in humans. J Appl Physiol. 1987;63(3):1003–1007. doi: 10.1152/jappl.1987.63.3.1003. [DOI] [PubMed] [Google Scholar]
- 19.Lee N, Taylor MD, Hor KN, Banerjee RK. Non-invasive evaluation of energy loss in the pulmonary arteries using 4D phase contrast MR measurement: a proof of concept. BioMedical Engineering Online. 2013;12:93. doi: 10.1186/1475-925X-12-93. [DOI] [PMC free article] [PubMed] [Google Scholar]
- 20.Milnor WR, Bergel D, Bargainer JD. Hydraulic power associated with pulmonary blood flow and its relation to heart rate. Circ Res. 1966;19:467–480. doi: 10.1161/01.res.19.3.467. [DOI] [PubMed] [Google Scholar]
- 21.O'Rourke MF. Impact pressure, lateral pressure, and impedance in the proximal aorta and pulmonary artery. J Appl Physiol. 1968;25:533–541. doi: 10.1152/jappl.1968.25.5.533. [DOI] [PubMed] [Google Scholar]
- 22.Arvidsson PM, Toger J, Heiberg E, Carlsson M, Arheden H. Quantification of left and right atrial kinetic energy using four-dimensional intracardiac magnetic resonance imaging flow measurements. J Appl Physiol. 2013;114:1472–1481. doi: 10.1152/japplphysiol.00932.2012. [DOI] [PubMed] [Google Scholar]
- 23.Kim WY, Walker PG, Pedersen EM, Poulsen JK, Oyre S, Houlind K, et al. Left ventricular blood flow patterns in normal subjects: a quantitative analysis by three-dimensional magnetic resonance velocity mapping. J Am Coll Cardiol. 1995;26:224–238. doi: 10.1016/0735-1097(95)00141-l. [DOI] [PubMed] [Google Scholar]
- 24.Wentland AL, Grist TM, Wieben O. Repeatability and internal consistency of abdominal 2D and 4D phase contrast MR flow measurements. Acad Radiol. 2013;20:699–704. doi: 10.1016/j.acra.2012.12.019. [DOI] [PMC free article] [PubMed] [Google Scholar]
- 25.Nollert G, Fischlein T, Bouterwek S, Bohmer C, Klinner W, Reichart B. Long-term survival in patients with repair of Tetralogy of Fallot: 36-year follow-up of 490 survivors of the first year after surgical repair. J Am Coll Cardiol. 2002;30:1374–1383. doi: 10.1016/s0735-1097(97)00318-5. [DOI] [PubMed] [Google Scholar]
- 26.Ordovas KG, Carlsson M, Lease KE, Foster E, Meadows AK, Martin AJ, et al. Impaired regional left ventricular strain after repair of Tetralogy of Fallot. J Magn Reson Im. 2012;35:79–85. doi: 10.1002/jmri.22686. [DOI] [PubMed] [Google Scholar]
- 27.Geva T, Sandweiss BM, Gauvreau K, Lock JE, Powell AJ. Factors associated with impaired clinical status in long-term survivors of Tetralogy of Fallot repair evaluated by magnetic resonance imaging. J Am Coll Cardiol. 2004;43:1068–1074. doi: 10.1016/j.jacc.2003.10.045. [DOI] [PubMed] [Google Scholar]
- 28.Ericksson J, Bolger AF, Ebbers T, Carlhall CJ. Four-dimensional blood flow-specific markers of LV dysfunction in dilated cardiomyopathy. Eur Heart J – Cardiov Imag. 2013;14:417–424. doi: 10.1093/ehjci/jes159. [DOI] [PMC free article] [PubMed] [Google Scholar]
- 29.Kempny A, Diller G, Orwat S, Kaleschke G, Kerckhoff G, Bunck AC, et al. Right ventricular-left ventricular interaction in adults with Tetralogy of Fallot: a combined cardiac magnetic resonance and echocardiographic speckle tracking study. International J Card. 2012;154:259–264. doi: 10.1016/j.ijcard.2010.09.031. [DOI] [PubMed] [Google Scholar]
- 30.Friedberg MK, Redington AN. Right versus left ventricular failure: differences, similarities, and interactions. Circulation. 2014;129:1033–1044. doi: 10.1161/CIRCULATIONAHA.113.001375. [DOI] [PubMed] [Google Scholar]
- 31.Cheng A, Helm R, Abraham TP. Pathophysiological mechanisms underlying ventricular dyssynchrony. Europace. 2009;11(suppl 5):v10–v14. doi: 10.1093/europace/eup272. [DOI] [PubMed] [Google Scholar]
- 32.Granzier HL, Labeit S. The giant protein titin: a major player in myocardial mechanics, signaling, and disease. Circ Res. 2004;94:284–295. doi: 10.1161/01.RES.0000117769.88862.F8. [DOI] [PubMed] [Google Scholar]


