

Abstract
Cells in tissues encounter a range of physical cues as they migrate. Probing single cell and collective migratory responses to physically defined three-dimensional (3D) microenvironments and the factors that modulate those responses are critical to understanding how tissue migration is regulated during development, regeneration, and cancer. One key physical factor that regulates cell migration is topography. Most studies on surface topography and cell mechanics have been carried out with single migratory cells, yet little is known about the spreading and motility response of 3D complex multicellular tissues to topographical cues. Here, we examine the response to complex topographical cues of microsurgically isolated tissue explants composed of epithelial and mesenchymal cell layers from naturally 3D organized embryos of the aquatic frog Xenopus laevis. We control topography using fabricated micropost arrays (MPAs) and investigate the collective 3D migration of these multicellular systems in these MPAs. We find that the topography regulates both collective and individual cell migration and that dense MPAs reduce but do not eliminate tissue spreading. By modulating cell size through the cell cycle inhibitor Mitomycin C or the spacing of the MPAs we uncover how 3D topographical cues disrupt collective cell migration. We find surface topography can direct both single cell motility and tissue spreading, altering tissue-scale processes that enable efficient conversion of single cell motility into collective movement.
Keywords: morphogenesis, microstructure, soft tissue biomechanics, cell mechanics, topology
Introduction
Several methods have been developed to study the effect of topographical cues on single cell motility and collective migration on surface micropatterned substrates including highly convex silica surface, thin elastic films, poly-acrylamide gels, and microcontact printing of self-assembled monolayers to control the cell migration[1–4]. Single cell motility has been more extensively studied with 3D topographical structures such as microwells, micro-grooves and ridges, and micropillars[5–8]; however, little is known about collective cell migration within topographically controlled surfaces and especially in multi-cellular integrated systems during development. Microfabrication techniques can be used to create complex topography and evaluate the effect of surface topography on cellular behavior and collective migration. Microfabricated micropost arrays (MPAs) provide a tool for studying biological responses to complex surfaces [9–12]. Advantages of MPAs include widely available fabrication processes, enhanced user control over surface topography and improved device repeatability. While both cultured single cells and confluent multicellular tissues have been cultured on MPAs, little is known about the effects of the arrays on embryonic tissues or how MPAs might regulate morphogenesis. MPAs have been used to precisely control cell substrate interactions, allowing local control of substrate stiffness and global modulation of tissue microenvironment[13–15]. Microfabrication techniques have allowed the production of various precision engineered surfaces for quantitative analysis of cell motility including cantilevers[16–18], thin silicon[12, 19, 20], and pre-stressed thin polymer films[21] or thick polymer gels[11]. Like other microfabricated structures, MPAs can be constructed with precise diameter, height, and micropost spacing. Micro- and nano-structures made from poly(dimethylsiloxane) (PDMS) have been widely used as surfaces in studies of single cell motility[13, 14, 22]. MPAs fabricated from PDMS have been used to visualize cell and tissue generated traction forces where cells are only allowed to adhere to the tip of the posts[14].
Cell motility and collective migration are studied almost exclusively in epithelial monolayers cultured on flat homogeneous surfaces yet tissues within embryos and adults are complex composites composed of epithelial and mesenchymal cells that must coordinate their migration within a microenvironment consisting of topographically heterogeneous surfaces[17, 23–25]. Collective cell migration plays an important role in numerous physiological and pathological conditions, such as morphogenesis, wound healing, and tumor metastasis[26–29]. Single cell migration involves an integrated set of mechanical processes including cell extension, retraction to a leading edge and adhesion to a substrate through specific receptors[20, 21, 30–32]; these processes transmit contractile forces generated within cells to the surrounding matrix at the cell's leading and trailing edges[33, 34]. Recent studies have shown that topographical and physical properties of the surrounding extracellular matrix have a significant influence on both collective and single cell migration, as well as on the regulation, formation, and organization of tissues[9, 35–37]. By contrast, little is known about the mechanisms that control collective migration of more complex composite tissues composed of multiple cell types such as epithelial and mesenchymal cells. Many of the large scale tissue movements that establish the body plan and organs of embryos involve collective migration of composite tissues (e.g.[38]).
Xenopus laevis animal cap tissues are a primary, composite tissue which undergo collective migration both in the embryo and when explanted and cultured on ECM-coated substrates. These tissues initially contain two to three layers of mesenchymal cells covered by a single cell layered epithelium. Collective migration is mainly driven by radial intercalation of mesenchymal cells and programmed height changes in mesenchymal and epithelial cells. Radial intercalation of mesenchymal cells perpendicular to the plane of the epithelium thins out the multi-layer mesenchymal cells into one layer over time and results in outward spreading. The use of embryonic tissues offers several advantages to study collective migration in that embryonic tissues naturally integrate 3D arrays of cells to carry out programs of morphogenesis in a rapid and stereotypical fashion. The functional behaviors of isolated embryonic tissues contrast to behaviors exhibited by co-cultures of immortalized cells which are unlikely to interact natively and are commonly studied within immutable synthetic 3D matrices. Study of collective migration of composite embryonic tissues remains relevant to understanding later processes in adult organisms such as healing and cancer progression. For instance, invasive movements of tumor cells are coordinated in composite tissues composed of both epithelial and mesenchymal cells[39] and similar processes during wound healing involve complex tissues composed of both epithelial and mesenchymal cells[40].
In this paper we specifically investigate how multicellular tissue explants respond as they spread within MPAs. We use conventional soft photolithography techniques to fabricate MPAs with microscale features and coat all surfaces with the extracellular matrix protein fibronectin to promote cell attachment (Fig. 1a–c). We find that the surface topography affects both tissue spreading and cell motility (Fig. 1d–c). Furthermore, surface topography provides guidance cues to single cells and enhances the efficiency of collective cell migration. Interestingly, as the density of MPAs increased single cell migratory rates were unaltered; however, the persistence of cells at the periphery of a tissue was affected by surface topography. Modulation of both MPA density and cell size through using Mytomycin C demonstrates that complex topography can disrupt collective cell behaviors that enhance tissue spreading rates.
Figure 1. Observation of collective integrated 3D multicellular migration on fabricated surface topographies.

(A) Schematic of microsurgically excised animal cap explant from Xenopus laevis embryo at early gastrula stage 10 +. (B) Isolated multicellular Xenopus laevis animal cap (AC) tissue. (C) AC plated down on micropost arrays (MPAs). Upper panel shows a zoomed in portion of the single-layer epithelium and one layer of mesenchymal cells. Middle and bottom panels show the animal cap initially after plating and after mesenchymal cell layers infiltrate the MPAs, respectively. (D) Representative max z-projected confocal image of an AC on MPAs with fluorescent nuclei (H2B-GFP) (upper panel) and representative bright-field image of an AC on MPAs (bottom panel) during spreading. Lower panel shows angle bins at which spreading rate was calculated for tissue spreading analysis. (E) Upper panel shows a confocal image reconstruction of individual nuclei within MPAs after spreading for 20 min., and 4 hours. Bottom panel shows bright-field still images of ACs spreading (0 hr and 10 hr post plating) on flat PDMS and MPAs with a diameter of 10 µm and a 1:2 center-to-center ratio.
Materials and methods
Fabrication of PDMS Micropost Arrays
Micropatterned substrates were fabricated using standard soft lithography and replica-molding processes. Chrome photomasks (Fineline Imaging) were designed to create microposts with heights of 40 µm and varying radii. A double-layer of SU-8 was used to help sustain the mold for a longer time. The bottom layer was spin-coated with hexamethyldisilazane (HMDS) twice at 600 rpm for 6 seconds and then 4000 rpm for 30 seconds followed by being dehydration-baked at 150 °C for 20 minutes to eliminate any moisture on the wafer. HMDS was used to reduce the interfacial stress between the SU-8 and the silicon wafer to enhance SU-8 adhesion. To fabricate the positive master, the negative photoresist SU-8 (5) (Microchem, Newton, MA), was spin-coated onto the clean Silicon wafers at 600 rpm for 10 seconds, and then 3000 rpm for 30 seconds, resulting in a thickness of approximately 10 µm. Afterward, wafers were soft baked on a hotplate at 105 °C for 18 minutes, and then cooled at room temperature (25 °C). The second layer was spin-coated with SU-8 (50) to achieve a thickness of approximately 40 µm and soft baked. The micropost arrays (MPAs) were created using projection photolithography (Karl Suss MAS6 Contact Aligner) through exposure of ultraviolet (UV) light for 23 seconds for a total energy of 184 mJ/cm2. Afterward, the post exposure bake was performed at 105 °C for 7 minutes, and the wafers were cooled at room temperature (25 °C). The wafers were developed in a large beaker of MF-26A developer for 5 minutes, and then rinsed thoroughly with fresh solution of MF-26A followed by being then rinsed with deionized (DI) water and gently dried with nitrogen. A hard bake was performed on a hotplate at 80 °C for 5 minutes to prevent any peeling off of silicon from the master.
To make a negative template containing an array of holes, a prepolymer of poly(dimethysiloxane) (PDMS) (Sylgard 184, Dow-Corning), was poured over an array of SU-8 (Microchem, Newton, MA) posts made on silicon wafers by standard photolithography at a 10:1 (base:curing agent) ratio and cured at room temperature (25 °C) in a vacuum chamber overnight. The fabricated micropost arrays were peeled off from the SU-8 master, oxidized in oxygen plasma for 1 minute (200 millitorr (27 Pa); Plasma Prep II, SPI Supplies, West Chester, PA), and silanized with (tridecafluoro-1,1,2,2-tetrahydrooctyl)-1-trichlorosilane (United Chemical Technologies, Bristol, PA) vapor overnight under vacuum to aid in the subsequent release of PDMS from the template. To make micropost arrays, PDMS prepolymer was poured over the template, degassed under vacuum, covered with cover slip glass, cured at 65°C for 3 hours, and peeled off the template. Upon peeling from the mold, the PDMS MPAs were formed. However, many posts collapsed during the peeling from the mold due to high surface tension. We used an ultra sonification bath in ethanol to restore the collapsed posts to their upright orientation and dried them using supercritical point CO2 to prevent the pattern collapsing again because of capillary forces.
Supercritical CO2 has low surface tension and high diffusivity. Supercritical drying has been used in photolithography and MEMS to prevent pattern collapse caused by capillary forces during drying. We used this technique to restore the collapsed high-aspect-ratio micro- and nanoposts. The collapsed posts arrays were first soaked in an ethanol solution, followed by ultra-sonification for 20 minutes to enable the separation between the posts that were next to each other and had come into contact with each other. The wet sample was then transferred into the supercritical drier chamber (Leica EM CPD030) and filled with liquid CO2. The ethanol was purged from the chamber under a continuous flush of liquid CO2. After several purge-flash cycles to completely remove the ethanol, the chamber was heated above the critical point of CO2 (31.1 °C, 1200 psi) and maintained for 5 minutes before slowly venting to atmospheric pressure.
The dried MPAs were examined using a microscope SEM to measure their dimensions and spacing. The MPAs were designed with four different diameter (10 µm, 20 µm, and 40 µm), with a 1-to-2 (center-to-center) ratio between the interpost spacing maintained for each diameter. To improve the cellular attachment to the PDMS microposts, the surfaces were oxidized in air plasma to render the surface hydrophilic and then immersed in a solution with fibronectin (Roche Molecular Biochemicals, Indianapolis, IN) at a concentration of 25 µg ml−1 overnight and incubated at 4 °C to allow for protein adsorption.
Embryo Culture and Explant Tissue Preparation
Eggs were obtained from female Xenopus laevis frogs and fertilizedin vitro. Fertilized eggs were dejellied, and cultured in 1/3X Modified Barth's Solution (MBS) containing 88 mM NaCl, 1 mM KCl, 2.5 mM NaHCO3, 0.3 mM CaNO3, 0.41 mM CaCl2, 0.82 mM MgSO4, 15 mM HEPES (pH 7.6), to early gastrula stages[41] following standard methods[42]. At early gastrula stage 10–10.5, embryos were selected and transferred to culture media, Danilchik's For Amy (DFA), containing 53 mM NaCl, 5 mM Na2CO3, 4.5 mM K Gluconate, 32 mM Na Gluconate, 1 mM MgSO4, 1 mM CaCl2, and 1 g of bovine serum albumin (BSA) per 1 liter, and then buffered to pH 3 with 1 M bicine, for microsurgery.
Gastrula stage embryos were transferred to DFA for microsurgery and vitelline membranes were removed manually with forceps. Incisions using eyebrow knives and hair loops served to remove the animal cap ectoderm from the embryo. Explants were rinsed in fresh DFA, transferred to chambers holding the PDMS surface, and positioned on the surface using a hair loop. The chamber was sealed with a glass coverslip held by silicone grease for subsequent microscopy and image analysis.
For microinjection of mRNA encoding fluorescent proteins or lineage tracers, fertilized embryos were placed in 1X MBS containing 3% Ficoll. mRNA encoding H2B-GFP (~0.7 ng) was injected at four equally spaced sites the animal hemisphere of one- to two-cell stage embryos using a pressure-valve controlled injector (PLI-100, Harvard Apparatus). Embryos were returned to 1/3X MBS after microinjection. Cell size in Xenopus embryonic tissues was modulated with Mitomycin C (MMC; Sigma-Aldrich, M4287-2MG) to block cell division and DNA synthesis. Mitomycin C stock solutions were diluted in dimethyl sulfoxide at 1.5 mM, stored at 4 °C, and used for 2 to 3 weeks. Tissues were allowed to spread for 1 to 2 hours at which time 15 µM MMC was added. Differences in tissue spreading between MMC-treated and controls were analyzed for significance with 2-way ANOVA.
Microscopy and imaging processing
We acquired time-lapsed images tissues spreading over micropost arrays surfaces on an inverted compound microscope (Zeiss Axiovert S100) XY-stage at the focus of a stereoscope mounted with a CCD camera (Scion Imaging Corp). Multiple positions were recorded from the same chamber using an XY motorized stage (Marzhauser and Ludl) controlled by a computer image acquisition system (ImageJ and Micromanager [43]). Time-lapse sequences were collected for up to 20 hours. The position of the leading edge was segmented using edge detection (MatLab, The Mathworks, Cambridge, MA). Segmentation of subsequent images allowed us to automatically track tissue areas and nuclei over time to track tissue spreading and cell nuclei movement.
Laser scanning microscopy was used to acquire high-resolution confocal image stacks of tissues expressing fluorescently labeled nuclei. Confocal time-lapse sequences were collected using a confocal laser scan head (SP5 Leica Microsystems) mounted on an inverted compound microscope (DMI6000, Leica Microsystems) using acquisition software (LASAF, Leica Microsystems). Samples were illuminated using a 488nm Argon laser. For time-lapse sequences of animal cap spreading, images were acquired with a 0.7 NA 20× objective every 3–4 minutes with an acquisition rate of 400Hz, resolution of 512 × 512 pixels and a pinhole setting of 1.2 A.U. For fixed samples, high-resolution images were acquired with a 0.95 NA 25X water-immersion plan apochromat objective.
Nuclei detection and tracking were carried out using the MOSAIC Particle 2D/3D plugin in ImageJ (available at http://rsb.info.nih.gov/ij; developed by Wayne Rasband, National Institutes of Health, Bethesda, MD). Ideal parameters for nuclei detection were manually set for each experiment (typically 6 pixels, 1.0 and 4% for radius, cutoff, and percentile, respectively). The link range for particle linking was set to 2 frames and the link displacement was set to 10 pixels. Nuclei trajectories were analyzed by custom scripts to calculate velocity, persistence, and directedness (MATLAB). Nuclei trajectories were considered for analysis only if they appeared in a minimum of 10 frames.
Results
Interfacing MPAs with complex multilayered embryonic tissues
Since the microenvironments found by cells and tissues in vivo are more heterogeneous than glass or plastic, we used MPAs to understand how complex composite tissues spread in response to changes in topography. We prepared MPAs with a fixed height of 40 µm with controlled differential spacing; posts of 10 µm, 20 µm, and 40 µm were fabricated with center-to-center spacings of twice their diameter (Fig. 1c and Supplementary Fig. 1). The complete surface of the MPAs was coated with fibronectin. To determine if cells were attached and were able to migrate, we collected confocal time-lapses of live tissues expressing a fluorescent nuclear marker (mRFP conjugated histone 2B; H2B-mRFP)[44]. Immediately after tissue placement on 40 µm spaced MPAs, mesenchymal cells were able to attach to the top of the post array then moved to the base of the posts within a few minutes (Fig. 1e, Supplementary Fig. 6). Mesenchymal cells in the tissue explant fully spread to contact the surface of these MPA within 20 minutes and maintained contact with the entire post array for 4 or more hours (Fig. 1e).
Collective migration rates are regulated by surface topography
To understand how the surface of PDMS alone might regulate spreading we compared explant spreading rates on cover glass, petri dish, and bulk PDMS (Fig. 2a and Supplementary Video 1). Mesenchymal and epithelial cells maintain the architecture of spreading tissue explants; mesenchymal cells contact the PDMS and a layer of epithelial cells covers the mesenchymal cells as they would in the embryo. Since our MPAs were fabricated with PDMS, we wanted to compare the effectiveness of flat PDMS to other conventional surfaces such as glass or plastic petri dishes. The tissues spread at varying rates indicating that the surface composition (Fig. 2b) and topography are important (Fig. 2a Supplementary Fig. 2). From time-lapse sequences collected with brightfield microscopy of spreading tissues we calculated the maximum radial displacement and average spreading velocity. We found that tissues on high density arrays spread slower and covered less area than low density arrays or flat surfaces (Fig. 2a, b and Supplementary Video 1). Notably, when tissues spread into 10 and 20 µm spaced MPAs, the start of spreading was delayed up to 5 hours. This delay may be due to the spreading of cells over the surface of the posts since the projected surface area density of the substrate was considerably higher in the arrays. However, while the start of spreading was delayed in the densest MPAs, explants were still able to spread (Fig. 2a and Supplementary Fig. 3). Since the effect of material on spreading over flat surfaces was generally small, we focused our analysis to explants spreading on PDMS, either as a flat surface or patterned with MPAs.
Figure 2. Tissue spreading rate on 3D fabricated surface topographies.

(A) The averaged radial displacement (distance of the edge moving away from the original center of the AC) of Xenopus tissue spreading on 3D surfaces over time. The radial displacement is calculated through image processing in MATLAB described (additional details are found in the Supplemental Methods). The solid lines and shaded areas indicate the mean and standard deviation across surfaces (n =5 for each condition). (B) Maximum rate of spreading and migration for Xenopus tissue on varied surfaces. (C) To account for additional surface area along the post side-walls, we divide the spreading rate for 40-, 20-, and 10-µm post arrays by the factors 0.75, 0.63, and 0.50, respectively. All error bars indicate 95% confidence interval (n =5 for each condition). All statistical comparisons were Student’s t tests, **P < 0.01.
Since denser posts increase the available substrate area for tissue spreading, we wanted to normalize tissue spreading rates by the available substrate area. Post arrays increase the substrate area within a 2D region by the addition of surface area on the side-walls of the post array. For example, a 20 µm by 20 µm region viewed in the microscope contains the surface of the 20 µm × 20 µm with the additional area of the post side-walls (e.g. for a single 10 µm post the side-wall area is 2πRH; 2 π * 5*40). Thus, for the 10, 20, and 40 µm post arrays the available surface area is 4.1-, 2.6-, and 1.8-fold greater than the 2D apparent area. To correct for the available surface area for tissue spreading, we divided the tissue spreading rates by a scaling factor for each size micropost array (Fig 2c). Macroscopically observed spreading rates decrease with increasing post density (Fig 2b), however, we find that this trend is diminished, but not eliminated once the velocities are scaled (Fig 2c).
Collective movements can be dominated by topographical cues
We fabricated 10 µm MPAs adjacent to regions of flat PDMS and placed individual explants so they would span the interface as this would allow us to examine competing surface topographical cues and thus probe deeper into the collective migration affected by surface topography. As before where MPAs altered tissue spreading, we found that tissues spanning both flat surfaces and MPAs spread faster in the direction of the flat surface than on the MPAs (Fig. 3a, b and Supplementary Video 2). We found the area of the explants spread on the flat surface region was greater than the area spread over the MPAs (Fig. 3b, c) and the rate of tissue spreading into the MPA also was significantly lower when compared to the rate of spreading over flat PDMS surfaces. All explants migrated asymmetrically with a higher rate over flat surfaces (average edge velocity of 13±2 µm per hour over MPAs versus 38±11 µm per hour over flat surfaces). Tissues spanning flat and MPAs spread less than half the distance onto the MPA than onto the adjacent flat surface (Fig. 3d). These results indicate that both the rate and direction of collective migration can be controlled by surface topography in an anisotropic microenvironment.
Figure 3. Spreading of tissues on competing 3D surfaces.
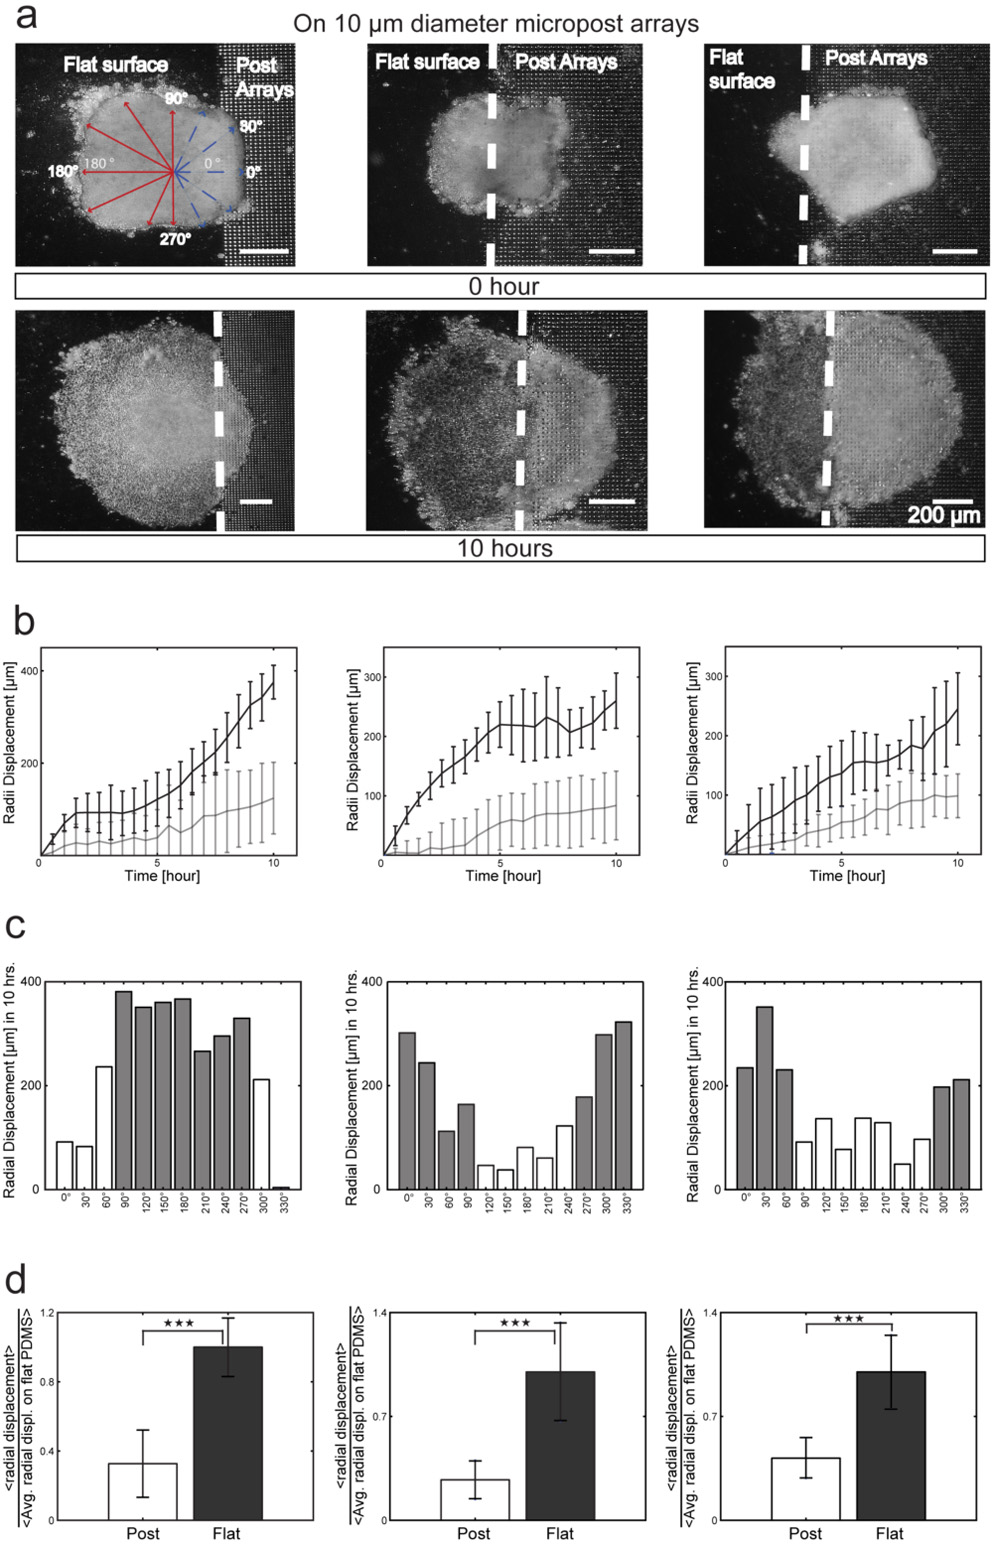
(A) Sequential 10 hour time-lapse images of ACs initially placed with their basal surfaces: (i) primarily on flat surface; (ii) evenly interfaced between the flat surface and MPAs, and (iii) primarily on MPAs. The dotted line indicates the interface position. (B) Radial displacement binned into measurements for every 30 degrees along tissues in (A) on flat PDMS (black line) and on MPAs (gray line) for the three cases. (C) Histogram of radial displacement for the three cases (gray, flat PDMS; white, MPA surfaces) and (D) Displacement on MPAs and flat PDMS surfaces normalized to control flat PDMS spreading. Through this approach, we could determine the increase or decrease relative to flat PDMS spreading. All statistical comparisons were Student’s t tests, ***P < 0.001.
Surface topographical cues influence individual cell movements within the tissue
To understand tissue spreading at an individual cell level in these composite tissue explants, we expressed H2B-mRFP and tracked mRFP expressing mesenchymal nuclei in tissues spreading into 10 µm, 20 µm, and 40 µm MPAs (Fig. 4a and Supplementary Fig. 4 and Supplementary Video 3). To understand the difference between single cell movements that were random and those directed toward the edge of the explant, we calculated the angular deviation of the nuclei trajectory movements[45]. The angular deviation ranged from 0 to 81 degrees, and we found the angular deviation of cells in the center of explant was significantly greater than cells on the edge (Fig. 4b, c; P< 0.001; One-way ANOVA). We found no significant differences in the angular deviation of either edge or center cells between MPAs of differing spacing or flat PDMS (Fig. 4d and Supplementary Video 4).
Figure 4. Cell motility within tissue spreading on 3D surfaces.

(A) Representative max z-projected confocal image of an AC with fluorescent nuclei (H2B-GFP) during spreading with example nuclei trajectories in center and edge nuclei. (B, C) Rose plot distribution of representative nuclei trajectory angles (initial position to final position) in center (B), and edge (C), nuclei of an AC spreading into a 40 µm MPA. One 200×200 µm region of edge and center nuclei was analyzed. The angular deviation is the spread of the nuclei trajectory angle data. Higher deviation is observed in center nuclei compared with edge nuclei (75.6 deg vs. 49.7 deg). (D) Angular deviation of nuclei trajectories on flat PDMS and on MPAs surfaces (mean angular standard deviation in center and edge nuclei are 46.8±5.18 deg and 71.32±4.96 deg, respectively).
Cell size regulates effect of narrowest MPAs on collective movement
MPAs appear to act as physical barriers that slow collective cell migration leading us to hypothesize that the migration rates of tissues with larger cells would be reduced. Since the narrowest spacing between the microposts approached the size of individual cells we hypothesized that changing cell size would affect tissue spreading through the MPAs. To control cell size during tissue spreading we took advantage of the biology of Xenopus embryonic tissues. Early Xenopus embryos undergo rounds of reductive cleavage, i.e. cells do not grow between cell divisions [42] but rather divide their cytoplasm between the two daughter cells. Thus, in order to make larger cells we inhibited cell division with 15 µM Mitomycin C (MMC[46] and Supplementary Fig. 5). We confirmed the effect of MMC on the cell cycle by tracking mitotic events in confocal time-lapses sequences collected over 3 hours in control and MMC treated explants (Supplementary Fig. 6a). In the first 5 hours of spreading, there was no significant change in the rate of spreading between control and MMC treated explants (light gray bars in Supplementary Fig. 6a) due to the delayed effect of MMC in inhibiting cell divisions. After 5 hours of incubation with MMC, we observed significantly decreased spreading on most of surfaces except on flat PDMS and 40 µm MPAs (dark gray bars in Supplementary Fig. 6a). Tissues composed of larger cells had lower spreading rates.
Cell size alters persistence of migration through the MPAs
To understand how individual cell movement contributes to collective migration of the multilayered tissue through MPAs we calculated persistence, directedness, and velocity of individual nuclei. Persistence was calculated by dividing net nuclei displacement by total nuclei displacement (Supplementary Fig. 6b). Independent of the surface topography, we found that cells at the periphery of the explant migrated more persistently than cells in the center of the explant. To characterize the entrainment of persistent migration toward the edge of the explant, we calculated the angle the cell makes with respect to the nearest edge, a quantity we termed directedness. The mean directedness was calculated in edge nuclei by taking the cosine of the displacement vector angle after the tissue was rotated such that the expected spreading direction was 90 degrees (Supplementary Fig. 6c). For example, the cosine of the angle of the cell migratory net vector would be equal to 1 if the cell moved directly towards the direction of spreading. Alternatively, the cosine would be 0 if the cell moved perpendicular to the direction of spreading, and −1 if the cell moved away from the direction of spreading. Cells in MMC treated explants did not have significantly different directedness values from controls across MPAs surfaces, however on the flat PDMS surface, directedness was significantly reduced in MMC treated explants (P < 0.01; T-test) (Supplementary Fig. 6c).
The mean velocities of cell nuclei on all surfaces in control cells were higher on the edge than the center (Supplementary Fig. 6d; P < 0.01; 2-way ANOVA). The mean velocity of cell nuclei on all surfaces in MMC-treated cells were similar to the controls (Supplementary Fig. 6d; P =0.237; 2-way ANOVA). Paradoxically, we observed velocities of cell nuclei in the control and MMC treated tissues were nearly identical even as the overall tissue spreading rates slowed in dense MPAs (Supplementary Fig. 6a). This observation suggested that the persistence of migratory cells and their collective behaviors might depend on cell size and MPA density so we examined the persistence as a function of cell size and cell location within the tissue (center vs. edge; Supplementary Fig. 6b). Cells near the edge of spreading tissues treated with MMC were significantly less persistent than cells near the edge of tissues spreading on flat PDMS, 10 µm, and 20 µm spaced MPA surfaces (P < 0.01; no significance was observed for cell persistence in 40 µm spaced MPAs). Cells in the center of the tissue did not show this trend, with only tissues on the flat surface yielding any difference (P < 0.05) in persistence after drug treatment. From these experiments, we concluded that changes in the rate of tissue spreading (Supplementary Fig. 6a) reflected changes in cell migration persistence rather than cell velocities.
These results suggested a simple phenomenological model that coupled single cell migration to tissue spreading rates. Since MPAs appeared to disrupt both uncorrelated cell movements in the center of the explant and collective cell movements at the edge we sought an equation that would relate measured characteristics of uncorrelated cell migration (velocity, persistence, and directedness) to predict tissue velocity at the edge of the explant. Assuming each explant spread as the uncorrelated movement of individual constituent cells, one could write an equation that would estimate tissue spreading velocity based on uncorrelated cell migration parameters within the center of the explant (Supplementary Fig. 6a):
VTissue = Pnuclei(edge)VnucleiDnuclei
where VTissue is the spreading velocity of the tissue, Pnuclei(edge) is the persistence of nuclei, Vnuclei is the velocity of nuclei, and Dnuclei is the directedness of nuclei at the edge of the explant.
We find that the observed spreading velocities on dense MPA surfaces could be predicted by this equation but spreading velocities exceeded this prediction as MPA densities were lowered (Fig. 5b).
Figure 5. The kinetic relationship of tissue spreading to single cell migration.

(A) Sequential 10 hour time-lapse images of “before” and “after” tissue spreading. (B) Scaled average tissue velocity compared to the tissue model-predicted tissue velocity based on uncorrelated cell migration parameters. For definitions of Pnuclei(edge), Vnuclei, and Dnuclei see equation in the text. Average tissue velocities for explants cultured on micropost arrays were scaled as in Figure 2.
Discussion
By culturing multi-layered embryonic tissues composed of epithelial and mesenchymal cells on 3D microscale structures, we have been able to examine how geometric features of the surface topography modulate single cell movement and how these movements contribute to collective migration. MPAs reduced the rates of collective migration, but did not alter the rates of single cell movement. Varying MPA density and cell size exposed the interaction between these two geometric factors during tissue spreading. Neither individual cell behaviors nor spreading rates of "large-cell" tissues differed from those on flat surfaces, however, increased cell size did reduce the rate of spreading into MPAs. Similar effects were observed when normal-sized cells migrated within dense MPAs. The reduced rates in tissue spreading could be attributed to reduced persistence of single motile cells.
One possible explanation is that persistence is governed by the frequency of collisions between cells and the microposts. In other words, the more frequently a cell contacts a micropost, the more it changes the direction, and the less persistent it is. This suggests that larger cells would collide with posts more frequently, become less persistent, and slow down. An analogy would be the game, Plinko, where a disc is dropped through a vertical peg board with stationary pegs. As the disc falls through the board it is deflected by geometrically distributed pegs. Smaller discs are able to make it through the peg board with less frequent deflections. In our analogy, the discs would be cells and the pegs would be the microposts; the movements of cells through the micropost arrays would be guided by physical interactions akin to steric hindrance[47].
Surface topography also regulates directionality of individual cells within the tissue. Cellular responses to local topographical cues may function in the same way that cells respond to rigidity cues[48]. However, it remains unclear how cells or tissues translate their encounters with surface topography into downstream responses. One possibility is that cells can directly sense the rigidity and topography of the surfaces and use those cues to localize polarity factors and orient traction forces[48]. Alternatively, cell and tissue movements might be physically constrained by the shape of pores or channels through the complex 3D microenvironment[2, 49]. Both topographical guidance cues may be important to direct cell motility and coordinate collective cell migration during embryonic development, the spreading of cancer, vascularization, wound healing, and self-assembly of engineered tissues.
While our study reveals microscopic topography can regulate cell polarity, we have not identified the molecular pathways or polarity factors that might be modulated by cell-cell and cell-post collisions. Further analysis is needed to identify the cell signaling pathways involved in sensing and modulating cell polarity in response to topographical cues in the tissue microenvironment. We suspect these pathways will be closely related to ones regulating cell response to 3D cues and pathways regulating contact inhibition of locomotion in complex tissues (e.g. [50, 51] Reviewed in: [52]). In order for microposts to modulate directional migration, cell-cell and cell-post collisions would need to trigger the destabilization of protrusions and repolarize cell motility after contact, key steps during contact inhibition of locomotion[50, 53, 54].
Since dense micropost arrays can increase the surface density of a 2D region, we suspect ECM within dense micropost arrays might also regulate cell motility. Scanning electron microscopy and confocal microscopy reveal close contact between cells and MPAs and that mesenchymal cells migrated to the base of the microposts quickly after they attached to the arrays. Future studies will need to evaluate tissue spreading and motility in MPAs with different concentrations of ECM. These studies will require precise measurement of substrate adsorption, the number of ECM molecules and focal adhesions per cell within the post array (on the floor, top, and sidewalls of posts) but could establish a quantitative basis to expose how molecular pathways and cell mechanics operating within individual cells contribute to collective migration in spreading tissues.
Finally, we sought to understand how individually migrating cells contribute to tissue spreading and what aspect of their motility is responsible for the changes observed as tissues spread on MPAs. We found that cell velocities were consistent among all surfaces and discovered that cells within MPAs traveled in a less persistent manner. MPAs function as obstacles that cells must travel around, thereby slowing overall collective cell migration rates.
Conclusion
We apply microfabrication to study the role of topographical factors in collective cell migration during spreading of a complex 3D tissue composed of mesenchymal and epithelial cells from the Xenopus laevis, which provides a naturally integrated 3D tissue. We designed MPAs with various topographies from dense to sparse arrays (i.e. inter-post spacing ranging from 10 µm, 20 µm, and 40 µm). Controlling cell size in the same manner as controlling the spacing between posts in MPAs exposed the role of surface topography in controlling the persistence of cell migration. Prior efforts using MPAs have focused on the measurement of traction forces, but MPA may also reveal how intracellular processes such as actomyosin contractions and focal adhesion dynamics translate topographical guidance cues into single cell behaviors and collective migration. As a method for investigating the cellular response to surface-based biophysical cues, MPAs offer a simple, yet powerful technique for controlling the biophysical environment seen by living cells especially in complex 3D environments.
Supplementary Material
Acknowledgements
We thank members of the Davidson, LeDuc, and Sitti labs for their helpful discussions. This work was supported in part by the National Institutes of Health (R01 HD044750 to LD), the National Science Foundation [CAREER IOS-0845775; CMMI-1100515 to LD; CMMI-1100430, CMMI-0856187, CMMI-1160840], and AFOSR grant FA9550-13-1-0108. Any opinions, findings and conclusions or recommendations expressed in this material are those of the authors and do not necessarily reflect the views of the NSF.
Footnotes
Publisher's Disclaimer: This is a PDF file of an unedited manuscript that has been accepted for publication. As a service to our customers we are providing this early version of the manuscript. The manuscript will undergo copyediting, typesetting, and review of the resulting proof before it is published in its final citable form. Please note that during the production process errors may be discovered which could affect the content, and all legal disclaimers that apply to the journal pertain.
References
- 1.Curtis A, Varde M. Control of cell behavior: topological factors. J of the Nat Cancer Inst. 1964;33(1):15–26. [PubMed] [Google Scholar]
- 2.Tseng Q, Wang I, Duchemin-Pelletier E, Azioune A, Carpi N, Gao J, et al. A new micropatterning method of soft substrates reveals that different tumorigenic signals can promote or reduce cell contraction levels. Lab Chip. 2011;11(13):2231–2240. doi: 10.1039/c0lc00641f. [DOI] [PubMed] [Google Scholar]
- 3.Chen CS, Mrksich M, Huang S, Whitesides GM, Ingber DE. Micropatterned surfaces for control of cell shape, position, and function. Biotech Prog. 1998;14(3):356–363. doi: 10.1021/bp980031m. [DOI] [PubMed] [Google Scholar]
- 4.Poujade M, Grasland-Mongrain E, Hertzog A, Jouanneau J, Chavrier P, Ladoux B, et al. Collective migration of an epithelial monolayer in response to a model wound. Proc Natl Acad Sci. 2007;104(41):15988–15993. doi: 10.1073/pnas.0705062104. [DOI] [PMC free article] [PubMed] [Google Scholar]
- 5.Mohr JC, de Pablo JJ, Palecek SP. 3-D microwell culture of human embryonic stem cells. Biomater. 2006;27(36):6032–6042. doi: 10.1016/j.biomaterials.2006.07.012. [DOI] [PubMed] [Google Scholar]
- 6.Teixeira AI, Abrams GA, Bertics PJ, Murphy CJ, Nealey PF. Epithelial contact guidance on well-defined micro-and nanostructured substrates. J of Cell Sci. 2003;116(10):1881–1892. doi: 10.1242/jcs.00383. [DOI] [PMC free article] [PubMed] [Google Scholar]
- 7.Ghibaudo M, Di Meglio J-M, Hersen P, Ladoux B. Mechanics of cell spreading within 3Dmicropatterned environments. Lab Chip. 2011;11(5):805–812. doi: 10.1039/c0lc00221f. [DOI] [PubMed] [Google Scholar]
- 8.Kim Y, Hazar M, Vijayraghavan DS, Song J, Jackson TR, Joshi SD, et al. Mechanochemical actuators of embryonic epithelial contractility. Proc Natl Acad Sci. 2014;111(40):14366–14371. doi: 10.1073/pnas.1405209111. [DOI] [PMC free article] [PubMed] [Google Scholar]
- 9.Engler AJ, Sen S, Sweeney HL, Discher DE. Matrix elasticity directs stem cell lineage specification. Cell. 2006;126(4):677–689. doi: 10.1016/j.cell.2006.06.044. [DOI] [PubMed] [Google Scholar]
- 10.Rossier OM, Gauthier N, Biais N, Vonnegut W, Fardin MA, Avigan P, et al. Force generated by actomyosin contraction builds bridges between adhesive contacts. EMBO J. 2010;29(6):1055–1068. doi: 10.1038/emboj.2010.2. [DOI] [PMC free article] [PubMed] [Google Scholar]
- 11.Dembo M, Wang YL. Stresses at the cell-to-substrate interface during locomotion of fibroblasts. Biophys J. 1999;76(4):2307–2316. doi: 10.1016/S0006-3495(99)77386-8. [DOI] [PMC free article] [PubMed] [Google Scholar]
- 12.Burton K, Park JH, Taylor DL. Keratocytes generate traction forces in two phases. Mol Biol of the Cell. 1999;10(11):3745–3769. doi: 10.1091/mbc.10.11.3745. [DOI] [PMC free article] [PubMed] [Google Scholar]
- 13.Tan JL, Tien J, Pirone DM, Gray DS, Bhadriraju K, Chen CS. Cells lying on a bed of microneedles: an approach to isolate mechanical force. Proc Natl Acad Sci. 2003;100(4):1484. doi: 10.1073/pnas.0235407100. [DOI] [PMC free article] [PubMed] [Google Scholar]
- 14.Du Roure O, Saez A, Buguin A, Austin RH, Chavrier P, Siberzan P, et al. Force mapping in epithelial cell migration. Proc Natl Acad Sci. 2005;102(7):2390. doi: 10.1073/pnas.0408482102. [DOI] [PMC free article] [PubMed] [Google Scholar]
- 15.Saez A, Ghibaudo M, Buguin A, Silberzan P, Ladoux B. Rigidity-driven growth and migration of epithelial cells on microstructured anisotropic substrates. Proc Natl Acad Sci. 2007;104(20):8281. doi: 10.1073/pnas.0702259104. [DOI] [PMC free article] [PubMed] [Google Scholar]
- 16.Galbraith CG, Sheetz MP. A micromachined device provides a new bend on fibroblast traction forces. Proc Natl Acad Sci. 1997;94(17):9114. doi: 10.1073/pnas.94.17.9114. [DOI] [PMC free article] [PubMed] [Google Scholar]
- 17.Liu Z, Tan JL, Cohen DM, Yang MT, Sniadecki NJ, Ruiz SA, et al. Mechanical tugging force regulates the size of cell–cell junctions. Proc Natl Acad Sci. 2010;107(22):9944. doi: 10.1073/pnas.0914547107. [DOI] [PMC free article] [PubMed] [Google Scholar]
- 18.Sniadecki NJ, Anguelouch A, Yang MT, Lamb CM, Liu Z, Kirschner SB, et al. Magnetic microposts as an approach to apply forces to living cells. Proc Natl Acad Sci. 2007;104(37):14553. doi: 10.1073/pnas.0611613104. [DOI] [PMC free article] [PubMed] [Google Scholar]
- 19.Burton K, Taylor DL. Traction forces of cytokinesis measured with optically modified elastic substrata. Nature. 1997;385(6615):450–454. doi: 10.1038/385450a0. [DOI] [PubMed] [Google Scholar]
- 20.Harris AK, Wild P, Stopak D. Silicone rubber substrata: a new wrinkle in the study of cell locomotion. Science. 1980;208(4440):177. doi: 10.1126/science.6987736. [DOI] [PubMed] [Google Scholar]
- 21.Lee J, Leonard M, Oliver T, Ishihara A, Jacobson K. Traction forces generated by locomoting keratocytes. J of Cell Biol. 1994;127(6):1957. doi: 10.1083/jcb.127.6.1957. [DOI] [PMC free article] [PubMed] [Google Scholar]
- 22.Hoffman-Kim D, Mitchel JA, Bellamkonda RV. Topography, cell response, and nerve regeneration. Ann Rev of Biomed Engr. 2010;12:203. doi: 10.1146/annurev-bioeng-070909-105351. [DOI] [PMC free article] [PubMed] [Google Scholar]
- 23.von Dassow M, Strother JA, Davidson LA. Surprisingly simple mechanical behavior of a complex embryonic tissue. Plos One. 2010;5(12):e15359. doi: 10.1371/journal.pone.0015359. [DOI] [PMC free article] [PubMed] [Google Scholar]
- 24.Sochol RD, Higa AT, Janairo RRR, Li S, Lin L. Unidirectional mechanical cellular stimuli via micropost array gradients. Soft Matter. 2011;7(10):4606–4609. [Google Scholar]
- 25.Yang MT, Fu J, Wang YK, Desai RA, Chen CS. Assaying stem cell mechanobiology on microfabricated elastomeric substrates with geometrically modulated rigidity. Nat Protocols. 2011;6(2):187–213. doi: 10.1038/nprot.2010.189. [DOI] [PMC free article] [PubMed] [Google Scholar]
- 26.Martin P. Wound healing--aiming for perfect skin regeneration. Science. 1997;276(5309):75–81. doi: 10.1126/science.276.5309.75. [DOI] [PubMed] [Google Scholar]
- 27.Gurtner GC, Werner S, Barrandon Y, Longaker MT. Wound repair and regeneration. Nature. 2008;453(7193):314–321. doi: 10.1038/nature07039. [DOI] [PubMed] [Google Scholar]
- 28.Petrie RJ, Doyle AD, Yamada KM. Random versus directionally persistent cell migration. Nat Rev Mol Cell Biol. 2009;10(8):538–549. doi: 10.1038/nrm2729. [DOI] [PMC free article] [PubMed] [Google Scholar]
- 29.Yamaguchi H, Wyckoff J, Condeelis J. Cell migration in tumors. Current Opinion in Cell Biol. 2005;17(5):559–564. doi: 10.1016/j.ceb.2005.08.002. [DOI] [PubMed] [Google Scholar]
- 30.Sheetz MP, Felsenfeld DP, Galbraith CG. Cell migration: regulation of force on extracellular-matrix-integrin complexes. Trends in Cell Biol. 1998;8(2):51–54. doi: 10.1016/s0962-8924(98)80005-6. [DOI] [PubMed] [Google Scholar]
- 31.Folkman J, Moscona A. Role of cell shape in growth control. Nature. 1978;273:345–349. doi: 10.1038/273345a0. [DOI] [PubMed] [Google Scholar]
- 32.Yamada KM, Olden K. Fibronectins—adhesive glycoproteins of cell surface and blood. Nature. 1978;275:179–184. doi: 10.1038/275179a0. [DOI] [PubMed] [Google Scholar]
- 33.Couchman J, Rees D. Actomyosin organisation for adhesion, spreading, growth and movement in chick fibroblasts. Cell Biol International Reports. 1979;3(5):431–439. doi: 10.1016/0309-1651(79)90004-3. [DOI] [PubMed] [Google Scholar]
- 34.Abercrombie M, Heaysman JEM, Pegrum SM. The locomotion of fibroblasts in culture:: IV. Electron microscopy of the leading lamella. Exp Cell Research. 1971;67(2):359–367. doi: 10.1016/0014-4827(71)90420-4. [DOI] [PubMed] [Google Scholar]
- 35.Pelham RJ, Wang Y. Cell locomotion and focal adhesions are regulated by substrate flexibility. Proc Natl Acad Sci. 1997;94(25):13661. doi: 10.1073/pnas.94.25.13661. [DOI] [PMC free article] [PubMed] [Google Scholar]
- 36.Yeung T, Georges PC, Flanagan LA, Marg B, Ortiz M, Funaki M, et al. Effects of substrate stiffness on cell morphology, cytoskeletal structure, and adhesion. Cell Motility and the Cytoskeleton. 2005;60(1):24–34. doi: 10.1002/cm.20041. [DOI] [PubMed] [Google Scholar]
- 37.Guo W, Frey MT, Burnham NA, Wang YL. Substrate rigidity regulates the formation and maintenance of tissues. Biophys J. 2006;90(6):2213–2220. doi: 10.1529/biophysj.105.070144. [DOI] [PMC free article] [PubMed] [Google Scholar]
- 38.Gilbert SF. Developmental biology. 10th ed. Sunderland, Mass.: Sinauer Associates Inc. Publishers; 2013. p. 719. [Google Scholar]
- 39.Bravo-Cordero JJ, Hodgson L, Condeelis J. Directed cell invasion and migration during metastasis. Current opinion in cell biology. 2012;24(2):277–283. doi: 10.1016/j.ceb.2011.12.004. [DOI] [PMC free article] [PubMed] [Google Scholar]
- 40.Epstein FH, Singer AJ, Clark RA. Cutaneous wound healing. New England journal of medicine. 1999;341(10):738–746. doi: 10.1056/NEJM199909023411006. [DOI] [PubMed] [Google Scholar]
- 41.Nieuwkoop PD, Faber J. Normal tables of Xenopus laevis (Daudin) Amsterdam: Elsevier North-Holland Biomedical Press; 1967. [Google Scholar]
- 42.Kay BK, Peng HB. Xenopus laevis: practical uses in cell and molecular biology. New York: Academic Press; 1991. p. 581. [PubMed] [Google Scholar]
- 43.Edelstein A, Amodaj N, Hoover K, Vale R, Stuurman N. John Wiley & Sons, Inc.; 2010. Computer Control of Microscopes Using μManager. [DOI] [PMC free article] [PubMed] [Google Scholar]
- 44.Gong Y, Mo C, Fraser SE. Planar cell polarity signalling controls cell division orientation during zebrafish gastrulation. Nature. 2004;430(7000):689–693. doi: 10.1038/nature02796. [DOI] [PubMed] [Google Scholar]
- 45.Zar JH. Biostatistical analysis: Pearson Education India. 1999 [Google Scholar]
- 46.Cooke J. Properties of the primary organization field in the embryo of Xenopus laevis IV. Pattern formation and regulation following early inhibition of mitosis. J of Embryology and Exp Morphology. 1973;30(1):49–62. [PubMed] [Google Scholar]
- 47.Lange JR, Fabry B. Cell and tissue mechanics in cell migration. Experimental cell research. 2013;319(16):2418–2423. doi: 10.1016/j.yexcr.2013.04.023. [DOI] [PMC free article] [PubMed] [Google Scholar]
- 48.Lo CM, Wang HB, Dembo M, Wang Y. Cell movement is guided by the rigidity of the substrate. Biophys J. 2000;79(1):144–152. doi: 10.1016/S0006-3495(00)76279-5. [DOI] [PMC free article] [PubMed] [Google Scholar]
- 49.Khademhosseini A, Langer R, Borenstein J, Vacanti JP. Microscale technologies for tissue engineering and biology. Proc Natl Acad Sci. 2006;103(8):2480–2487. doi: 10.1073/pnas.0507681102. [DOI] [PMC free article] [PubMed] [Google Scholar]
- 50.Theveneau E, Steventon B, Scarpa E, Garcia S, Trepat X, Streit A, et al. Chase-and-run between adjacent cell populations promotes directional collective migration. Nature cell biology. 2013;15(7):763–772. doi: 10.1038/ncb2772. [DOI] [PMC free article] [PubMed] [Google Scholar]
- 51.Tambe DT, Hardin CC, Angelini TE, Rajendran K, Park CY, Serra-Picamal X, et al. Collective cell guidance by cooperative intercellular forces. Nat Mater. 2011;10(6):469–475. doi: 10.1038/nmat3025. Epub 2011/05/24. [DOI] [PMC free article] [PubMed] [Google Scholar]
- 52.Mayor R, Carmona-Fontaine C. Keeping in touch with contact inhibition of locomotion. Trends in cell biology. 2010;20(6):319–328. doi: 10.1016/j.tcb.2010.03.005. [DOI] [PMC free article] [PubMed] [Google Scholar]
- 53.Abercrombie M, Dunn G. Adhesions of fibroblasts to substratum during contact inhibition observed by interference reflection microscopy. Experimental cell research. 1975;92(1):57–62. doi: 10.1016/0014-4827(75)90636-9. [DOI] [PubMed] [Google Scholar]
- 54.Abercrombie M, Heaysman JE. Observations on the social behaviour of cells in tissue culture: I. Speed of movement of chick heart fibroblasts in relation to their mutual contacts. Experimental cell research. 1953;5(1):111–131. doi: 10.1016/0014-4827(53)90098-6. [DOI] [PubMed] [Google Scholar]
Associated Data
This section collects any data citations, data availability statements, or supplementary materials included in this article.