Abstract
Chemical tools that can report radioactive isotopes would be of interest to the defense community. Here we report ~250 nm polymeric nanoparticles containing porphyrinoid macrocycles with and without pre-complexed depleted uranium and demonstrate that the latter species may be detected easily and with high sensitivity via photoacoustic imaging. The porphyrinoid macrocycles used in the present study are non-aromatic in the absence of the uranyl cation, but aromatic after cation complexation. We solubilized both the freebase and metalated forms of the macrocycles in poly(lactic-co-glycolic acid) and found a peak in photoacoustic signal at 910 nm excitation in the case of the uranyl complex. The signal was stable for at least 15 minutes and allowed detection of uranium concentrations down to 6.2 ppb (5.7 nM) in vitro and 0.57 ppm (19 fCi; 0.52 μM) in vivo. To the best of our knowledge, this is the first report of a nanoparticle that detects an actinide cation via photoacoustic imaging.
Keywords: Photoacoustic Imaging, Porphyrinoid Macrocycles, Activatable Nanoparticle, Dosimetery
Defense and energy-related agencies have an urgent need for chemical tools that can identify, sequester, and quantitate dangerous radioisotopes in vivo. While wearable dosimetry badges are an important and affordable tool to measure cumulative exposure over a defined time period1, 2, they cannot be used to image the in vivo distribution of the contamination. Handheld Geiger counting is an important approach to identifying contamination sites and allows detection of alpha and beta particles as well as gamma radiation. However, Geiger counters cannot differentiate between different types of ionizing radiation or identify the isotope producing the radiation1. Furthermore, this approach is not amenable to in vivo imaging nor does it assess the in vivo biodistribution of contamination in a living subject. An alternative approach involves the use of gamma cameras. While these tools provide for powerful clinical imaging and can be used at the point of care to measure gamma irradiation3, they suffer from low spatial (cm) and temporal resolution (minutes), but with sensitivity via single photon emission computed tomography of 10−10 – 10−11 M4.
One alternative is photoacoustic imaging, which is an acoustic detection modality that converts incident light pulses into pressure differences via thermal expansion4–9. Photoacoustics combines the depth of penetration and temporal/spatial resolution of traditional backscatter-mode (B-mode) ultrasound with the high contrast and spectral behavior of optical imaging. Photoacoustics has been used to characterize materials10, 11 and has been applied for a variety of cancer12–16 and cell imaging17, 18 applications. Here we suggest that photoacoustics used in tandem with an appropriate molecular imaging contrast agent could determine actinide concentrations in vivo following radiation exposure.
Before the widespread adoption of inductively coupled plasma mass spectrometry (ICP-MS) for the analysis of heavy metals, photoacoustic spectroscopy was one of many analytical techniques under investigation as a quantitative tool for the analysis of environmental samples19, 20. In one report from 1983, UVI as UO2SO4·3½ H2O concentrations above 1 µM were measured in an aqueous solution with a customized cuvette19. While these in vitro studies illustrated the principle of uranium measurements with photoacoustics, they were only possible because the samples were dissolved in concentrated nitric acid. Furthermore, the absorption peak for UVI (420 nm) is markedly blue-shifted relative to the “optical window” considered optimal for biological imaging (700–1000 nm)4, 5. Thus, the literature has long been silent on the topic of using photoacoustics for measuring this radioisotope. To the best of our knowledge, there have no in vivo detection studies.
We report here an important first step towards achieving the long-term goal of using photoacoustics to detect uranium and other radioisotopes in vivo. Specifically, we describe a new class of nanoparticles based on embedded porphyrinoid molecules and show that these species produce an easy-to-detect photoacoustic signal when the porphyrinoid contains a pre-complexed uranyl cation but not in its absence. The porphyrinoid analogue used for this study, cyclo[1]furan[1]pyridine[4]pyrrole (“F1P1P4”), has electronic features that are highly dependent on its coordination environment, displaying nonaromatic and aromatic features in its freebase and uranyl cation complexed forms, respectively21. We thus hypothesized that these aromaticity changes could be harnessed to quantitate uranyl via photoacoustic imaging. Porphyrin-like structures22, 23 have a long history of use in medicine including as sensitizers for radiation therapy24, 25, photodynamic therapy26, 27, and as imaging agents24, 28, 29. Thus, their reconfiguration for defense imaging applications may face a lower barrier to use in humans than might otherwise be expected.
The metalated and freebase forms of F1P1P4 were independently stabilized in a polymer nanoparticle. After nanoparticle characterization, we studied the spectral behavior and detection limits of the resulting materials. This approach is unique in that the photoacoustic signal is entirely dependent on the uranyl cation—no detectable signal was obtained for the metal-free system. This nanoparticle increases the absorptivity of the uranyl ions, and to the best of our knowledge, represent the first example of in vivo imaging of a radioisotope surrogate using photoacoustics. Long term, we envision a collection of porphyrinoid nanoparticles each with a unique selectively for an isotope of interest as a means of detecting the presence of a specific radio-hazard.
Methods
Nanoparticle Synthesis
The hybrid macrocycle, cyclo[1]furan[1]pyridine[4]pyrrole (ligand), as well as its uranyl-containing analogue (complex), were synthesized as described previously21. The free F1P1P4 macrocycle and its uranyl complex were dissolved to produce 2 mg/mL solutions in acetone and dichloromethane (DCM), respectively. Then, 200 µL of this organic phase was added to 1 mL of a 25 mg/mL solution of acid-terminated poly(lactic-co-glycolic) acid (PLGA) in DCM. The combined organic mixture was added dropwise to 25 mL of a 0.3% solution of polyvinyl alcohol in water with sonication (Sonifier 150, Branson Corp). The resulting mixture was sonicated for an additional 2 minutes followed by rotary evaporation to yield PLGA nanoparticles (NPs).235U-depleted uranium was used throughout. Gold nanorods for comparison were made using the seeded growth method described previously30, 31.
Characterization
Size and surface charge were measured using dynamic light scattering (DLS) and a ZetaSizer-90 (Malvern) instrument, respectively. Inductively coupled plasma-mass spectrometry (ICP-MS) was used to quantitate uranium with NIST-calibrated standards (Inorganic Ventures). To prepare the NPs for analysis, they were dissolved in glacial nitric acid with sonication and then diluted to 5% nitric acid in doubly deionized (DDI) water. All transmission electron microscopy (TEM) and energy-dispersive X-ray spectroscopy (EDS) was performed with a Tecnai G2 X-Twin (FEI Co.) instrument operating at 200 kV.
Photoacoustic Imaging
Photoacoustic imaging was performed with a LAZR commercial instrument (Visualsonics) equipped with a 21 MHz-centered transducer as described previously17, 32. The system uses a flashlamp pumped Q-switched Nd:YAG laser with an optical parametric oscillator and a second harmonic generator operating at 20 Hz between 680 and 970 nm with a 1 nm step size and 4–6 ns pulses. The peak energy is 45 ± 5 mJ at 20 Hz at the source. The spot size is 1 mm × 24 mm and the full field of view is 14–23 mm wide. The acquisition rate is 5 frames per second. Photoacoustic data was quantitated with ImageJ33 using the integrated density function in defined regions of interested. These bit depth values were considered to be arbitrary units (a.u.). Data were considered significant when the two-tailed t test produced a p value greater than 0.05.
Animal Studies
Female nu/nu mice (6–16 weeks old) were used in this study in triplicate at each datum point. All animal work was conducted in accordance with the Administrative Panel on Laboratory Animal Care at Stanford University. Prior to imaging, mice were anesthetized with 2% isofluorane in house oxygen at 2 L/min as confirmed by tail pinch. A 100 µL bolus of the nanoparticles was injected subcutaneously and imaged 15 minutes after injection. For validation studies, animals were sacrificed with CO2, and the implanted nanoparticle bolus analyzed by dissection.
Results and Discussion
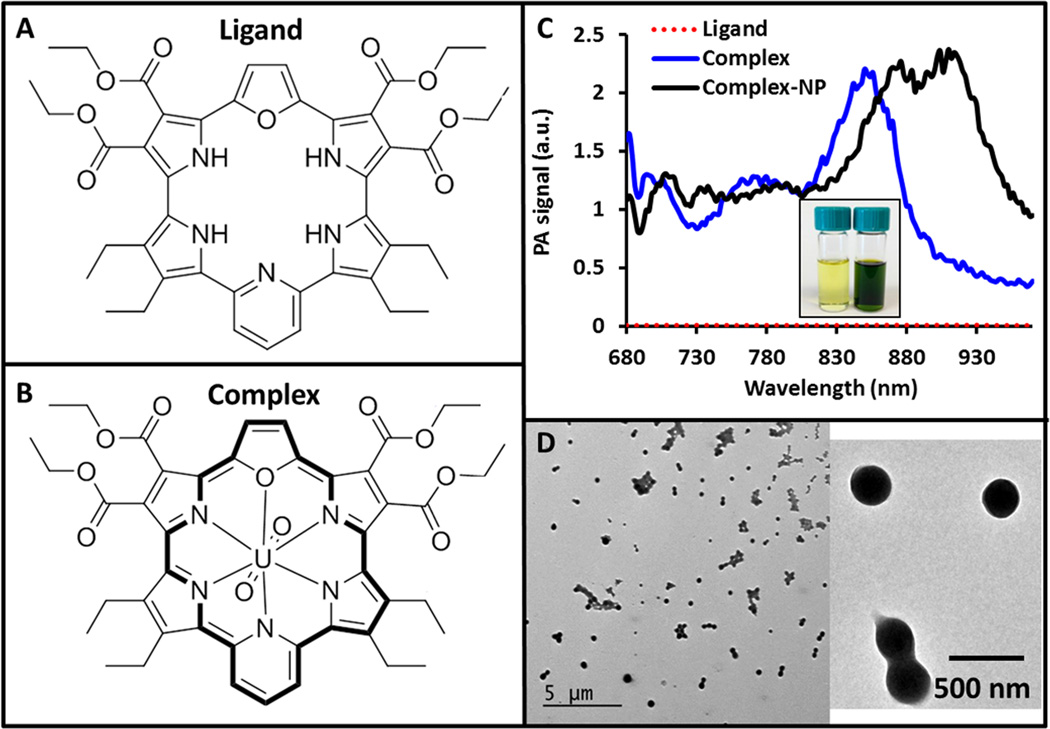
A primary goal was to confirm that uranyl-containing porphyrinoid complexes will indeed produce photoacoustic signal. Towards this end, we dissolved both the ligand (Fig. 1A) and complex (Fig. 1B) in organic solvents at 1 mg/mL each and sealed them inside an agar phantom. The photoacoustic spectra were collected for each (Figure 1C). The complex produced a peak signal at 848 nm, which matches nicely the 847 absorption peak seen in prior work and which is ascribed to the conjugated (4n + 2) π-electron aromatic character of the molecule21. The ligand produced no photoacoustic signal. In fact, the uranyl complex had a signal that was 50- to 250-fold higher than the ligand alone, being 234 ± 17-fold higher over the 826 – 860 nm spectral region near the dominant absorption peak of the complex.
Figure 1. Contrast Agent Design and Characterization.
A) The porphyrinoid macrocycle cyclo[1]furan[1]pyridine[4]pyrrole (“ligand”) lacks full peripheral conjugation in the absence of a uranyl cation. B) On the other hand, the uranyl complex displays aromatic character as reflected in the 4n + 2 π-electron periphery (shown with the darker lines). C) The metal-free ligand (red line) produces no detectable photoacoustic signal. In contrast, the uranyl complex gives rise to a photoacoustic signal with a peak near 850 nm (blue line). This peak shifts to 910 when the complex is placed inside PLGA nanoparticles (black line). Inset: photograph of the ligand dissolved in acetone (yellow) and the uranyl complex dissolved in dichloromethane (green). D) Both the ligand and the complex are very hydrophobic and were placed inside PLGA nanoparticles to increase hydrophilicity. Panel D shows TEM images of these nanoparticles.
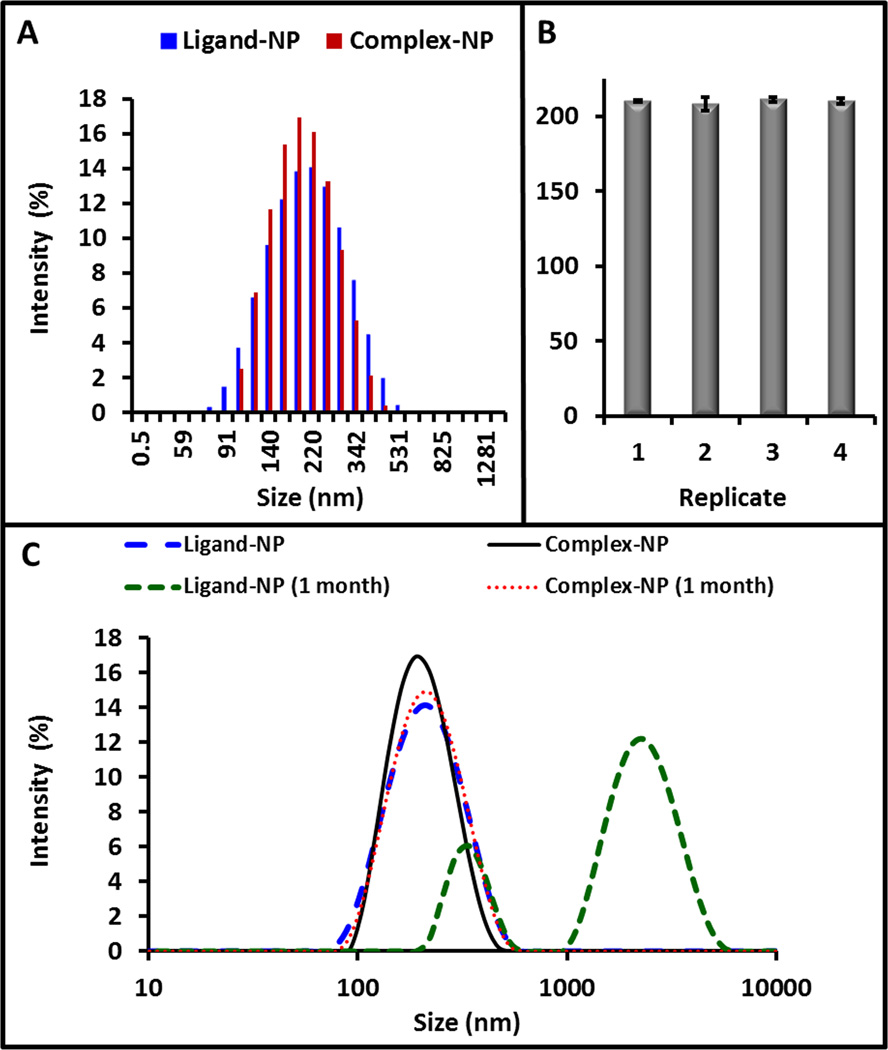
One limitation to using these porphyrinoids in vivo is their poor solubility in aqueous media. To overcome this limitation, we incorporated both the ligand and the complex into PLGA nanoparticles34, 35 and characterized them with TEM (Fig. 1D) and DLS (Fig. 2A). The average size by TEM was 334.7 ± 36.0 nm. By DLS, the ligand-NP was 218.4 ± 5.3 nm and the complex-NP was 218.1 ± 8.6 nm; the polydispersity indices (PDI) were all below 0.125. The surface charge was −30.1 ± 0.9 mV for the ligand-NPs and −23.9 ± 0.6 mV for the complex NPs. Batch-to-batch reproducibility in size for 4 batches was less than 2% (Fig. 2B). We further characterized the complex-containing PLGA NPs (complex-NPs) by drying a known volume to constant weight. The dry weight concentration was 5.5 mg/mL. We used the density of hydrated PLGA and the volume of a 250 nm NP (8.2 × 10⁶ nm3 or 8.2 × 10⁻¹⁵ cm3) to calculate a molar concentration of 0.76 nM nanoparticles. The contribution of the complexes to the density is <0.5% and was thus not considered in the calculations.
Figure 2. Nanoparticle Size Reproducibility and Stability.
A) Dyanmic light scattering data for freshly prepared ligand-NPs and complex-NPs, both with peaks near 220 nm. B) Four replicate batches of complex-NPs were made with bath-to-batch variation below 2%. Error bars in panel B represent the standard deviation of 3 replicate DLS runs. C) DLS analysis was repeated on nanoparticles after storage on the bench for one month. The complex-NPs showed little change, but the ligand-NPs had a dramatic increase in PDI and size. This indicates degradation of the NP.
We also measured the effect of time on nanoparticle stability. The DLS histograms for ligand- and complex-NPs after one month of storage on the benchtop were compared to the histograms collected immediately after synthesis (Fig. 2C). The ligand-NPs had a dramatic change in PDI—0.12 after synthesis and 0.66 one month after synthesis. The peak of the ligand-NPs also shifted to ~2300 nm. In contrast, the complex-NPs showed little change in either PDI or peak location (Fig. 2C). This may be because of the charge stabilizing effects the uranyl complex has on the PLGA nanoparticle.
We next dissolved known amounts of the complex-containing nanoparticles (complex-NPs) in glacial nitric acid with bath sonication and used ICP-MS to measure the uranium concentration. The value obtained, 5.7 ± 0.7 ppm, corresponds to 29,000 uranyl groups per NP. Finally, we recorded the photoacoustic spectrum of the complex-NPs at 0.25 nM. The photoacoustic signal for the complex-NPs (peak maximum at 910 nm) was red-shifted relative to what is seen in organic media (peak maximum at 848 nm; Fig. 1C). This shift is ascribed to π-π donor-acceptor interactions within the hydrophilic nanoparticle that are not present in organic media.
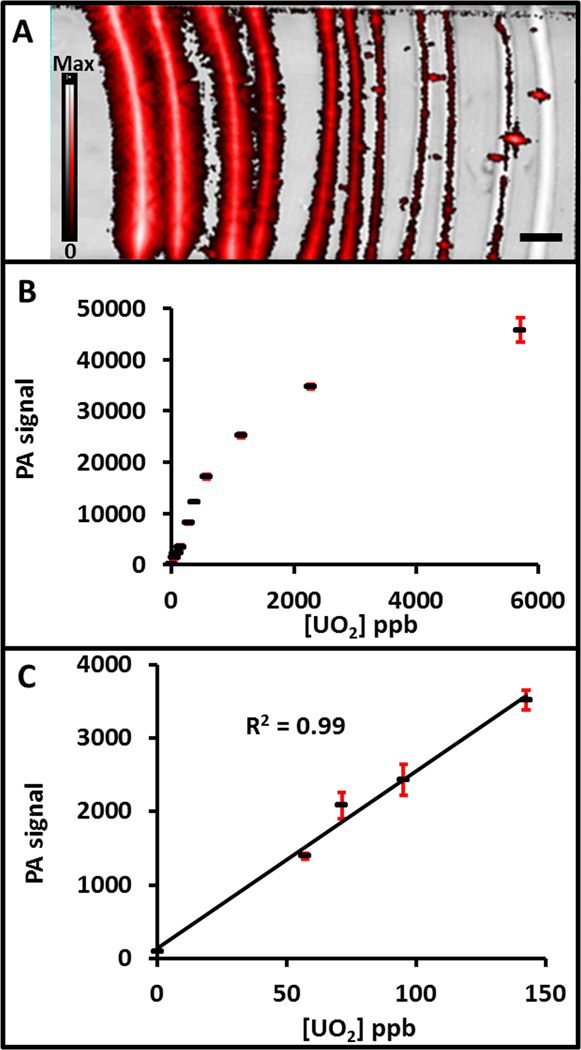
We next measured the photoacoustic signal of decreasing concentrations of complex-NPs in a phantom (Fig. 3A). NPs at concentrations ranging from 5.5 to 0.055 mg/mL (5700 – 57 ppb or 0.76 – 0.0076 nM NPs or 5.2 µM – 0.052 µM uranium chelate) were placed inside plastic tubes using normal saline as the diluent. These tubes were then sealed beneath agar and imaged at 910 nm. Linear behavior (R2>0.96) was noted through 1.1 mg/mL (1140 ppm; Fig 3B). The lowest concentration we measured had photoacoustic signal 15.3-fold higher than the blank (p<0.001; Fig 3C). Using 3 standard deviations above the background, we calculated a theoretical limit of detection of 6.2 ppb uranium. When this 6.2 ppb sensitivity was converted to molarity via the 1092.35 g/mol molecular weight of chelated uranium, the detection limit is 5.7 nM uranium. While this is higher than the parts-per-trillion detection limits that can be attained using ICP-MS36, it is lower (i.e., superior) to complexometric methods37 or atomic absorption spectroscopy. Most important is that this imaging approach can be performed in vivo as detailed below.
Figure 3. Photoacoustic detection limits for the complex-NPs.
A) Decreasing concentrations of the complex-NPs were placed inside plastic tubing and sealed within an agar phantom from left to right. Both B-mode (black and white) and photoacoustic mode (red) imaging was performed. B) Quantitation of the imaging data revealed a U dose dependence and a plateau above 1 ppm uranium. This regime is the equivalent of 5.2 µM – 0.052 µM uranium chelate. C) Plot of the lower region of the graph in B, showing the linear behavior (R2 > 0.99) at and below 150 ppb uranium. The calculated limit of detection is 6.2 ppb. In both panels B and C, the red error bars represent the standard deviation. The scale bar in A represents 5 mm.
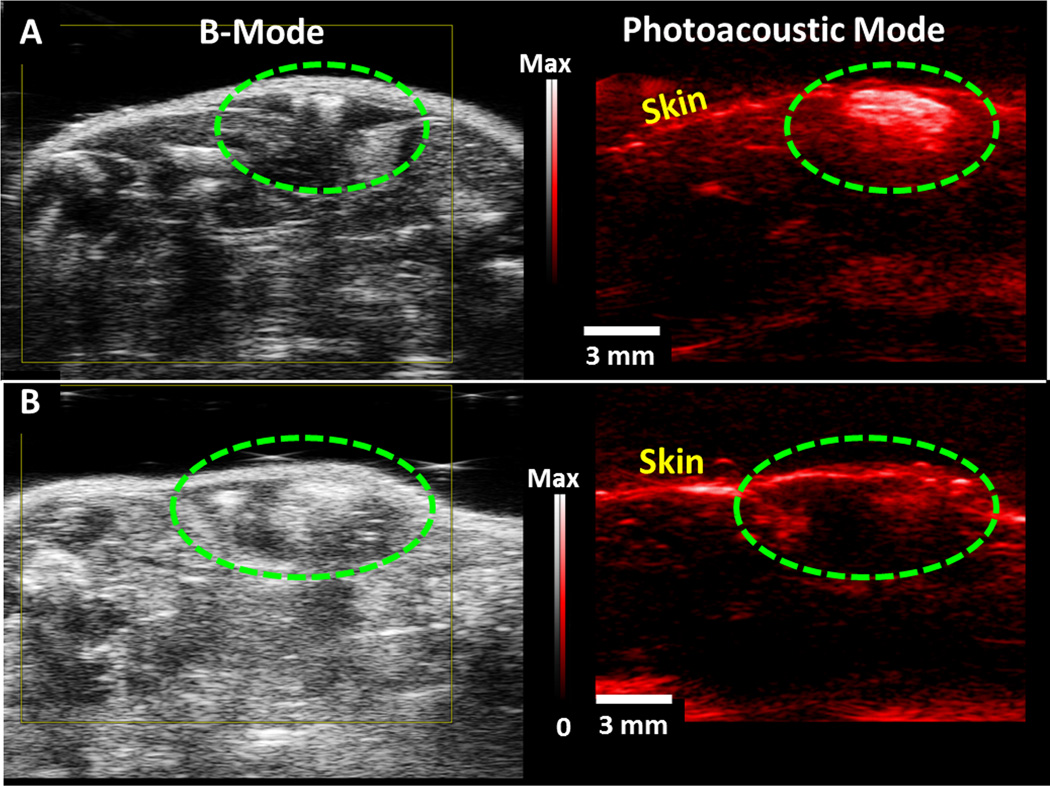
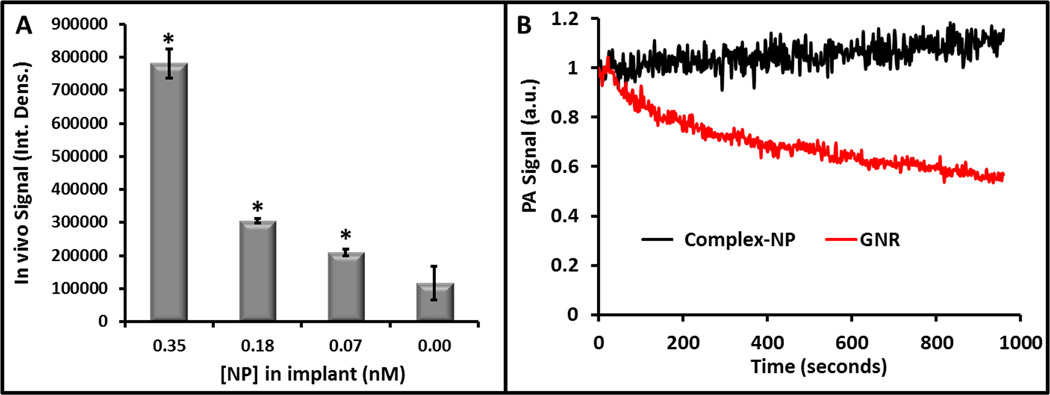
We tested the in vivo sensitivity of our system by implanting 100 µL boluses of complex-NPs into healthy mice (n = 3) with a 50% matrigel carrier (Fig. 4A). We imaged with 910 nm excitation and a 21 MHz center frequency transducer. The photoacoustic signal-to-background was 7.4 for the highest concentration (0.35 nM NPs, 2.85 ppm uranium). The lowest concentration detectable versus sham injection was 570 ppb uranium (0.076 nM nanoparticles; Fig. 5A) and had photoacoustic signal 1.8-fold higher than the sham injection (p<0.05). The relationship between uranium concentration and dose was linear at R2>0.94. When this 570 ppb value was converted to molarity via the 1092.35 g/mol molecular weight of chelated uranium, the sensitivity is 0.52 µM. To better frame this concentration, we converted the 5.7×10⁻⁸ g mass value to activity (assuming pure U238) using the 3.36×10⁻⁷ Ci/g U238 specific activity38. The value of 19 fCi is well below the detection limits of gamma cameras and is even lower than background radiation.
Figure 4. In vivo Imaging.
Panels on the left are backscatter (B-mode) ultrasound images, and panels on the right present photoacoustic data (red). In panel A, a 100 µL bolus of 0.38 nM (2.75 mg/mL) complex-NPs in 50% matrigel was injected subcutaneously and imaged 15 minutes later. Panel B corresponds to the uranium-free NP control. In both panels, the green dashed signal highlights the injection site and the scale bar and intensity scale designators apply to both the B-mode image and the photoacoustic panel.
Figure 5. In vivo Sensitivity and Stability.
A) Decreasing concentrations (2.6 – 0.52 µM uranium complex or 2.85 – 0.57 ppm uranium) of complex-NPs were implanted subcutaneously and imaged with photoacoustics. The response was linear with R2 = 0.94. The * designator indicates significance versus the 0 mg/mL control with p<0.01. B) Equimolar concentrations of complex-NPs and gold nanorods (GNRs) were imaged continuously for 15 minutes. There is no decrease in NP signal, but GNRs show a 40% decrease due to morphology chances from the excitation fluence.
The in vivo imaging data were validated with ICP-MS, which showed that the bolus of uranium complex NPs had 800-fold more uranium than the corresponding bolus containing the metal-free form of the macrocycle. The injection procedure could cause trauma (hematoma) that might artificially increase the photoacoustic signal. To determine whether that was the case, we implanted a 100 µL bolus of 0.38 nM ligand-NPs into mice (Fig. 4B). No increase in photoacoustic signal was seen in these mice.
Finally, we compared the stability of the photoacoustic signal from complex-NPs to that from gold nanorods (GNRs) on an isomolar basis. The molar concentration of the GNRs were estimated using published molar extinction coefficients39. The molar concentration of the PLGA used the size and density. The complex-NPs gave rise to a 2.6-fold stronger signal than gold nanorods at isomolar values and with the wavelengths optimized for each nanoparticle type. That is, we imaged complex-NPs at 910 nm and the GNRs at 733 nm—their respective peak absorptions. Upon continuous imaging at these respective peak wavelengths, there was no significant change in photoacoustic signal intensity even after 15 minutes of continuous illumination in the case of the complex-NPs. In contrast, the signal from the GNRs decreased by 40% over this same period because of deformation under irradiation (Fig. 5B)40.
Other advantages of this approach include the 5 Hz acquisition rate and the 2 to 5 cm penetration depth of photoacoustic imaging. We show more than 2 log orders of improvement in detection limits versus photoacoustic spectroscopy19, 20. This increase is ascribed to the increased molar absorptivity provided by the use of conjugated macrocycles. Typically, uranyl cations display molar absorptivity values between 10–30 (M cm)−1, depending on the wavelength, solvent, counter-ions, etc.19, 41. In contrast, the uranyl-complexed form of the porphyrinoid macrocycle described here has a molar absorptivity of 18,100 (M cm)−1 at 847 nm21. This approach also offers an excitation peak in the heart of the optical window (910 nm). While spectroscopy has suggested a peak at 650 nm for UIV as UO2(NO3)2·6H2O17, this oxidation state has limited stability42.
The stability and selectivity of the complex was assessed previously21. Here, the uranyl complex was incubated with a 10-fold molar excess of 8 different metal ion salts followed by a reflux for 24 hours. Of the 8 samples, appreciable changes to the spectra were only noted for SnCl2, CuCl2, and Th(NO3)4. This may be due to decomposition of the uranium complex or metal ion replacement. One approach to modifying the selectivity is by tuning the ~ 10 Å pore size of the PLGA nanoparticle43. Larger pores have been created on PLGA nanoparticles with H2O244 or ammonium bicarbonate45 and may allow increased penetration of uranyl. Smaller pores could be created by tuning the molecular weight of the polymer. Thus, a pore size optimal for uranyl could be created that physically excludes the larger competing species.
One limitation of the present proof-of-concept study is that it relies on the use of a preformed uranyl complex. The uranyl chelation does not occur in real time in vivo under the conditions of analysis. Current synthetic effort is thus focused on creating porphyrinoids that are both water-soluble and which can complex radioisotopes in vivo.
Future studies with the present system may explore the use of other IR peaks in the second optical window46. The uranyl complex used here also displays a strong peak at 1177 nm in organic media that could be used for second NIR window imaging. While the nanoparticle formulation would also likely red-shift this peak, this spectroscopic feature could also be exploited for photoacoustic imaging with the appropriate laser excitation sources. This is expected to allow a greater depth of penetration for the excitation radiation. In addition, using two wavelengths and a dual wavelength imaging setup might also increase sensitivity via ratiometric imaging to compensate for background signal.
Conclusion
Despite an abundance of reports on porphyrin-based photoacoustic imaging28, 29, 47, 48, to the best of our knowledge, this is the first example wherein porphyrinoids are combined with photoacoustic imaging to quantify a specific test actinide cation. The present study also illustrates the utility of the macrocycle-based NPs for photoacoustic molecular imaging in conjunction with B-mode to obtain anatomic information. We plan to explore other macrocyclic systems, including those with specificity for biologically important cations, such as calcium, magnesium, mercury, and lead, in an effort to monitor disease- and toxicity-related concentrations. Formulating chelating macrocycles with cyclodextrins may also provide for real-time scavenging of various ions in vivo in addition to photoacoustic imaging49.
Statement of Novelty.
To the best of our knowledge, this is the first report of a nanoparticle that detects an actinide cation via photoacoustic imaging.
Acknowledgements
JVJ acknowledges support from NHLBI (HL117048). Instrumentation used in this work was supported by NIH grant S10-OD010344. Support for infrastructure and TEM imaging was provided by NIH grants U54-CA151459 and P50-CA114747 (SSG). The work in Austin was supported by the U.S. Department of Energy (DOE) Office of Basic Energy Sciences (Grant DE-FG02- 01ER15186 to JLS).
References
- 1.Knoll GF. Radiation Detection and Measurement. John Wiley & Sons; 2010. [Google Scholar]
- 2.McLaughlin WL, Boyd A, Chadwick K, McDonald J, Miller A. Dosimetry for Radiation Processing. Taylor and Francis; 1989. [Google Scholar]
- 3.Kawatsuma S, Fukushima M, Okada T. Industrial Robot: An International Journal. 2012;39:428–435. [Google Scholar]
- 4.James ML, Gambhir SS. Physiological Rev. 2012;92:897–965. doi: 10.1152/physrev.00049.2010. [DOI] [PubMed] [Google Scholar]
- 5.Wang LV, Hu S. Science. 2012;335:1458–1462. doi: 10.1126/science.1216210. [DOI] [PMC free article] [PubMed] [Google Scholar]
- 6.Ntziachristos V, Razansky D. Chem. Rev. 2010;110:2783–2794. doi: 10.1021/cr9002566. [DOI] [PubMed] [Google Scholar]
- 7.Razansky D, Distel M, Vinegoni C, Ma R, Perrimon N, Koster RW, Ntziachristos V. Nat. Photon. 2009;3:412–417. [Google Scholar]
- 8.Pu K, Shuhendler AJ, Jokerst JV, Mei J, Gambhir SS, Bao Z, Rao J. Nat. Nano. 2014;9:233–239. doi: 10.1038/nnano.2013.302. [DOI] [PMC free article] [PubMed] [Google Scholar]
- 9.Cheng K, Kothapalli S-R, Liu H, Koh AL, Jokerst JV, Jiang H, Yang M, Li J, Levi J, Wu JC. J. Am. Chem. Soc. 2014;136:3560–3571. doi: 10.1021/ja412001e. [DOI] [PMC free article] [PubMed] [Google Scholar]
- 10.Rosencwaig A. Photoacoustics and Photoacoustic Spectroscopy. Wiley; 1980. [Google Scholar]
- 11.Kruger RA. Med. Phys. 1994;21:127–131. doi: 10.1118/1.597367. [DOI] [PubMed] [Google Scholar]
- 12.Kruger RA, Kuzmiak CM, Lam RB, Reinecke DR, Del Rio SP, Steed D. Med. Phys. 2013;40:113301. doi: 10.1118/1.4824317. [DOI] [PMC free article] [PubMed] [Google Scholar]
- 13.De la Zerda A, Zavaleta C, Keren S, Vaithilingam S, Bodapati S, Liu Z, Levi J, Smith BR, Ma TJ, Oralkan O, Cheng Z, Chen X, Dai H, Khuri-Yakub BT, Gambhir SS. Nat. Nano. 2008;3:557–562. doi: 10.1038/nnano.2008.231. [DOI] [PMC free article] [PubMed] [Google Scholar]
- 14.Kircher MF, de la Zerda A, Jokerst JV, Zavaleta CL, Kempen PJ, Mittra E, Pitter K, Huang R, Campos C, Habte F. Nat. Med. 2012;18:829–834. doi: 10.1038/nm.2721. [DOI] [PMC free article] [PubMed] [Google Scholar]
- 15.Chen YS, Frey W, Kim S, Kruizinga P, Homan K, Emelianov S. Nano Lett. 2011;11:348–354. doi: 10.1021/nl1042006. [DOI] [PMC free article] [PubMed] [Google Scholar]
- 16.Agarwal A, Huang S, ODonnell M, Day K, Day M, Kotov N, Ashkenazi S. J. Appl. Phys. 2007;102 064701-064701-064704. [Google Scholar]
- 17.Jokerst JV, Thangaraj M, Kempen PJ, Sinclair R, Gambhir SS. ACS Nano. 2012;6:5920–5930. doi: 10.1021/nn302042y. [DOI] [PMC free article] [PubMed] [Google Scholar]
- 18.Galanzha EI, Shashkov EV, Kelly T, Kim J-W, Yang L, Zharov VP. Nat. Nano. 2009;4:855–860. doi: 10.1038/nnano.2009.333. [DOI] [PMC free article] [PubMed] [Google Scholar]
- 19.Schrepp W, Stumpe R, Kim J, Walther H. Appl. Phys. B. 1983;32:207–209. [Google Scholar]
- 20.Kimura T, Serrano G, Nakayama S, Takahashi K, Takeishi H. Radiochimca Acta. 1992;58:173–178. [Google Scholar]
- 21.Ho I-T, Zhang Z, Ishida M, Lynch VM, Cha W-Y, Sung YM, Kim D, Sessler JL. J. Am. Chem. Soc. 2014;136:4281–4286. doi: 10.1021/ja412520g. [DOI] [PubMed] [Google Scholar]
- 22.Chang TM, Sinharay S, Astashkin AV, Tomat E. Inorg. Chem. 2014;53:7518–7526. doi: 10.1021/ic5008439. [DOI] [PMC free article] [PubMed] [Google Scholar]
- 23.Sessler JL, Weghorn SJ. Expanded, Contracted and Isomeric Porphyrins. Elsevier; 1997. [Google Scholar]
- 24.Young SW, Qing F, Harriman A, Sessler JL, Dow WC, Mody TD, Hemmi GW, Hao Y, Miller RA. Proc. Natl. Acad. Sci. U.S.A. 1996;93:6610–6615. doi: 10.1073/pnas.93.13.6610. [DOI] [PMC free article] [PubMed] [Google Scholar]
- 25.Thomas AP, Saneesh Babu P, Asha Nair S, Ramakrishnan S, Ramaiah D, Chandrashekar TK, Srinivasan A, Radhakrishna Pillai M. J. Med. Chem. 2012;55:5110–5120. doi: 10.1021/jm300009q. [DOI] [PubMed] [Google Scholar]
- 26.Young S, Woodburn K, Wright M, Mody T, Fan Q, Sessler J, Dow W, Miller R. Photochem. Photobiol. 1996;63:892–897. doi: 10.1111/j.1751-1097.1996.tb09647.x. [DOI] [PubMed] [Google Scholar]
- 27.Ethirajan M, Chen Y, Joshi P, Pandey RK. Chem. Soc. Rev. 2011;40:340–362. doi: 10.1039/b915149b. [DOI] [PubMed] [Google Scholar]
- 28.Zhang Y, Jeon M, Rich LJ, Hong H, Geng J, Zhang Y, Shi S, Barnhart TE, Alexandridis P, Huizinga JD, Seshadri M, Cai W, Kim C, Lovell JF. Nat. Nano. 2014;9:631–638. doi: 10.1038/nnano.2014.130. [DOI] [PMC free article] [PubMed] [Google Scholar]
- 29.Lovell JF, Jin CS, Huynh E, Jin H, Kim C, Rubinstein JL, Chan WC, Cao W, Wang LV, Zheng G. Nat. Mater. 2011;10:324–332. doi: 10.1038/nmat2986. [DOI] [PubMed] [Google Scholar]
- 30.Nikoobakht B, El-Sayed M. Chem. Mater. 2003;15:1957–1962. [Google Scholar]
- 31.Jokerst JV, Cole AJ, Van de Sompel D, Gambhir SS. ACS Nano. 2012;6:10366–10377. doi: 10.1021/nn304347g. [DOI] [PMC free article] [PubMed] [Google Scholar]
- 32.Needles A, Heinmiller A, Ephrat P, Bilan-Tracey C, Trujillo A, Theodoropoulos C, Hirson D, Foster F. IEEE Proceedings. 2010:390–393. [Google Scholar]
- 33.Abramoff MD, Magalhaes PJ, Ram SJ. Biophoton. Intl. 2004;11:36–42. [Google Scholar]
- 34.Mainardes RM, Evangelista RC. Int. J. Pharm. 2005;290:137–144. doi: 10.1016/j.ijpharm.2004.11.027. [DOI] [PubMed] [Google Scholar]
- 35.Mieszawska AJ, Kim Y, Gianella A, van Rooy I, Priem B, Labarre MP, Ozcan C, Cormode DP, Petrov A, Langer R. Bioconjugate Chem. 2013;24:1429–1434. doi: 10.1021/bc400166j. [DOI] [PMC free article] [PubMed] [Google Scholar]
- 36.El Himri M, Pastor A, de la Guardia M. Fresenius' J. Anal. Chem. 2000;367:151–156. doi: 10.1007/s002160051616. [DOI] [PubMed] [Google Scholar]
- 37.Fuller C, Bargar J, Davis J, Piana M. Environ. Sci. Technol. 2002;36:158–165. doi: 10.1021/es0108483. [DOI] [PubMed] [Google Scholar]
- 38.Miller AC, Stewart M, Rivas R, Marino S, Randers-Pehrson G, Shi L. Radiation Meas. 2007;42:1029–1032. [Google Scholar]
- 39.Orendorff CJ, Murphy CJ. Journal of Physical Chemistry B. 2006;110:3990–3994. doi: 10.1021/jp0570972. [DOI] [PubMed] [Google Scholar]
- 40.Link S, Burda C, Nikoobakht B, El-Sayed M. J. Phys. Chem. B. 2000;104:6152–6163. [Google Scholar]
- 41.Smith NA, Cerefice GS, Czerwinski KR. J. Radioanal. Nuc. Chem. 2013;295:1553–1560. [Google Scholar]
- 42.Manfredi C, Caruso V, Vasca E, Vero S, Ventimiglia E, Palladino G, Ferri D. J. Solution Chem. 2006;35:927–937. [Google Scholar]
- 43.Sant S, Nadeau V, Hildgen P. J. Control Release. 2005;107:203–214. doi: 10.1016/j.jconrel.2005.02.017. [DOI] [PubMed] [Google Scholar]
- 44.Bae SE, Son JS, Park K, Han DK. J. Control Release. 2009;133:37–43. doi: 10.1016/j.jconrel.2008.09.006. [DOI] [PubMed] [Google Scholar]
- 45.Yang Y, Bajaj N, Xu P, Ohn K, Tsifansky MD, Yeo Y. Biomaterials. 2009;30:1947–1953. doi: 10.1016/j.biomaterials.2008.12.044. [DOI] [PubMed] [Google Scholar]
- 46.Hong G, Zou Y, Antaris AL, Diao S, Wu D, Cheng K, Zhang X, Chen C, Liu B, He Y. Nat. Comm. 2014;5 doi: 10.1038/ncomms5206. [DOI] [PubMed] [Google Scholar]
- 47.Feitelson J, Mauzerall D. J. Phys. Chem. 1996;100:7698–7703. [Google Scholar]
- 48.Voigtman E, Jurgensen A, Winefordner J. Anal. Chem. 1981;53:1442–1446. [Google Scholar]
- 49.Zhang H, Zhang B, Zhu M, Grayson SM, Schmehl R, Jayawickramarajah J. Chem. Commun. 2014;50:4853–4855. doi: 10.1039/c4cc01372g. [DOI] [PMC free article] [PubMed] [Google Scholar]


