

Abstract
Cutaneous melanoma (CM) is the most lethal form of skin cancers. The Hippo pathway controls cell migration, development and sizes of the organs in diverse species, and deregulation of this pathway may affect CM progression and prognosis. Therefore, we hypothesized that genetic variants of Hippo pathway genes might predict survival of CM patients. We used the genotyping data of 1,115 common single nucleotide polymorphisms (SNPs) in the 12 pathway core genes (i.e., MST1, MST2, SAV1, LATS1, LATS2, MOB1A, MOB1B, YAP1, TEAD1, TEAD2, TEAD3, and TEAD4) from the dataset of our previously published CM genome-wide association study and comprehensively analyzed their associations with CM-specific survival (CSS) in 858 CM patients by using the Kaplan-Meier analyses and Cox proportional hazards regression models. We found a predictive role of YAP1 rs11225163 CC, TEAD1 rs7944031 AG+GG, and TEAD4 rs1990330 CA+AA in the prognosis of CM. In addition, patients with an increasing number of unfavorable genotypes (NUG) had a markedly increased risk of death. After incorporating NUG in the model with clinical variables, the new model showed a significantly improved discriminatory ability to classify CSS (AUC increased from 82.03% to 84.56%). Our findings suggest that genetic variants of Hippo pathway genes, particularly YAP1 rs11225163, TEAD1 rs7944031 and TEAD4 rs1990330, may independently or jointly modulate survival of CM patients. Additional large, prospective studies are needed to validate these findings.
Keywords: cutaneous melanoma, Hippo pathway, cancer specific survival, single nucleotide polymorphisms, Cox regression
INTRODUCTION
During the past several decades, the incidence rate of cutaneous melanoma (CM) has increased among all white populations. In the United States, there were estimated 76,100 new CM and additional 63,770 in situ cases in 2014.1 Much of this increase has been seen in relatively young adults, and, consequently, the number of life-years lost per CM death is higher than that of most other solid tumors.2 Though recent advances in therapies for metastatic CM have shown some progress,3, 4 CM with distant metastasis still has a grim prognosis with a five-year survival rate of 16 percent.5 Current prognostic tools mainly include clinicopathological variables, such as tumor stage, Breslow thickness and mitotic rate.6 However, there is still a wide range of survival rates in CM patients, even for the same tumor stage, which indicates that these methods have insufficient discriminative ability for personalized clinical assessment.7 The heterogeneity of CM in different individuals may have contributed to different prognosis. These call for development of additional or better biomarkers with specific prognostic potential, allowing for personalized clinical management of CM patients. There is growing evidence that germline genetic variations, such as single-nucleotide polymorphisms (SNPs), play a role in cancer prognosis,8–10 a better understanding of which may lead to improved prediction of CM prognosis.
The Hippo pathway (also known as the Salvador-Warts-Hippo pathway) is an evolutionarily conserved regulator of tissue growth and cell fate.11 Recently, several studies have found that mutations and altered expression of a subset of Hippo pathway genes are involved in increased cell proliferation in diverse types of human cancer, such as hepatic carcinoma, oral cancer, and melanoma.12, 13 The Hippo pathway consists of a large network of proteins that control the growth of different tissues during development and regeneration. The pathway core members comprise 13 genes (i.e., MST1, MST2, SAV1, LATS1, LATS2, MOB1A, MOB1B, YAP1, TAZ, TEAD1, TEAD2, TEAD3, and TEAD4).13 Of the proteins encoded by these genes, SAV acts as a scaffold protein for assembling MST1/2 and LATS1/2 and facilitates phosphorylation of LATS1/2 by MST1/2. MOB enhances the activity of LATS1/2, and MST1/2 phosphorylated MOB promotes its interaction with LATS1/2. Activated LATS1/2 then phosphorylates and inactivates the downstream transcriptional co-activator YAP and TAZ. Phosphorylated YAP and TAZ are sequestered in the cytoplasm by interaction with 14-3-3 proteins that stimulate their ubiquitin-mediated proteolysis.14 When YAP and TAZ are not inhibited by the Hippo pathway and remain in the nucleus, they interact with TEADs and activate expression of several genes, such as CTGF, IGFBP3 and ITGB2. The deregulation of the Hippo pathway often correlated with poor patient prognosis has been reported at a high frequency in a broad range of human carcinomas, including cancers of the liver, ovaries, colorectum, lung and prostate as well as CM.12–15
CM is often thought to develop mainly as a result of multiple genetic alterations, a number of which may be linked to the function of the Hippo pathway.12 For example, some studies showed that stable YAP or TAZ knockdown dramatically reduced expression of the classical Hippo target CCN2 as well as anchorage-independent growth and ability to form lung metastases.15 Considering the CM-related links with the Hippo pathway and the lack of molecular epidemiologic studies examining their relation with CM survival, we hypothesized that there was an association between variants of Hippo pathway genes and CM-specific survival (CSS) among CM patients. In the present study, we tested this hypothesis by using the available genotyping data of SNPs in the Hippo pathway genes from a previously published genome-wide association study (GWAS) of CM.16
MATERIALS AND METHODS
Study populations
As described previously,16 all patients were accrued for a hospital-based case-control study of CM at The University of Texas MD Anderson Cancer Center. The characteristic details of subjects have also been recently described.17 Briefly, all patients with CM stage I/II (primary tumors without evidence of regional or distant metastasis), stage III (locoregional disease, including in transit, satellite, and/or regional lymph node metastasis), and stage IV (distant metastasis) were classified according to the 7th edition of the American Joint Committee on Cancer (AJCC) staging system.6 Follow-up was conducted according to standardized guidelines.18 Stage of the disease and length of the follow-up were determined from the date of diagnosis. The final analysis included 858 patients for whom information for eight clinical variables was available (age at diagnosis, sex, Clark level, tumor stage, Breslow thickness, ulceration of tumor, SLNB and mitotic rate). All individuals provided a written informed consent under an Institutional Review Board-approved protocol.
SNP selection and genotyping
Based on the literature13, 19 and the databases of Biocarta (http://www.biocarta.com/) and KEGG (http://www.genome.jp/kegg/), we selected from the Hippo pathway 12 core genes that are located on autosomes (MST1, MST2, SAV1, LATS1, LATS2, MOB1A, MOB1B, YAP1, TEAD1, TEAD2, TEAD3 and TEAD4) along with a single gene, TAZ, that is locatedon the X chromosome. Genotyping and quality control (QC) for the genome-wide scan have been previously described.16 Briefly, genomic DNA extracted from the whole blood was genotyped with the Illumina HumanOmni-Quad_v1_0_B array, and the genotypes were called by using the BeadStudio algorithm, at the John Hopkins University Center for Inherited Disease Research (CIDR). Genome-wide imputation was also performed using the MACH software based on 1000 Genome project, phase I V2 CEU data. The typed or imputed common SNPs (with a minor allele frequency ≥ 0.05, a genotyping successful rate ≥ 95%, a Hardy-Weinberg equilibrium P-value ≥ 0.00001, and imputation for those SNPs with r2 ≥ 0.8) within these genes were selected. As a result, 147 genotyped SNPs and 968 imputed SNPs in the Hippo pathway genes were extracted from our CM GWAS dataset and used for the analyses.
False positive report probability (FPRP)
We also calculated the FPRP to assess the false-positive association findings.20 For all the significant results, we assigned a prior probability of 0.1 to detect a HR of 2.0 for an association with genotypes and alleles of each SNP. Only the significant results with an FPRP value < 0.2 considered a noteworthy association.
Statistical methods
CSS was the outcome measure to be evaluated in the present study. The CSS time was calculated from the date of diagnosis to the date of death from melanoma or date of the last follow-up. Cox proportional hazards regression models were used to estimate the HR and 95% CI for the associations of demographic and clinical variables with CSS. Associations between SNPs and CSS (in an additive model) were obtained by both univariate and multivariable Cox models performed with the GenABEL package of R software21 with adjustment for age, sex, Breslow thickness, tumor stage, Clark level, SLNB, tumor cell mitotic rate and ulceration of tumor. An FPRP cut-off of 0.2 was also applied to limit the probability of false positive findings as a number of SNPs had been tested. We summarized the number of risk (unfavorable) genotypes identified from the stepwise regression models for CSS. Kaplan-Meier survival curves and log-rank tests were also used to evaluate the effects of SNPs on the cumulative probability of CSS. Receiver operating characteristic (ROC) curve was constructed from the logistic regression model, and the area under the curve (AUC) was used to assess the classification performance of the model. Statistical significance of the AUC change was calculated by the Delong’s test.22 Linear regression analysis was also used to test for the trends in the associations between SNPs and corresponding gene expression levels obtained from the 270 lymphoblastoid cell lines from CEU and other HapMap samples.23 The methylation quantitative trait loci (meQTL) associations was assessed by Genevar on adipose tissue from a population of 428 female twin-pairs (858 individuals), collected as a part of the Multiple Tissue Human Expression Resource (MuTHER) project.24, 25 All other analyses were performed using SAS software (Version 9.3; SAS institute, Cary, NC). All reported P values were two-sided, and P<0.05 was considered statistically significant.
RESULTS
Patient characteristics
The final analyses included 858 patients with primary CM (Table S1), who had complete information about clinical variables, questionnaire data and GWAS data. The patients had an age range between 17 and 94 years (52.4 ±14.4 years) at diagnosis, with a median follow-up time of 81.1 months. There were more men (496, 57.8%) than women (362, 42.2%) and more stages I/II patients (709, 82.6%) than stages III/IV patients (149, 17.4%). Of the 858 patients, 95 (11.07%) had died of CM at the last follow-up. In univariate analysis, age, sex, Clark level, tumor stages, Breslow thickness, ulceration, SLNB and mitotic rate were significant predictors for CSS. In multivariate analysis, four variables remained independently and significantly associated with CSS, which include Clark level (HR = 2.30 for IV/V vs. II/III), tumor stage (HR = 11.66 for III/IV vs. I/II), primary Breslow thickness (HR = 2.86 for >1 mm vs. ≤1 mm), and ulceration (HR = 2.59 for yes vs. no).
Multivariate analyses of associations between SNPs and CSS
To assess associations of 147 typed and 968 imputed SNPs with CSS, we performed both univariate and multivariate Cox regression analyses with adjustment for age, sex, tumor stage, Breslow thickness, SLNB, Clark level, ulceration of tumor and tumor cell mitotic rate.
Specifically, 37 SNPs were individually significantly associated with CSS at P < 0.05 in an additive genetic model. FPRP was used to correct for multiple comparisons and to lower the probability of false positive associations, in which eight SNPs were still considered noteworthy, including six SNPs of YAP1, one SNP of TEAD1, and one SNP of TEAD4 (Table S2, S3). The regional association plots for YAP1, TEAD1 and TEAD4 in the additive genetic model are presented in Figure S1.
Hippo pathway variants as independent survival predictors
As shown in Table I and S4, the initial stepwise Cox regression analyses suggested three SNPs (YAP1 rs11225163 C>T, TEAD1 rs7944031 A>G, and TEAD4 rs1990330 C>A) as important and independent predictors for CSS of CM patients. In multivariate analyses using an additive genetic model, rs7944031 G and rs1990330 A alleles showed a risk effect on death, while rs11225163 T acted as a protective allele. We further performed univariate and multivariate analyses for the effects on risk of CSS or in the presence of all other clinicopathological covariates. We found that the rs11225163 CC genotype showed a strong association with a shorter CSS [CC vs. CT+TT: HR = 1.79, 95% confident interval (CI) = 1.18–2.72, P = 0.007]. Patients with rs7944031 AG+GG genotypes exhibited significantly increased hazards of early death, compared with those who had the AA genotype (HR = 1.82, 95% CI = 1.14–2.89, P = 0.012). Furthermore, the rs1990330 CA+AA genotypes were associated with statistically significantly worse CSS, compared with the CC genotype (HR = 1.56, 95% CI = 1.03–2.38, P = 0.037) (Table II). In the multivariate analyses performed with adjustment for age, sex and tumor stage, similar results were found (Table S5).
Table I.
Predictors of CM-specific survival obtained from stepwise Cox regression analysis of selected variables†
| Parameter | Category a | No. | P value | HR (95% CI) |
|---|---|---|---|---|
| Age | >50/≤ 50 | 487/371 | 0.162 | 1.39 (0.88–2.19) |
| Sex | Male/Female | 496/362 | 0.081 | 1.51 (0.95–2.40) |
| Clark level | IV/V/II/III | 459/399 | 0.007 | 2.35 (1.27–4.34) |
| Tumor stage | III and IV/I and II | 149/709 | <0.001 | 3.30 (2.13–5.12) |
| Breslow thickness (mm) | ≥1/<1/mm | 511/347 | 0.006 | 3.59 (1.44–8.92) |
| Ulceration of tumor | Yes/No | 155/681 | <0.001 | 2.74 (1.78–4.23) |
| rs11225163 | CC/CT+TT | 342/516 | 0.004 | 1.86 (1.23–2.82) |
| rs7944031 | AG+GG/AA | 205/653 | 0.012 | 1.81 (1.14–2.87) |
| rs1990330 | CA+AA/CC | 385/473 | 0.016 | 1.67 (1.10–2.54) |
CM = cutaneous melanoma; HR = hazards ratio.
Including age, sex, tumor stage, Breslow thickness, SLNB, Clark level, ulceration of tumor and tumor cell mitotic rate.
Genotypes 8 SNPs of three genes (YAP1 (rs11225163, rs12226331, rs12795624, rs7110557, rs11605954 and rs12793501), TEAD1 rs7944031, TEAD4 rs1990330) were included in the stepwise multivariate Cox proportional hazards regression analysis.
The “/ category” was used as the reference.
Table II.
Associations between selected SNPs in the Hippo pathway genes and CM-specific survival
| No.
|
Univariate analysis
|
Multivariate analysis*
|
||||
|---|---|---|---|---|---|---|
| Patients | Death (%) | HR (95% CI) | P | HR (95% CI) | P | |
| YAP1 | ||||||
| rs11225163 | ||||||
| CC | 342 | 49 (14.33) | 1.00 | 1.00 | ||
| CT | 394 | 36 (9.14) | 0.63 (0.41–0.97) | 0.035 | 0.55 (0.35–0.87) | 0.010 |
| TT | 122 | 10 (8.20) | 0.51 (0.26–1.00) | 0.051 | 0.59 (0.30–1.18) | 0.135 |
| CT+TT | 516 | 46 (8.91) | 1.00 | 1.00 | ||
| CC | 342 | 49 (14.33) | 1.67 (1.12–2.50) | 0.012 | 1.79 (1.18–2.72) | 0.007 |
| TEAD1 | ||||||
| rs7944031 | ||||||
| AA | 653 | 68 (10.41) | 1.00 | 1.00 | ||
| AG | 185 | 25 (13.51) | 1.34 (0.85–2.12) | 0.211 | 1.81 (1.13–2.92) | 0.014 |
| GG | 20 | 2 (10.00) | 0.98 (0.24–4.00) | 0.977 | 1.85 (0.45–7.56) | 0.395 |
| AA | 653 | 68 (10.41) | 1.00 | 1.00 | ||
| AG+GG | 205 | 27 (13.17) | 1.31 (0.84–2.04) | 0.243 | 1.82 (1.14–2.89) | 0.012 |
| TEAD4 | ||||||
| rs1990330 | ||||||
| CC | 473 | 41 (8.67) | 1.00 | 1.00 | ||
| CA | 332 | 46 (13.86) | 1.60 (1.05–2.43) | 0.029 | 1.51 (0.98–2.33) | 0.065 |
| AA | 53 | 8 (15.09) | 1.74 (0.81–3.71) | 0.154 | 1.95 (0.90–4.43) | 0.090 |
| CC | 473 | 41 (8.67) | 1.00 | 1.00 | ||
| CA+AA | 385 | 54 (14.03) | 1.62 (1.08–2.43) | 0.021 | 1.56 (1.03–2.38) | 0.037 |
SNPs = single nucleotide polymorphisms; CM = cutaneous melanoma; HR = hazards ratio.
Adjusted for age, sex, tumor stage, Breslow thickness, SLNB, 0. level, ulceration of tumor and tumor cell mitotic rate in the Cox models.
Combined genetic predictors for survival of CM patients
To better estimate the joint effect of the three SNPs on hazards of patients’ prognosis across the Hippo pathway genes that we analyzed, we combined the risk or unfavorable genotypes of YAP1 rs11225163 CC, TEAD1 rs7944031 AG/GG and TEAD4 rs1990330 CA/AA into one variable as the number of unfavorable genotypes (NUG). The numbers of patients who had zero, one, two, and three NUG were 216, 395, 204 and 43, respectively. Per-unit increase of NUG (the trend measure) was associated with an increased risk of death (P trend < 0.001, Table III). Patients with one NUG had markedly increased risk of death by nearly three fold (HR = 2.88, 95% CI = 1.40–5.93) and patients with three NUG had a markedly increased risk of death by nearly six fold (HR = 5.89, 95% CI = 2.07–16.77), compared with those who had no NUG. In the multivariate analyses performed with adjustment for age, sex and tumor stage, we found similar results (Table S6). For illustrative purposes, Kaplan Meier curves of the associations with CSS for NUG are shown in Figure 1.
Table III.
HRs associated with the combined NUG in the Hippo pathway genes in CM patients
| NUG† | No.
|
Univariate analysis
|
Multivariate analysis*
|
|||
|---|---|---|---|---|---|---|
| Patients | Death (%) | HR (95% CI) | P | HR (95% CI) | P | |
| 0 | 216 | 9 (4.17) | 1 | 1 | ||
| 1 | 395 | 48 (12.15) | 3.07 (1.50–6.25) | 0.002 | 2.88 (1.40–5.93) | 0.004 |
| 2 | 204 | 32 (15.69) | 4.01 (1.91–8.40) | <0.001 | 4.16 (1.97–8.79) | <0.001 |
| 3 | 43 | 6 (13.95) | 3.44 (1.22–9.67) | 0.019 | 5.89 (2.07–16.77) | <0.001 |
| Trend | P < 0.001 | P < 0.001 | ||||
| 0 | 216 | 9 (4.17) | 1 | 1 | ||
| 1 | 395 | 48 (12.15) | 3.06 (1.50–6.24) | 0.003 | 2.89 (1.40–5.93) | 0.004 |
| 2–3 | 247 | 38 (15.38) | 3.91 (1.89–8.08) | <0.001 | 4.37 (2.10–9.11) | <0.001 |
| Trend | P < 0.001 | P < 0.001 | ||||
| 0 | 216 | 9 (4.17) | 1 | 1 | ||
| 1–3 | 642 | 86 (13.40) | 3.39 (1.71–6.73) | <0.001 | 3.41 (1.70–6.81) | <0.001 |
NUG = number of unfavorable genotype; CM = cutaneous melanoma.
Number of unfavorable genotypes (NUG) included rs11225163 CC, rs7944031 AG/GG, and rs1990330 CA/AA.
Adjusted by age, sex, tumor stage, Breslow thickness, SLNB, Clark level, ulceration of tumor and tumor cell mitotic rate.
Figure 1.
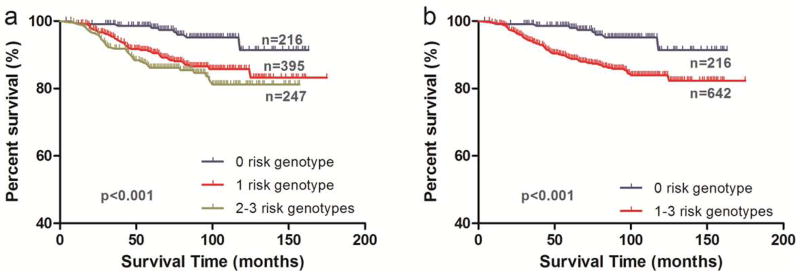
Kaplan-Meier analysis for patients with cutaneous melanoma by the combined risk genotypes. (a) by 0, 1 and 2–3 risk genotypes (log-rank test: P<0.001); and (b) by 0 and 1–3 risk genotypes (log-rank test: P<0.001)
Stratified analyses between unfavorable genotypes and CSS
Stratified analyses were also performed to evaluate whether the combined effect of unfavorable genotypes on survival was modified by the important clinicopathologicl factors in Table S7. We found that compared with those with zero risk genotypes, those with 1 or 2–3 risk genotypes had significantly poor survival in most of stratified subgroups, except for the subgroups of mitotic rate less than 1 mitoses/mm2, Clark level lower than III and Breslow thickness less than 1 cm (Figure s2).
ROC curve
By using multivariate logistic regression and the ROC curve, we further evaluated the NUG for its potential to improve the classification of 5-year CSS. As shown in Figure 2, with clinical variables (i.e., clark level, ulceration of tumor, tumor stage and Breslow thickness) included as the classifiers, the CSS model had an AUC =82.03%. With the addition of NUG to the model, the AUC was significantly improved to 84.56% (P = 0.012, DeLong’s test), suggesting a potential role of the NUG in predicting patients’ risk of death.
Figure 2.

Receiver operating characteristic (ROC) curves for prediction of cutaneous melanoma-specific survival (CSS) rate based on clinical variables (i.e., clark level, ulceration of tumor, tumor stage and Breslow thickness); clinical variables plus the summary score of risk genotypes (i.e., rs11225163 CC, rs7944031 AG/GG and rs1990330 CA/AA).
Analyses of associations of SNPs with gene expression and methylation status
We further evaluated correlations between SNPs and mRNA expression levels of their corresponding genes in normal cells, a possible functional basis for the observed associations, by using the published gene expression data of the 270 HapMap normal lymphoblastoid cell lines derived from diverse populations,23 whose genotyping data were also available for YAP1 rs11225163 C>T, TEAD1 rs7944031 A>G, and TEAD4 rs1990330 C >A. Consistent with the observed associations, the rs7944031 and rs1990330 genotypes were associated with significant changes in mRNA expression levels of TEAD1 (P = 0.010) and TEAD4 (P = 0.034) in the additive genetic model, but no statistically significant association was found between rs11225163 genotypes and YAP1 mRNA expression levels (P = 0.465) (Figure S3). We also examined whether these SNPs were associated with corresponding gene methylation status. As shown in Figure 3, rs11225163 and rs7944031 genotypes were significantly associated with the methylation status of YAP1 (probe ID cg20782778, P = 1.25×10⁻⁶) and TEAD1 (probe ID cg24506086, P = 1.10×10⁻¹⁶). Additionally, we observed a marginal association between rs1990330 genotypes and cis meQTL effects of TEAD4 (probe ID cg16257219, P = 0.062). These results suggested that YAP1 rs11225163, TEAD1 rs7944031 and TEAD4 rs1990330 might have some impact on their corresponding gene expression and function by modulating gene methylation status.
Figure 3.

meQTL associations of rs11225163 (a) with YAP, rs7944031 (b) with TEAD1 and rs1990330(c) with TEAD4 (circled). DNA methylation profiles were from 648 European-descent individuals female twins (97 MZ pairs, 162 DZ pairs, and 130 singletons) included in the MuTHER study with the use of the Illumina HumanMethlation450 BeadChip.
DISSCUSSION
To our knowledge, this is the first study to evaluate associations between genetic variants in the Hippo pathway genes and CSS. We found that YAP1 rs11225163 C>T, TEAD1 rs7944031 A>G and TEAD4 rs1990330 C>A were likely to independently or jointly modulate specific survival of CM patients. We also showed that in addition to the known prognostic variables, the incorporation of numbers of risk or unfavorable genotypes of Hippo pathway genes could significantly improve the prediction of CSS. These findings suggested that Hippo pathway genes might have a biological implication in melanoma progression, possibly through a mechanism of modulating the gene expression and methylation status.
YAP1 and TEADs are of the core members of the Hippo pathway. The YAP1 gene is located on chromosome 11q22, also called YKI, while TEAD1 is located on chromosome 11p15 and TEAD4 located on chromosome 12p13. Studies have shown that YAP promotes tissue growth and cell viability by regulating the activity of different transcriptional factors, such as TEADs, that are key mediators of tumorigenic potential of YAP and cellular growth; however, the genetic basis by which these factors regulate tissue growth is not well defined.13 It is known that proliferation and invasiveness of melanoma cells are promoted by the YAP-TEAD complex based on animal models of melanoma.26 As a major regulator of organ size and proliferation in vertebrates, YAP1 can act as an oncogene in several tissue types, if its activity increases aberrantly. Although no activating mutations in the YAP1 gene have been identified in human cancers, YAP1 is amplified in several human tumors,27 possibly as a result of altered gene expression, suggesting a role in tumor progression.
Evidence also exists that the Hippo pathway genes may influence response to cancer treatment and subsequent prognosis. For example, while the expression levels of LATS1 in non-small-cell lung cancer (NSCLC) was significantly correlated with p-TNM stage and lymph node metastasis, loss of LATS1 expression was associated with a short NSCLC overall survival.28 Although we could find little prior evidence linking YAP1 and TEADs to CM prognosis, YAP1 and TEADs genes have been shown to influence treatment and prognosis in other cancers. For instance, YAP1 was found to promote ovarian cancer cell growth and tumorigenesis both in vitro and in vivo, high YAP1 expression levels were positively correlated with TEAD4 expression levels, and their co-expression was a prognostic marker for poor ovarian cancer survival.29 It was also reported that YAP1 might play an important role in prognosis of small-cell lung cancer patients treated with platinum-based chemotherapy,30 whereas YAP1 overexpression was correlated with progression, lymph node metastasis and poor prognosis of gastric carcinoma.31 In addition, high TEAD1 expression levels were correlated with poor clinical outcome in prostate cancer,32 while aberrant YAP activity can promote mammary melanoma metastasis in a manner that is highly dependent on the TEAD-interaction domain. Finally, YAP exerts its pro-metastatic effects at both primary and metastatic sites and can enhance several distinct processes known to contribute to metastasis.26
In the present study, we found some striking associations of CSS with genetic variants in YAP1 and TEADs. Specifically, YAP1 rs11225163, TEAD1 rs7944031 and TEAD4 rs1990330 could modulate CSS independently. Furthermore, the combined NUG of these SNPs could discriminate different prognostic groups, a robust effect that was consistent across both univariate and multivariate analyses, independent of other pathological characteristics. We believed our results were biologically plausible and therefore sought further evidence for the underlying molecular mechanisms. Although YAP1 rs11225163, TEAD1 rs7944031 and TEAD4 rs1990330 were associated with CSS, we were unable to conduct expression analysis on our own specimens, due to the lack of RNA samples from the study population. Instead, we downloaded the published expression data of the 270 HapMap lymphoblastoid cell lines derived from diverse populations.23 Importantly, we found that the TEAD1 and TEAD4 mRNA expression levels changed in a linear manner with an increasing number of risk alleles of rs7944031 and rs1990330 in an additive genetic model. At the same time, using the MuTHER project data, both rs11225163 and rs7944031 were associated with the methylation status of their corresponding YAP1 and TEAD1 genes, respectively. Therefore, all of these three SNPs might affect their corresponding gene’s functions. These correlations provide a possible biological explanation for the observed associations with CSS.
Our study has a number of strengths and limitations. First, it is a comprehensive analysis of associations between SNPs in the Hippo pathway genes and CSS in CM patients with a median follow-up time of 81.1 months. In our analyses, we performed FPRP to assess the possibility of false positive associations and adjusted for some statistically significant and clinically important variables that could confound the genetic effects on CSS. Our findings demonstrated potential importance of assessing CM prognosis by combining clinicopathological characteristics with genetic information. The observed improvement of discrimination of CSS by adding genetic factors supports prognostic impact of genetic associations and potential clinical applications. One caveat regarding our study is that the prognosis-predicting model was built in a non-Hispanic white population in the United States, and therefore its application to different ethnic groups will require further investigation and validation. Another limitation is that our analysis did not take into account gene-gene interactions that widely exist in complex diseases like cancer; our ability to perform such an evaluation was limited by the sample size and study power, given the relatively limited number of outcome events observed in the present study.
In summary, we performed a comprehensive assessment of genetic variants in genes involved in the Hippo pathway, and we identified three SNPs (i.e., YAP1 rs11225163, TEAD1 rs7944031 and TEAD4 rs1990330) that may have independent or joint effects on survival of CM patients. However, our findings need to be validated in an independent, larger patient population, preferably with different ethnic groups.
Supplementary Material
Acknowledgments
This work was partially supported by the National Institutes of Health (National Cancer Institute) Grants R01 CA100264 and 2P50CA093459; the Marit Peterson Fund for Melanoma Research; and the Start-Up funds from Duke Cancer Center, Duke University Medical Center. Hua Yuan was sponsored by Jiangsu Health International Exchange Program for 12 months of studying at Duke University and support from Collaborative Innovation Center For Cancer Personalized Medicine, Nanjing Medical University. We thank the individuals who participated in this project. We thank the John Hopkins University Center for Inherited Disease Research for conducting high-throughput genotyping for this study. The funders had no role in study design, data collection and analysis, decision to publish, or preparation of the manuscript.
Abbreviation
- CM
cutaneous melanoma
- SNPs
single nucleotide polymorphisms
- CSS
CM specific survival
- adjHR
adjusted Hazard Ratio
- CI
confident interval
- SLNB
sentinel lymph node biopsy
- FPRP
false positive report probability
- NUG
number of unfavorable genotypes
Footnotes
CONFLICT OF INTEREST
The authors state no conflict of interest.
References
- 1.Siegel R, Ma J, Zou Z, Jemal A. Cancer statistics, 2014. CA Cancer J Clin. 2014;64:9–29. doi: 10.3322/caac.21208. [DOI] [PubMed] [Google Scholar]
- 2.MacKie RM, Hauschild A, Eggermont AM. Epidemiology of invasive cutaneous melanoma. Ann Oncol. 2009;20(Suppl 6):vi1–7. doi: 10.1093/annonc/mdp252. [DOI] [PMC free article] [PubMed] [Google Scholar]
- 3.Chapman PB, Hauschild A, Robert C, Haanen JB, Ascierto P, Larkin J, Dummer R, Garbe C, Testori A, Maio M, Hogg D, Lorigan P, et al. Improved survival with vemurafenib in melanoma with BRAF V600E mutation. N Engl J Med. 2011;364:2507–16. doi: 10.1056/NEJMoa1103782. [DOI] [PMC free article] [PubMed] [Google Scholar]
- 4.Young K, Minchom A, Larkin J. BRIM-1, -2 and -3 trials: improved survival with vemurafenib in metastatic melanoma patients with a BRAF(V600E) mutation. Future Oncol. 2012;8:499–507. doi: 10.2217/fon.12.43. [DOI] [PubMed] [Google Scholar]
- 5.Weinstein D, Leininger J, Hamby C, Safai B. Diagnostic and prognostic biomarkers in melanoma. J Clin Aesthet Dermatol. 2014;7:13–24. [PMC free article] [PubMed] [Google Scholar]
- 6.Balch CM, Gershenwald JE, Soong SJ, Thompson JF, Atkins MB, Byrd DR, Buzaid AC, Cochran AJ, Coit DG, Ding S, Eggermont AM, Flaherty KT, et al. Final version of 2009 AJCC melanoma staging and classification. J Clin Oncol. 2009;27:6199–206. doi: 10.1200/JCO.2009.23.4799. [DOI] [PMC free article] [PubMed] [Google Scholar]
- 7.Schramm SJ, Mann GJ. Melanoma prognosis: a REMARK-based systematic review and bioinformatic analysis of immunohistochemical and gene microarray studies. Mol Cancer Ther. 2011;10:1520–8. doi: 10.1158/1535-7163.MCT-10-0901. [DOI] [PubMed] [Google Scholar]
- 8.Rachakonda PS, Hosen I, de Verdier PJ, Fallah M, Heidenreich B, Ryk C, Wiklund NP, Steineck G, Schadendorf D, Hemminki K, Kumar R. TERT promoter mutations in bladder cancer affect patient survival and disease recurrence through modification by a common polymorphism. Proc Natl Acad Sci U S A. 2013;110:17426–31. doi: 10.1073/pnas.1310522110. [DOI] [PMC free article] [PubMed] [Google Scholar]
- 9.Costa BM, Viana-Pereira M, Fernandes R, Costa S, Linhares P, Vaz R, Pinheiro C, Lima J, Soares P, Silva A, Pardal F, Amorim J, et al. Impact of EGFR genetic variants on glioma risk and patient outcome. Cancer Epidemiol Biomarkers Prev. 2011;20:2610–7. doi: 10.1158/1055-9965.EPI-11-0340. [DOI] [PubMed] [Google Scholar]
- 10.Li C, Yin M, Wang LE, Amos CI, Zhu D, Lee JE, Gershenwald JE, Grimm EA, Wei Q. Polymorphisms of nucleotide excision repair genes predict melanoma survival. J Invest Dermatol. 2013;133:1813–21. doi: 10.1038/jid.2012.498. [DOI] [PMC free article] [PubMed] [Google Scholar]
- 11.Edgar BA. From cell structure to transcription: Hippo forges a new path. Cell. 2006;124:267–73. doi: 10.1016/j.cell.2006.01.005. [DOI] [PubMed] [Google Scholar]
- 12.Kim JE, Finlay GJ, Baguley BC. The role of the hippo pathway in melanocytes and melanoma. Front Oncol. 2013;3:123. doi: 10.3389/fonc.2013.00123. [DOI] [PMC free article] [PubMed] [Google Scholar]
- 13.Harvey KF, Zhang X, Thomas DM. The Hippo pathway and human cancer. Nat Rev Cancer. 2013;13:246–57. doi: 10.1038/nrc3458. [DOI] [PubMed] [Google Scholar]
- 14.Dong J, Feldmann G, Huang J, Wu S, Zhang N, Comerford SA, Gayyed MF, Anders RA, Maitra A, Pan D. Elucidation of a universal size-control mechanism in Drosophila and mammals. Cell. 2007;130:1120–33. doi: 10.1016/j.cell.2007.07.019. [DOI] [PMC free article] [PubMed] [Google Scholar]
- 15.Nallet-Staub F, Marsaud V, Li L, Gilbert C, Dodier S, Bataille V, Sudol M, Herlyn M, Mauviel A. Pro-invasive activity of the Hippo pathway effectors YAP and TAZ in cutaneous melanoma. J Invest Dermatol. 2014;134:123–32. doi: 10.1038/jid.2013.319. [DOI] [PMC free article] [PubMed] [Google Scholar]
- 16.Amos CI, Wang LE, Lee JE, Gershenwald JE, Chen WV, Fang S, Kosoy R, Zhang M, Qureshi AA, Vattathil S, Schacherer CW, Gardner JM, et al. Genome-wide association study identifies novel loci predisposing to cutaneous melanoma. Hum Mol Genet. 2011;20:5012–23. doi: 10.1093/hmg/ddr415. [DOI] [PMC free article] [PubMed] [Google Scholar]
- 17.Yin J, Liu H, Liu Z, Wang LE, Chen WV, Zhu D, Amos CI, Fang S, Lee JE, Wei Q. Genetic variants in fanconi anemia pathway genes BRCA2 and FANCA predict melanoma survival. J Invest Dermatol. 2014 doi: 10.1038/jid.2014.416. [DOI] [PMC free article] [PubMed] [Google Scholar]
- 18.Gershenwald JE, Ross MI. Sentinel-lymph-node biopsy for cutaneous melanoma. N Engl J Med. 2011;364:1738–45. doi: 10.1056/NEJMct1002967. [DOI] [PubMed] [Google Scholar]
- 19.Chan SW, Lim CJ, Chen L, Chong YF, Huang C, Song H, Hong W. The Hippo pathway in biological control and cancer development. J Cell Physiol. 2011;226:928–39. doi: 10.1002/jcp.22435. [DOI] [PubMed] [Google Scholar]
- 20.Wacholder S, Chanock S, Garcia-Closas M, El Ghormli L, Rothman N. Assessing the probability that a positive report is false: an approach for molecular epidemiology studies. J Natl Cancer Inst. 2004;96:434–42. doi: 10.1093/jnci/djh075. [DOI] [PMC free article] [PubMed] [Google Scholar]
- 21.Aulchenko YS, Ripke S, Isaacs A, van Duijn CM. GenABEL: an R library for genome-wide association analysis. Bioinformatics. 2007;23:1294–6. doi: 10.1093/bioinformatics/btm108. [DOI] [PubMed] [Google Scholar]
- 22.DeLong ER, DeLong DM, Clarke-Pearson DL. Comparing the areas under two or more correlated receiver operating characteristic curves: a nonparametric approach. Biometrics. 1988;44:837–45. [PubMed] [Google Scholar]
- 23.Holm K, Melum E, Franke A, Karlsen TH. SNPexp - A web tool for calculating and visualizing correlation between HapMap genotypes and gene expression levels. Bmc Bioinformatics. 2010:11. doi: 10.1186/1471-2105-11-600. [DOI] [PMC free article] [PubMed] [Google Scholar]
- 24.Grundberg E, Small KS, Hedman AK, Nica AC, Buil A, Keildson S, Bell JT, Yang TP, Meduri E, Barrett A, Nisbett J, Sekowska M, et al. Mapping cis- and trans-regulatory effects across multiple tissues in twins. Nat Genet. 2012;44:1084–9. doi: 10.1038/ng.2394. [DOI] [PMC free article] [PubMed] [Google Scholar]
- 25.Grundberg E, Meduri E, Sandling JK, Hedman AK, Keildson S, Buil A, Busche S, Yuan W, Nisbet J, Sekowska M, Wilk A, Barrett A, et al. Global analysis of DNA methylation variation in adipose tissue from twins reveals links to disease-associated variants in distal regulatory elements. Am J Hum Genet. 2013;93:876–90. doi: 10.1016/j.ajhg.2013.10.004. [DOI] [PMC free article] [PubMed] [Google Scholar]
- 26.Lamar JM, Stern P, Liu H, Schindler JW, Jiang ZG, Hynes RO. The Hippo pathway target, YAP, promotes metastasis through its TEAD-interaction domain. Proc Natl Acad Sci U S A. 2012;109:E2441–50. doi: 10.1073/pnas.1212021109. [DOI] [PMC free article] [PubMed] [Google Scholar]
- 27.Overholtzer M, Zhang J, Smolen GA, Muir B, Li W, Sgroi DC, Deng CX, Brugge JS, Haber DA. Transforming properties of YAP, a candidate oncogene on the chromosome 11q22 amplicon. Proc Natl Acad Sci U S A. 2006;103:12405–10. doi: 10.1073/pnas.0605579103. [DOI] [PMC free article] [PubMed] [Google Scholar]
- 28.Lin XY, Zhang XP, Wu JH, Qiu XS, Wang EH. Expression of LATS1 contributes to good prognosis and can negatively regulate YAP oncoprotein in non-small-cell lung cancer. Tumour Biol. 2014;35:6435–43. doi: 10.1007/s13277-014-1826-z. [DOI] [PubMed] [Google Scholar]
- 29.Xia Y, Chang T, Wang Y, Liu Y, Li W, Li M, Fan HY. YAP promotes ovarian cancer cell tumorigenesis and is indicative of a poor prognosis for ovarian cancer patients. PloS one. 2014;9:e91770. doi: 10.1371/journal.pone.0091770. [DOI] [PMC free article] [PubMed] [Google Scholar]
- 30.Wu C, Xu BH, Yuan P, Miao XP, Liu Y, Guan Y, Yu DK, Xu JA, Zhang TW, Shen HB, Wu TC, Lin DX. Genome-Wide interrogation identifies YAP1 variants associated with survival of small-cell lung cancer patients. Cancer Res. 2010;70:9721–9. doi: 10.1158/0008-5472.CAN-10-1493. [DOI] [PubMed] [Google Scholar]
- 31.Hu X, Xin Y, Xiao Y, Zhao J. Overexpression of YAP1 is correlated with progression, metastasis and poor prognosis in patients with gastric carcinoma. Pathol Oncol Res. 2014;20:805–11. doi: 10.1007/s12253-014-9757-y. [DOI] [PubMed] [Google Scholar]
- 32.Knight JF, Shepherd CJ, Rizzo S, Brewer D, Jhavar S, Dodson AR, Cooper CS, Eeles R, Falconer A, Kovacs G, Garrett MD, Norman AR, et al. TEAD1 and c-Cbl are novel prostate basal cell markers that correlate with poor clinical outcome in prostate cancer. Br J Cancer. 2008;99:1849–58. doi: 10.1038/sj.bjc.6604774. [DOI] [PMC free article] [PubMed] [Google Scholar]
Associated Data
This section collects any data citations, data availability statements, or supplementary materials included in this article.