Abstract
AIM: To investigate the microRNA (miRNA) expression profile in gastrointestinal stromal tumor (GIST) tissues that could serve as a novel diagnostic biomarker for GIST detection.
METHODS: We performed a quantitative real-time quantitative reverse transcriptase polymerase chain reaction assay to analyze the expression of 1888 miRNAs in a sample set that included 54 GIST tissue samples.
RESULTS: We found that dysregulation of several miRNAs may be related to the malignant potential of GISTs. Six of these miRNAs, hsa-let-7c, miR-218, miR-488#, miR-4683, miR-34c-5p and miR-4773, were selected as the final list of biomarkers to separate the malignant GISTs (M group) from the benign GISTs (B group). In addition, MiR-29b-2#, hsa-let-7c, miR-891b, miR-218, miR-204, miR-204-3p, miR-628-5p, miR-744, miR-29c#, miR-625 and miR-196a were used to distinguish between the borderline (BO group) and M groups. There were 11 common miRNAs selected to separate the benign and borderline (BB) group from the M group, including hsa-let-7c, miR-218, miR-628-5p, miR-204-3p, miR-204, miR-891b, miR-488#, miR-145, miR-891a, miR-34c-5p and miR-196a.
CONCLUSION: The identified miRNAs appear to be novel biomarkers to distinguish malignant from benign GISTs, which may be helpful to understand the mechanisms of GIST oncogenesis and progression, and to further elucidate the characteristics of GIST subtypes.
Keywords: Gastrointestinal stromal tumors, MicroRNAs, Microarray analysis, Real-time polymerase chain reaction, Diagnosis
Core tip: Using high throughput quantitative reverse transcription-polymerase chain reaction microarray, we obtained a panel of miRNAs including hsa-let-7c, miR-218, miR-488#, miR-4683, miR-34c-5p and miR-4773, which can distinguish malignant from benign gastrointestinal stromal tumors (GISTs). Understanding the mechanisms of GIST tumorigenesis and development, may help to further elucidate the characteristics of GIST subtypes.
INTRODUCTION
Gastrointestinal stromal tumors (GISTs) are the most common mesenchymal neoplasms of the gastrointestinal tract. GISTs were commonly misdiagnosed as leiomyomas or leiomyosarcomas until the 1990s when Miettinen et al[1] discovered that the expression of CD34 in the tumor can distinguish GISTs from leiomyomas and leiomyosarcomas. Currently, the diagnoses of GISTs have become more precise through immunohistochemical staining with the discovery of surface markers such as CD117 (positive rate, 95%) and DOG1 (95%).
GISTs are most commonly found in the stomach (60%) and small intestine (25%), while approximately 5% are found in the colon or rectum, and only 2% in the esophagus or other organs[2]. The clinical symptoms of GISTs include abdominal pain, nausea, dysphagia, and chronic gastrointestinal bleeding.
GISTs are a type of oncogenic mutation driven tumors, with common mutations arising in the KIT receptor tyrosine kinase gene (80%-90%) and the platelet-derived growth factor receptor alpha (PDGFRA) gene (5%)[3,4]. Recent research has revealed links to BRAF and SDH mutations[5,6]. GISTs are thought to originate from interstitial cells of Cajal (ICC), therefore, GISTs are found to express KIT and CD34 which are the characteristic features of ICC[7].
GISTs may recur in nearly 50% of patients after complete resection. In fact, half of high-risk GISTs may recur within 2 years of surgery[8]. Most GISTs recur in the liver or peritoneum[9]. The risk of recurrence is based on the following aspects: large tumor size (> 5 cm), high mitotic rate (> 5 mitoses per high power field), tumor location, margins of resection, and rupture of tumor[10]. Some retrospective studies indicated that GISTs located in the stomach have better prognosis than those arising from the small intestinal and rectum.
In the past decade, the search for oncogenes and tumor suppressor genes has focused on microRNAs (miRNAs), which negatively regulate target mRNAs[11]. Dysregulation of miRNAs can influence tumor differentiation, invasion, metastasis and recurrence[12]. Consequently, the development of new therapeutic strategies to target dysregulated tumor-driving miRNAs is vital. Recent investigations have focused on the relationship between miRNAs and GISTs, including studies of miR-494[13], miR-17, miR-20a, and miR-222[14].
The objective of this study was to analyze miRNA expression in different types of GISTs using a quantitative polymerase chain reaction (qPCR) array platform. Identifying and isolating dysregulated miRNAs may contribute to understanding of the mechanisms involved in GIST malignant progression.
MATERIALS AND METHODS
Study design, patients and samples
This study enrolled 54 GIST patients who were seen at Zhongshan Hospital, Fudan University during the period of October 2011 to July 2012. According to our previous study[15,16], the patients were classified into a benign GIST group (B group, n = 9), a borderline GIST group (BO group, n = 14) or a malignant GIST group (M group, n = 31). All samples were collected from consenting individuals according to the protocols approved by Zhongshan Hospital Ethics Committee. Patients were eligible for the study if they were 18 years of age or older and had a pathological diagnosis of GIST following surgical resection that met histological or cytological criteria. Histological typing of the tumors was performed according to the 2012 National Comprehensive Cancer Network (NCCN) Soft Tissue Sarcoma Guideline.
A total of 54 samples were analyzed and classified into 1 of 3 risk levels. Of these, 15 were characterized as low risk, 9 as intermediate risk, and 30 as high. The demographic and clinical features of the patients are summarized in Table 1.
Table 1.
Characteristics of tissue samples
| Characteristic | Benign GISTs (n = 9) | Borderline GISTs (n = 14) | Malignant GISTs (n = 31) |
| Age (yr) | |||
| Median | 68 | 58 | 58 |
| Gender | |||
| Male | 4 | 6 | 19 |
| Female | 5 | 8 | 11 |
| Risk | |||
| Low | 6 | 6 | 3 |
| Intermediate | 3 | 4 | 2 |
| High | 0 | 4 | 26 |
GISTs: Gastrointestinal stromal tumors.
RNA isolation from fresh tissues
Total RNA was isolated from 20 to 30 mg of frozen tissue with the miRNeasy Mini Kit (Qiagen, 217004) according to the manufacturer’s instructions. The quality of the isolated RNA was detected by agarose gel electrophoresis and the quantity was analyzed by an ultraviolet spectrophotometric method using Biomate3 (Thermo).
Total RNA pool making
The total RNA concentration of each sample was diluted to 62.5 ng/μL, and 10 μL of the total RNA from each sample was combined to make the total RNA pool.
First-strand cDNA synthesis
First-strand cDNA was generated from the total RNA sample by reverse transcription (RT) using the Sharpvue™ miRNA First Strand Kit (Biovue, 9000004) following the manufacturer’s protocol. A poly (A) tail was added to the 3’ end of miRNAs, and RT of total RNA to the first-strand cDNA was performed using a universal RT primer. The RT reaction was carried out using a GeneAmp PCR 9700 Thermocycler (Applied Biosystems). The reactions were incubated at 37 °C for 60 min and were inactivated by incubation at 95 °C for 10 min.
Real-time quantitative PCR
Single-tube miRNA assays were used to detect and quantify mature miRNAs by Sharpvue™ 2 × Universal qPCR Master Mix High Rox (Biovue, 9000008) and Sharpvue™ Human miRNA Primer assay (Biovue) under conditions defined by the supplier. The RNA pool was detected using 1920 miRNA primers including 35 controls in five 384-well plates. Each plate contained 3 endogenous controls (hsa-7SL-scRNA, hsa-RNU6B, and hsa-RNU48) in duplicate and one no template control. MiRNA expression levels were quantified using the 7900HT Fast Real-Time PCR System (Applied Biosystems). The reactions were incubated in a 384-well optical plate at 95 °C for 2 min, followed by 3 cycles of 96 °C for 5 s and 60 °C for 1 min, then 37 cycles of 96 °C for 5 s and 60 °C for 30 s.
Statistical analysis
Data analyses were performed using R and Bioconductor packages. For the data obtained by qRT-PCR, raw cycle threshold (Ct) measurements were used for the comparison among the 3 risk levels. To remove differences in the RNA input used to profile the 54 samples analyzed in the study, we used the Quantile-Median method to process the raw Ct measurements. Samples that showed significantly different profiles (mean absolute difference) from all other samples (Bioconductor package “arrayQualityMetrics”) were considered to be outlier samples and were removed from downstream analysis. No sample was removed. Differential expression analysis was performed on the samples using t-test (R package “limma”). MiRNAs producing false discovery rate (FDR) adjusted P-values below 0.01 and fold-changes above 2 were judged as differentially expressed. The predicted probability of being diagnosed with GIST was used as a surrogate marker to construct receiver operating characteristic (ROC) curves. The area-under-the-ROC curve (AUC) was used as an accuracy index for evaluating the diagnostic performance of the selected miRNA panel.
RESULTS
Clinicopathological characteristics
The 54 GIST patients ranged in age from 32 to 78 years (median: 60.2 years). Of these, 30 were cases located in the stomach (55.6%), 8 in the small intestine (14.8%), 4 in the pelvic cavity (7.4%), 4 in the abdominal cavity (7.4%), 2 in the duodenum (3.7%), and 1 case each (1.9% each) in the rectum, colon, and esophagus, respectively. Among these 54 cases, 3 developed hepatic metastases (5.6%). All samples were diagnosed by pathology, and the macroscopic description was available.
Among these GIST samples, 5 were wild-type GISTs (9.3%), 19 had the C-kit exon 11 mutation (35.2%), and 4 had the C-kit exon 17 mutation (7.4%). For the remaining cases, gene mutation status was unknown.
Fifteen cases were defined as low-risk GISTs (27.8%), 9 as intermediate risk (16.7%), and the remaining 30 as high risk (64.8%).
Pathological analyses unveiled 31 cases as malignant GISTs (57.4%), 14 as borderline GISTs (25.9%), and 9 as benign GISTs (16.7%).
MiRNA data testing and analysis
For the data obtained by qRT-PCR, the GIST miRNA functional panel (3 cards including 849 human miRNAs and 2 endogenous controls) was developed by Biovue Technology Ltd based on the miRNA expression results from the GIST tissue pool. The 851 miRNAs had Ct values below the detection threshold of 35 in 54 samples.
Data analysis was performed using the “arrayQualityMetrics” Bioconductor package. This procedure removed 1 tumor tissue sample (GIST-018, malignant) that showed significantly different profiles from the other samples (Figure 1). Thus, 53 tissue samples were analyzed for miRNA expression, including 9 benign GIST tissue samples, 30 malignant GIST tissue samples, and 14 borderline GIST tissue samples.
Figure 1.
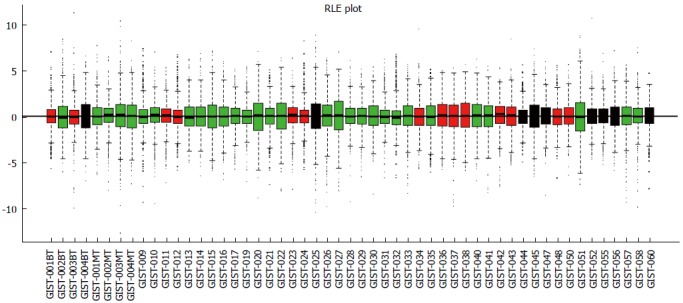
Relative log expression plot (quantile) of normalized data. There were no significantly different profiles between samples. GIST: Gastrointestinal stromal tumor; RLE: Relative log expression.
Differentially expressed miRNAs between different GIST types
The miRNA expression in the 53 tissue samples were compared in 3 group pairs: the B group (9 benign GIST tissue samples) compared with the M group (30 malignant GIST tissue samples); the BO group (14 borderline GIST tissue samples) compared with the M group (30 malignant GIST tissue samples); and the benign and borderline (BB) group (9 benign GIST tissue samples and 14 borderline GIST tissue samples) compared with the M group (30 malignant GIST tissue samples). The hierarchical clustering of the miRNAs was shown by adjusted P-values (FDR) below 0.1 and fold-changes above 2 (red point). Figure 2 shows the comparisons for 4 miRNAs that were differentially expressed in the B group and M groups, while Figure 3 shows the comparisons for 82 miRNAs that were differentially expressed in the BO group and M groups. Figure 4 shows the comparisons for 54 miRNAs that were differentially expressed in the BB group and M groups.
Figure 2.
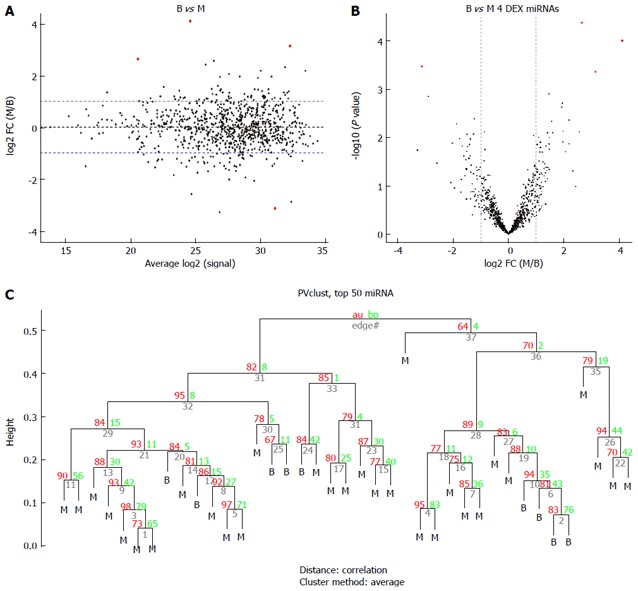
Comparison of the benign gastrointestinal stromal tumors (B group) vs the malignant gastrointestinal stromal tumors (M group). A: MA plot of assays used to profile the compared samples: fold-change (Y-axis) vs normalized Ct measurements; B: Volcano plot of the resulting P values of the t-test between the B and M groups. Four miRNAs show adjusted P values (FDR) below 0.1 and fold-changes above 2 (shown in red); C: Hierarchical clustering of the 9 benign GIST tissues and 30 malignant GIST tissues based on the 50 most variable (top 50) miRNA assays. GIST: Gastrointestinal stromal tumor; FDR: False discovery rate.
Figure 3.
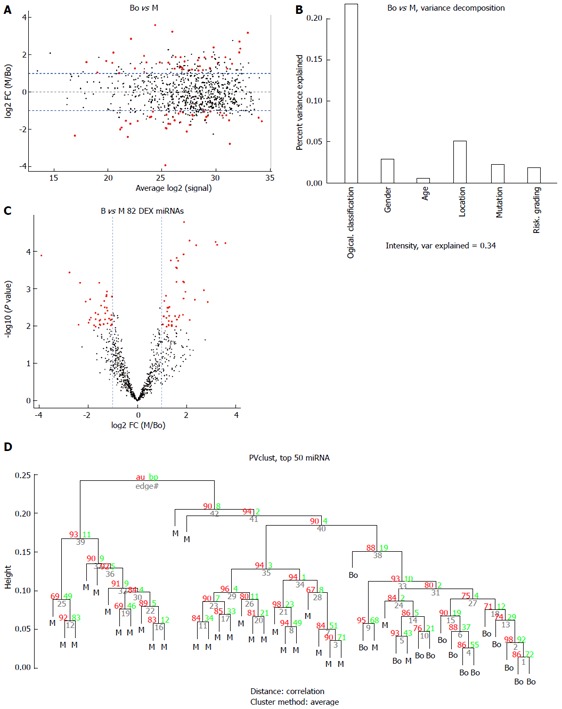
Comparison of the borderline gastrointestinal stromal tumors (borderline group) vs the malignant gastrointestinal stromal tumors (M group). A: MA plot of assays used to profile the compared samples: fold-change (Y-axis) vs normalized Ct measurements; B: 45% of the variance observed in the Ct measurements of the 50 most variable (top 50) miRNA assays across all samples can be attributed to the sample description (BO or M). The remaining covariates considered here (“gender”, “tumor grade”, or “stage”) account for less than 5%; C: Volcano plot of the resulting P-values of the t-test between the Bo and M groups. Eighty-two miRNAs show adjusted P-values (FDR) below 0.1 and fold-changes above 2 (shown in red); D: Hierarchical clustering of the 14 borderline GIST tissues and 30 malignant GIST tissues based on the 50 most variable (top 50) miRNA assays. GIST: Gastrointestinal stromal tumor; FDR: False discovery rate; M: Malignant GIST tissues.
Figure 4.
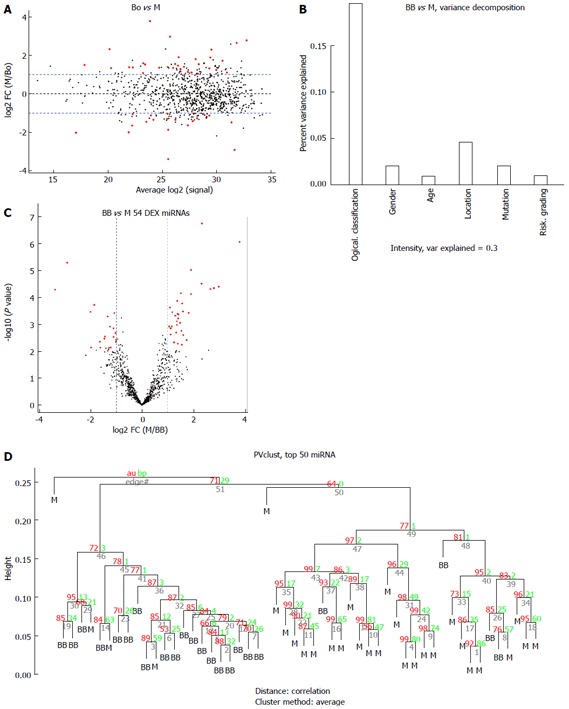
Comparison of the benign or borderline gastrointestinal stromal tumors (benign and borderline group) vs the malignant gastrointestinal stromal tumors (M group). A: MA plot of assays used to profile the compared samples: fold-change (Y-axis) vs normalized Ct measurements; B: Forty-five percent of the variance observed in the Ct measurements of the 50 most variable (top 50) miRNA assays across all samples can be attributed to the sample description (BB or M). The remaining covariates considered here (“gender”, “tumor grade” or “stage”) account for less than 5%; C: Volcano plot of the resulting P-values of the t-test between the Bo and M groups. Fifty-four miRNAs show adjusted P-values (FDR) below 0.1 and fold-changes above 2 (shown in red); D: Hierarchical clustering of the 23 benign or borderline GIST tissues and 30 malignant GIST tissues based on the 50 most variable (top 50) miRNA assays. GIST: Gastrointestinal stromal tumor; FDR: False discovery rate; M: Malignant GIST tissues.
Biomarker selection
To develop a prediction algorithm for malignant GIST diagnosis from a population of samples containing malignant GIST tissue samples (n = 30), borderline GIST tissue samples (n = 14), and benign GIST tissue samples (n = 9). Three classification methods were used: support vector machine (SVM, Bioconductor package “e1071”), K-nearest neighbors (KNN, Bioconductor package “class”), and diagonal linear discriminate analysis (Bioconductor package “sfsmisc”). Algorithm performance was initially evaluated using a leave-one-out cross-validation procedure for different numbers of predictor markers. For each set of training samples, miRNAs were ranked based on their t-test P-values generated when comparing malignant vs normal tissues. The top “n” miRNAs (where n was allowed to range between 2 and 35) were used to build a prediction model based on the training samples, and applied to the remaining test samples. Prediction class and probability were recorded for each sample and classification algorithm. Figure 5A shows that the resulting error rates were relatively stable when 4 predictor markers were used. Due to the limited number of samples available for this study, we chose the common miRNAs from these lists as the final list of predictors (selected markers).
Figure 5.
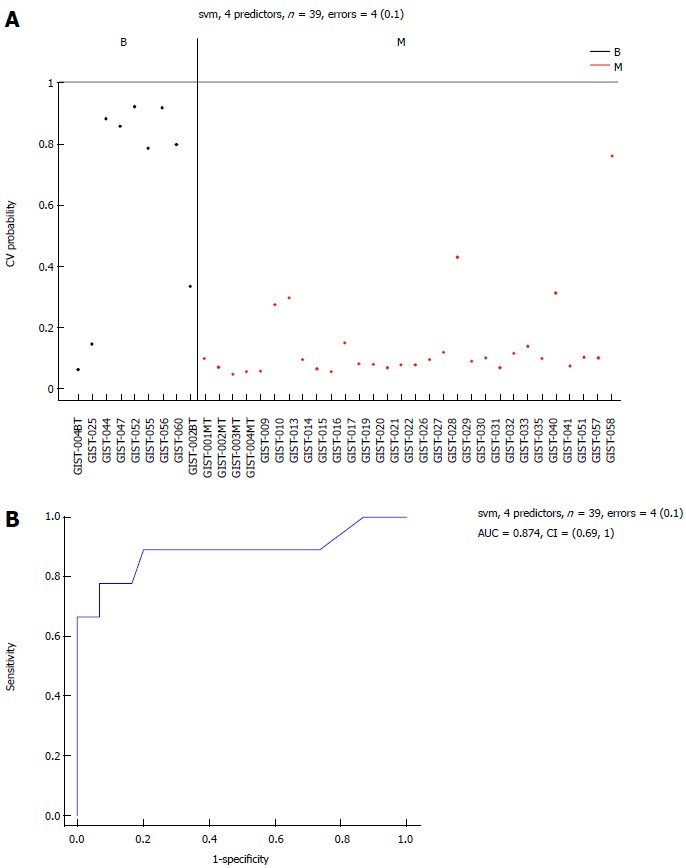
Area-under-the-curve (0.874) estimation for the miRNA panel in the B and M groups. Performance of the 6 selected miRNAs in Table 2 for classification of benign gastrointestinal stromal tumor (GIST) tissues compared with malignant GIST tissues, using a support vector machine (SVM) algorithm and leave-one-out cross-validation procedure. A: Benign GIST tissue prediction probabilities for each sample used in this study: 39 samples with an error = 4 (0.1); B: Receiver operating characteristic (ROC) curve [area-under-the-curve (AUC) = 0.874]. M: Malignant GIST tissues.
Differential miRNAs between the B and M groups
Six common miRNAs were selected as the final list of biomarkers for malignant GIST diagnosis (Table 2). The characteristics of these miRNAs, including fold-changes between malignant and normal tissues, together with t-test P-values and FDR-adjusted P-values, are presented in Table 2. The 4 miRNAs included hsa-let-7c, miR-218, miR-488#, and miR-4683, which had lower expression levels in the M group than in the B group. On the contrary, other miRNAs such as miR-34c-5p and miR-4773 had significantly higher expression levels in the M group.
Table 2.
MicroRNA signatures between the benign gastrointestinal stromal tumors (B group) and the malignant gastrointestinal stromal tumors (M group)
| ID | logFC | AveExpr | t | P value | Adjusted P value |
| hsa-let-7c | 2.645556 | 20.57949 | 4.561671 | 4.20E-05 | 0.035449 |
| MIR-218 | 4.103333 | 24.58974 | 4.293033 | 9.85E-05 | 0.041616 |
| MIR-34C-5P | -3.13333 | 31.12308 | -3.89399 | 0.000339 | 0.091870 |
| MIR-488# | 3.141111 | 32.27179 | 3.811858 | 0.000435 | 0.091870 |
| MIR-4683 | 1.455556 | 29.83077 | 3.452312 | 0.00126 | 0.199198 |
| MIR-4773 | -2.89333 | 32.37436 | -3.41224 | 0.001414 | 0.199198 |
Negative numbers indicate that the fold change is lower in the B group than in the M group. LogFC: Logarithm fold change; Aveexpr: Average expression.
The sensitivity of the selected markers in the detection of malignant GISTs was 97% and the specificity was 67%, with an AUC of 0.874 (Figure 5B). The classification performance of the selected 6 miRNAs for the SVM algorithm, when the leave-one-out cross-validation procedure was used, is presented in Figure 1).
Differential miRNAs between the BO and M groups
Eleven common miRNAs were also selected to separate the BO group from the M group (Table 3), including 29b-2#, hsa-let-7c, miR-891b, miR-218, miR-204, miR-204-3p, miR-628-5p, miR-744, miR-29c# and miR-625, which were overexpressed in the BO group. In contrast, miR-196a had lower expression in the BO group. The predicted probability was used to construct an ROC curve. The AUC was 0.96, with an 87% sensitivity and a 93% specificity (Figure 6).
Table 3.
MiRNA signatures between the borderline gastrointestinal stromal tumors (borderline group) and malignant gastrointestinal stromal tumors (M group)
| ID | logFC | AveExpr | t | P value | Adjusted P value | B |
| MIR-29B-2# | 1.887619 | 26.27273 | 4.791486 | 1.67E-05 | 0.009785 | 2.889621 |
| hsa-let-7c | 2.118571 | 20.51591 | 4.449458 | 5.20E-05 | 0.009785 | 1.850695 |
| MIR-891b | 3.170952 | 32.94773 | 4.420680 | 5.71E-05 | 0.009785 | 1.764525 |
| MIR-218 | 3.579524 | 24.39773 | 4.399150 | 6.13E-05 | 0.009785 | 1.700197 |
| MIR-204 | 3.238095 | 25.98636 | 4.368453 | 6.78E-05 | 0.009785 | 1.608688 |
| MIR-204-3P | 2.390000 | 29.77955 | 4.360826 | 6.95E-05 | 0.009785 | 1.585990 |
| MIR-628-5P | 1.875238 | 26.75000 | 4.185139 | 0.000123 | 0.013800 | 1.067600 |
| MIR-196a | -3.906670 | 25.33636 | -4.165320 | 0.000131 | 0.013800 | 1.009689 |
| MIR-744 | 1.590476 | 24.82727 | 4.120092 | 0.000151 | 0.013983 | 0.877951 |
| MIR-29C# | 1.350476 | 26.76364 | 4.070312 | 0.000177 | 0.013983 | 0.733696 |
| MIR-625 | 1.648095 | 27.10227 | 4.061304 | 0.000182 | 0.013983 | 0.707679 |
Negative numbers indicate that the fold change is lower in the borderline group than in the M group. LogFC: Logarithm fold change; AveExpr: Average expression.
Figure 6.
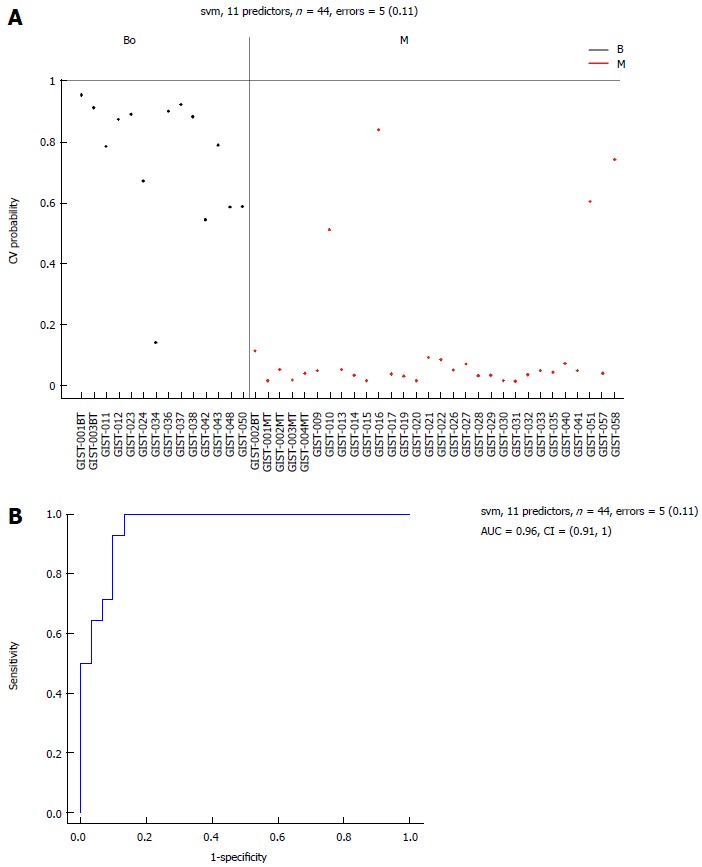
Area-under-the-curve (0.96) estimation for the miRNA panel in the borderline and M groups. Performance of the 11 selected miRNAs for classification of borderline gastrointestinal stromal tumor tissues compared with malignant gastrointestinal stromal tumor tissues. A: Support vector machine (SVM) prediction probability for 44 samples with an error = 5 (0.11); B: Area-under-the-curve (AUC = 0.96) estimation for the miRNA panel in the borderline gastrointestinal stromal tumor (GIST) tissues and the malignant GIST tissues. M: Malignant GIST tissues.
Differential miRNAs between the BB and M groups
There were 11 common miRNAs selected to separate the BB group from the M group, including hsa-let-7c, miR-218, miR-628-5p, miR-204-3p, miR-204, miR-891b, miR-488#, miR-145 and miR-891a, which were overexpressed in the BB group (Table 4). In contrast, miR-34c-5p and miR-196a had lower expression in the BB group. The predicted probability was used to construct an ROC curve. The AUC was 0.906, with an 87% sensitivity and an 82% specificity (Figure 7).
Table 4.
miRNA signatures between the benign gastrointestinal stromal tumors or borderline gastrointestinal stromal tumors (benign and borderline group) and the malignant gastrointestinal stromal tumors (M group)
| ID | logFC | AveExpr | t | P value | Adjusted P value | B |
| hsa-let-7c | 2.324783 | 20.18113 | 5.938844 | 1.86E-07 | 0.000157 | 7.046674 |
| MIR-218 | 3.784493 | 23.89434 | 5.519007 | 8.86E-07 | 0.000375 | 5.587287 |
| MIR-34C-5P | -2.908700 | 31.66226 | -5.032010 | 5.24E-06 | 0.001477 | 3.931173 |
| MIR-628-5P | 1.903188 | 26.52075 | 4.863745 | 9.58E-06 | 0.002023 | 3.370903 |
| MIR-204-3P | 2.309565 | 29.53774 | 4.525668 | 3.14E-05 | 0.004925 | 2.268094 |
| MIR-204 | 2.973188 | 25.72642 | 4.455823 | 4.00E-05 | 0.004925 | 2.044513 |
| MIR-891b | 2.787101 | 32.74717 | 4.417100 | 4.57E-05 | 0.004925 | 1.921237 |
| MIR-488# | 2.648841 | 31.84717 | 4.392406 | 4.98E-05 | 0.004925 | 1.842883 |
| MIR-196a | -3.389280 | 25.56415 | -4.376970 | 5.25E-05 | 0.004925 | 1.794012 |
| MIR-145 | 1.505217 | 17.88679 | 4.290314 | 7.05E-05 | 0.005869 | 1.521146 |
| MIR-891a | 1.900870 | 29.41509 | 4.266462 | 7.64E-05 | 0.005869 | 1.446506 |
Negative numbers indicate that the fold change is lower in the BB group than in the M group. LogFC: Logarithm fold change; AveExpr: Average expression.
Figure 7.
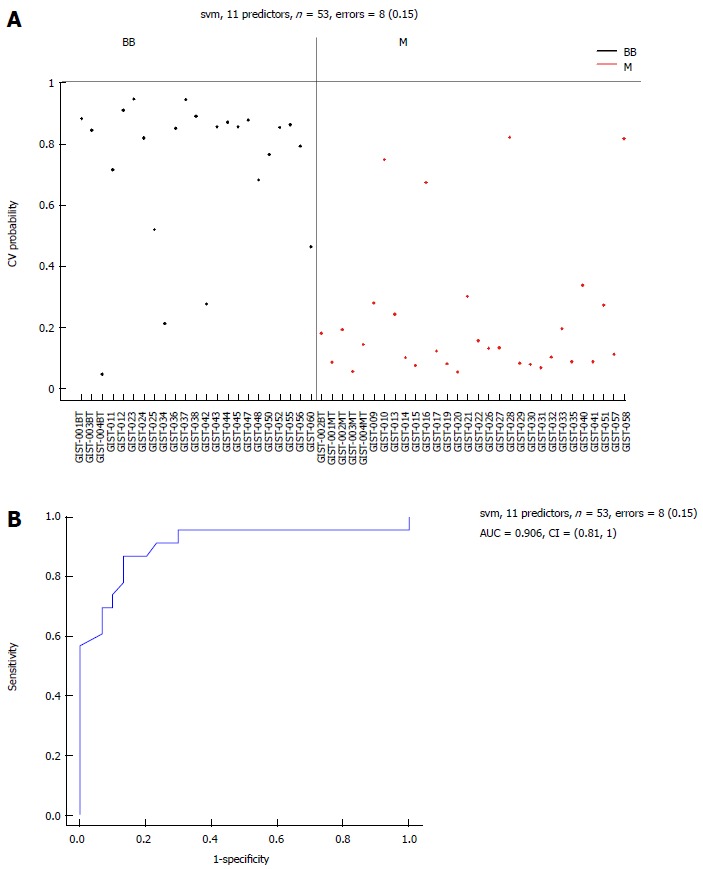
Area-under-the-curve (0.906) estimation for the miRNA panel in the benign or borderline gastrointestinal stromal tumor tissues and M groups. Eleven selected miRNAs comparing the BB and M groups. A: Support vector machine (SVM) prediction probability for 53 samples with an error = 8 (0.15); B: Area-under-the-curve (AUC = 0.906) estimation for the miRNA panel in the BB and M groups. BB: Benign or borderline GIST tissues; M: Malignant GIST tissues; GIST: Gastrointestinal stromal tumor.
DISCUSSION
By comparing benign, borderline, and malignant GISTs, we found that the dysregulation of several miRNAs was related to the malignant potential of GISTs. An expression signature of 6 miRNAs was selected to separate malignant GISTs from benign GISTs. Of these, 4 miRNAs (hsa-let-7c, miR-218, miR-488#, and miR-4683) were down-regulated in malignant GISTs, and 2 miRNAs (miR-34c-5p and miR-4773) were up-regulated in malignant GISTs. An expression signature of 11 miRNAs (miR-29b-2#, hsa-let-7c, miR-891b, miR-218, miR-204, miR-204-3p, miR-628-5p, miR-744, miR-29c#, miR-625 and miR-196a) was selected to separate borderline GISTs from malignant GISTs. An expression signature of 11 miRNAs (hsa-let-7c, miR-218, miR-628-5p, miR-204-3p, miR-204, miR-891b, miR-488#, miR-145, miR-891a, miR-34c-5p and miR-196a) was selected to separate benign GISTs and borderline GISTs from malignant GISTs.
In these 3 comparisons, let-7c and miR-218 were down-regulated in malignant GISTs. The down-expression of let-7 family genes has been reported in many cancers. For example, a low level of let-7c expression was observed in human non-small cell lung cancer, and down-regulation of let-7c could inhibit the tumor migration and investigation by targeting ITGB3 and MAP4K3[17]. TRIB2 was a target and was negatively regulated by let-7. As the expression of let-7 increased, the downstream effectors of TRIB2 was increased, and the activities of C/EBP-α and phosphorylated p38MAPK were also increased. TRIB2, C/EBP-α and phosphorylated p38MAPK were related to cell proliferation[18]. Other studies showed that let-7c inhibited cell proliferation by targeting other genes such as HOXA1[19]. Furthermore, a study performed by Brennan et al[20] concluded that let-7 targets several members of the TGF-β1 signaling pathway.
As a well-known homeodomain protein, PBX2 was identified as a novel let-7c target that may contribute to the AML phenotype[21]. In colorectal cancer, let-7c can suppress metastasis by targeting MMP1 and PBX3[22].
Let-7c overexpression enhanced apoptosis in endothelial cells[23]. In esophageal squamous cell carcinoma, the expression of let-7c is a significant factor of response to chemotherapy by regulation of the IL-6/STAT3 pathway[24]. Taken together, most of these studies suggest that downregulation of let-7c was related to tumor metastasis and cell differentiation, and all of these studies imply that let-7c may be related to GIST immigration and invasion.
The expression of miR-218 was previously found to be reduced in many cancers. For example, the upregulation of miR-218 was found to reduce the migration and invasion of glioma cells, while the suppression of miR-218 is able to increase the invasive ability of the cells[25]. In oral squamous cell carcinoma, miR-218 was found to target the gene Rictor, and through its regulation of the expression of Rictor, miR-218 is able to activate the TOR-Akt pathway[26]. A recent study found that the expression of miR-218 decreases in human GIST tissue and cell lines, and miR-218 can negatively regulate the expression of KIT protein and inhibit the proliferation and invasion of GIST cells[27].
For those miRNAs found to be upregulated in malignant GISTs, miR-34c and miR196a seem to be most important. miR-34c was revealed as a tumor suppressor in prostate cancer by targeting MET, a receptor tyrosine kinase activated by hepatocyte growth factor, which is crucial for metastatic progression[28]. In osteosarcoma, miR-43c controls cell proliferation by influencing the p53-miR-34c-RUNX2 network[29]. Yang et al[30] found that miR-34a/c is lowly expressed in metastatic breast cancer cells and human primary breast tumors with lymph node metastases and overexpressing miR-34c can also inhibit cancer cell migration and invasion. In uveal melanoma, miR-34c suppressed cell proliferation via the cell cycle proteins CDK4, CDK6, and Rb[31]. A study revealed that miR-34c downregulates the expression of ULBP2, and diminishes tumor cell recognition by NK cells[32]. In our study, miR-34c was overexpressed in malignant GISTs, which may indicate a role in tumorigenesis and tumor progression.
MiR-196a is also an important miRNA that is related to tumor progression. A positive correlation has been found with miR-196a expression and the progression from intestinal metaplasia to adenocarcinoma[33]. Some researchers found that the overexpression of miR-196a was associated with high-risk grade, metastasis and poor survival, and implied that the genes HOXC and HOTAIR may be miR-196a target genes[7]. In that study, the authors revealed that miR-196a upregulated in gastric cancer tissues and cell lines was related to tumor size, poor pT stage, pN stage and survival time. Downregulation of miR-196a can suppress cancer cell proliferation. Dysregulation of miR-196a has also been found in other cancers such as breast cancer and pancreatic adenocarcinoma[34].
Recently, some studies indicated that deregulation of miRNAs had close relation to imatinimb resistance in GISTs. Akçakaya et al[35] found that miR-125a-5p is overexpressed in imatinib resistant GISTs, and could down-regulate PTPN18 to induce imatinib resistance in GISTs. A study showed that low expression of miR-320a was correlated with short time to imatinib resistance, and proposed the potential mechanism of miR-320a for imatinib resistance[36]. These studies mean that miRNAs may have potential to be targets for imatinib resistance in GISTs.
Although these specific miRNAs were isolated in our assays, further studies need to be performed to confirm the veracity of our results. For example, validation of these results in a study with a larger sample size would provide a more clear understanding and interpretation of these preliminary data.
In conclusion, through the utilization of real-time quantitative RT-PCR-based miRNA assays to analyze the expression of 1888 miRNAs in GIST samples, 3 expression signatures of miRNAs were selected to diagnose malignant GISTs. The dysregulation of these miRNAs may be related to the malignance of GISTs, and therefore serves as a valuable target to further study the mechanisms of malignant GIST development.
COMMENTS
Background
Gastrointestinal stromal tumor is the most common mesenchymal neoplasia in the gastrointestinal tract and has a broad spectrum of pathological patterns and clinical features ranging from benign to malignant. Advances in high-throughput technologies such as high-throughput real-time quantitative reverse transcriptase polymerase chain reaction (RT-qPCR) microarray for gene expression profiling have reinforced the identification of molecular characteristics of tumors. Screening and testing for the role of miRNAs in distinguishing malignant gastrointestinal stromal tumor (GIST) from benign GISTs is of great clinical value.
Research frontiers
MicroRNAs have an important role in the pathogenesis of various human cancers by regulating the expression of target genes post-transcriptionally. High-throughput RT-qPCR microarray combined with clinical statistical analysis enabled the identification of biomarkers in hundreds of microRNAs.
Innovations and breakthroughs
A panel of miRNAs, including hsa-let-7c, miR-218, miR-488#, miR-4683, miR-34c-5p and miR-4773, as biomarkers, are able to separate the malignant GISTs from the benign GISTs. These may contribute to a better understanding of the mechanisms involved in GIST oncogenesis and progression, and further elucidation of the characteristics of GIST subtypes.
Applications
The use of high-throughput RT-qPCR microarray to evaluate the expression profile of microRNAs in tumor tissues will contribute to the characterization of cancer heterogeneity in order to potentially develop personalized therapy for patients.
Terminology
A microarray is a multiplex lab-on-a-chip that assays large amounts of biological material using high-throughput screening methods. The types of microarrays include DNA microarray, microRNA microarray, protein microarray, and tissue microarray. High-throughput RT-qPCR is a current technique widely used in studying expression patterns of genes.
Peer-review
This study aims at identifying an miRNA expression profile in GIST tissues to be used as a novel diagnostic biomarker and as the basis for investigation of novel target therapies. Although the cohort is not large, the authors were able to separate the M, B, and BB groups based on their deregulated expression profile. The methods are accurate and the results are convincing.
Footnotes
Supported by Grants from the Ministry of Health of the China, No. W2012RQ02; Shanghai Science and Technology Committee, No. 12nm0501402; and Shanghai Education Committee, No. 120311.
Open-Access: This article is an open-access article which was selected by an in-house editor and fully peer-reviewed by external reviewers. It is distributed in accordance with the Creative Commons Attribution Non Commercial (CC BY-NC 4.0) license, which permits others to distribute, remix, adapt, build upon this work non-commercially, and license their derivative works on different terms, provided the original work is properly cited and the use is non-commercial. See: http://creativecommons.org/licenses/by-nc/4.0/
Peer-review started: July 8, 2014
First decision: August 12, 2014
Article in press: December 1, 2014
P- Reviewer: Bakoyiannis A, Ghiorzo P S- Editor: Ma YJ L- Editor: Wang TQ E- Editor: Zhang DN
References
- 1.Miettinen M, Virolainen M. Gastrointestinal stromal tumors--value of CD34 antigen in their identification and separation from true leiomyomas and schwannomas. Am J Surg Pathol. 1995;19:207–216. doi: 10.1097/00000478-199502000-00009. [DOI] [PubMed] [Google Scholar]
- 2.Corless CL, Fletcher JA, Heinrich MC. Biology of gastrointestinal stromal tumors. J Clin Oncol. 2004;22:3813–3825. doi: 10.1200/JCO.2004.05.140. [DOI] [PubMed] [Google Scholar]
- 3.Hirota S, Isozaki K, Moriyama Y, Hashimoto K, Nishida T, Ishiguro S, Kawano K, Hanada M, Kurata A, Takeda M, et al. Gain-of-function mutations of c-kit in human gastrointestinal stromal tumors. Science. 1998;279:577–580. doi: 10.1126/science.279.5350.577. [DOI] [PubMed] [Google Scholar]
- 4.Heinrich MC, Corless CL, Duensing A, McGreevey L, Chen CJ, Joseph N, Singer S, Griffith DJ, Haley A, Town A, et al. PDGFRA activating mutations in gastrointestinal stromal tumors. Science. 2003;299:708–710. doi: 10.1126/science.1079666. [DOI] [PubMed] [Google Scholar]
- 5.Agaimy A, Terracciano LM, Dirnhofer S, Tornillo L, Foerster A, Hartmann A, Bihl MP. V600E BRAF mutations are alternative early molecular events in a subset of KIT/PDGFRA wild-type gastrointestinal stromal tumours. J Clin Pathol. 2009;62:613–616. doi: 10.1136/jcp.2009.064550. [DOI] [PubMed] [Google Scholar]
- 6.Hostein I, Faur N, Primois C, Boury F, Denard J, Emile JF, Bringuier PP, Scoazec JY, Coindre JM. BRAF mutation status in gastrointestinal stromal tumors. Am J Clin Pathol. 2010;133:141–148. doi: 10.1309/AJCPPCKGA2QGBJ1R. [DOI] [PubMed] [Google Scholar]
- 7.Niinuma T, Suzuki H, Nojima M, Nosho K, Yamamoto H, Takamaru H, Yamamoto E, Maruyama R, Nobuoka T, Miyazaki Y, et al. Upregulation of miR-196a and HOTAIR drive malignant character in gastrointestinal stromal tumors. Cancer Res. 2012;72:1126–1136. doi: 10.1158/0008-5472.CAN-11-1803. [DOI] [PubMed] [Google Scholar]
- 8.Reichardt P, Joensuu H, Blay JY. New fronts in the adjuvant treatment of GIST. Cancer Chemother Pharmacol. 2013;72:715–723. doi: 10.1007/s00280-013-2248-0. [DOI] [PubMed] [Google Scholar]
- 9.Gold JS, Gönen M, Gutiérrez A, Broto JM, García-del-Muro X, Smyrk TC, Maki RG, Singer S, Brennan MF, Antonescu CR, et al. Development and validation of a prognostic nomogram for recurrence-free survival after complete surgical resection of localised primary gastrointestinal stromal tumour: a retrospective analysis. Lancet Oncol. 2009;10:1045–1052. doi: 10.1016/S1470-2045(09)70242-6. [DOI] [PMC free article] [PubMed] [Google Scholar]
- 10.Bareck E, Ba-Ssalamah A, Brodowicz T, Eisterer W, Häfner M, Högenauer C, Kastner U, Kühr T, Längle F, Liegl-Atzwanger B, et al. Gastrointestinal stromal tumors: diagnosis, therapy and follow-up care in Austria. Wien Med Wochenschr. 2013;163:137–152. doi: 10.1007/s10354-013-0187-3. [DOI] [PubMed] [Google Scholar]
- 11.Hwang HW, Mendell JT. MicroRNAs in cell proliferation, cell death, and tumorigenesis. Br J Cancer. 2006;94:776–780. doi: 10.1038/sj.bjc.6603023. [DOI] [PMC free article] [PubMed] [Google Scholar]
- 12.Esquela-Kerscher A, Slack FJ. Oncomirs - microRNAs with a role in cancer. Nat Rev Cancer. 2006;6:259–269. doi: 10.1038/nrc1840. [DOI] [PubMed] [Google Scholar]
- 13.Kim WK, Park M, Kim YK, Tae YK, Yang HK, Lee JM, Kim H. MicroRNA-494 downregulates KIT and inhibits gastrointestinal stromal tumor cell proliferation. Clin Cancer Res. 2011;17:7584–7594. doi: 10.1158/1078-0432.CCR-11-0166. [DOI] [PubMed] [Google Scholar]
- 14.Gits CM, van Kuijk PF, Jonkers MB, Boersma AW, van Ijcken WF, Wozniak A, Sciot R, Rutkowski P, Schöffski P, Taguchi T, et al. MiR-17-92 and miR-221/222 cluster members target KIT and ETV1 in human gastrointestinal stromal tumours. Br J Cancer. 2013;109:1625–1635. doi: 10.1038/bjc.2013.483. [DOI] [PMC free article] [PubMed] [Google Scholar]
- 15.Hou YY, Lu SH, Zhou Y, Qi WD, Shi Y, Tan YS, Zhu XZ. Stage and histological grade of gastrointestinal stromal tumors based on a new approach are strongly associated with clinical behaviors. Mod Pathol. 2009;22:556–569. doi: 10.1038/modpathol.2009.11. [DOI] [PubMed] [Google Scholar]
- 16.Shi Y, Hou YY, Lu SH, Zhou Y, Xu JF, Ji Y, Hou J, Xu C, Liu YL, Tan YS, et al. Clinical and pathological studies of borderline gastrointestinal stromal tumors. Chin Med J (Engl) 2010;123:2514–2520. [PubMed] [Google Scholar]
- 17.Zhao B, Han H, Chen J, Zhang Z, Li S, Fang F, Zheng Q, Ma Y, Zhang J, Wu N, et al. MicroRNA let-7c inhibits migration and invasion of human non-small cell lung cancer by targeting ITGB3 and MAP4K3. Cancer Lett. 2014;342:43–51. doi: 10.1016/j.canlet.2013.08.030. [DOI] [PubMed] [Google Scholar]
- 18.Wang PY, Sun YX, Zhang S, Pang M, Zhang HH, Gao SY, Zhang C, Lv CJ, Xie SY. Let-7c inhibits A549 cell proliferation through oncogenic TRIB2 related factors. FEBS Lett. 2013;587:2675–2681. doi: 10.1016/j.febslet.2013.07.004. [DOI] [PubMed] [Google Scholar]
- 19.Zhan M, Qu Q, Wang G, Liu YZ, Tan SL, Lou XY, Yu J, Zhou HH. Let-7c inhibits NSCLC cell proliferation by targeting HOXA1. Asian Pac J Cancer Prev. 2013;14:387–392. doi: 10.7314/apjcp.2013.14.1.387. [DOI] [PubMed] [Google Scholar]
- 20.Brennan EP, Nolan KA, Börgeson E, Gough OS, McEvoy CM, Docherty NG, Higgins DF, Murphy M, Sadlier DM, Ali-Shah ST, et al. Lipoxins attenuate renal fibrosis by inducing let-7c and suppressing TGFβR1. J Am Soc Nephrol. 2013;24:627–637. doi: 10.1681/ASN.2012060550. [DOI] [PMC free article] [PubMed] [Google Scholar]
- 21.Pelosi A, Careccia S, Lulli V, Romania P, Marziali G, Testa U, Lavorgna S, Lo-Coco F, Petti MC, Calabretta B, et al. miRNA let-7c promotes granulocytic differentiation in acute myeloid leukemia. Oncogene. 2013;32:3648–3654. doi: 10.1038/onc.2012.398. [DOI] [PMC free article] [PubMed] [Google Scholar]
- 22.Han HB, Gu J, Zuo HJ, Chen ZG, Zhao W, Li M, Ji DB, Lu YY, Zhang ZQ. Let-7c functions as a metastasis suppressor by targeting MMP11 and PBX3 in colorectal cancer. J Pathol. 2012;226:544–555. doi: 10.1002/path.3014. [DOI] [PubMed] [Google Scholar]
- 23.Qin B, Xiao B, Liang D, Li Y, Jiang T, Yang H. MicroRNA let-7c inhibits Bcl-xl expression and regulates ox-LDL-induced endothelial apoptosis. BMB Rep. 2012;45:464–469. doi: 10.5483/BMBRep.2012.45.8.033. [DOI] [PubMed] [Google Scholar]
- 24.Sugimura K, Miyata H, Tanaka K, Hamano R, Takahashi T, Kurokawa Y, Yamasaki M, Nakajima K, Takiguchi S, Mori M, et al. Let-7 expression is a significant determinant of response to chemotherapy through the regulation of IL-6/STAT3 pathway in esophageal squamous cell carcinoma. Clin Cancer Res. 2012;18:5144–5153. doi: 10.1158/1078-0432.CCR-12-0701. [DOI] [PubMed] [Google Scholar]
- 25.Song L, Huang Q, Chen K, Liu L, Lin C, Dai T, Yu C, Wu Z, Li J. miR-218 inhibits the invasive ability of glioma cells by direct downregulation of IKK-β. Biochem Biophys Res Commun. 2010;402:135–140. doi: 10.1016/j.bbrc.2010.10.003. [DOI] [PubMed] [Google Scholar]
- 26.Uesugi A, Kozaki K, Tsuruta T, Furuta M, Morita K, Imoto I, Omura K, Inazawa J. The tumor suppressive microRNA miR-218 targets the mTOR component Rictor and inhibits AKT phosphorylation in oral cancer. Cancer Res. 2011;71:5765–5778. doi: 10.1158/0008-5472.CAN-11-0368. [DOI] [PubMed] [Google Scholar]
- 27.Fan R, Zhong J, Zheng S, Wang Z, Xu Y, Li S, Zhou J, Yuan F. MicroRNA-218 inhibits gastrointestinal stromal tumor cell and invasion by targeting KIT. Tumour Biol. 2014;35:4209–4217. doi: 10.1007/s13277-013-1551-z. [DOI] [PubMed] [Google Scholar]
- 28.Hagman Z, Haflidadottir BS, Ansari M, Persson M, Bjartell A, Edsjö A, Ceder Y. The tumour suppressor miR-34c targets MET in prostate cancer cells. Br J Cancer. 2013;109:1271–1278. doi: 10.1038/bjc.2013.449. [DOI] [PMC free article] [PubMed] [Google Scholar]
- 29.van der Deen M, Taipaleenmäki H, Zhang Y, Teplyuk NM, Gupta A, Cinghu S, Shogren K, Maran A, Yaszemski MJ, Ling L, et al. MicroRNA-34c inversely couples the biological functions of the runt-related transcription factor RUNX2 and the tumor suppressor p53 in osteosarcoma. J Biol Chem. 2013;288:21307–21319. doi: 10.1074/jbc.M112.445890. [DOI] [PMC free article] [PubMed] [Google Scholar]
- 30.Yang S, Li Y, Gao J, Zhang T, Li S, Luo A, Chen H, Ding F, Wang X, Liu Z. MicroRNA-34 suppresses breast cancer invasion and metastasis by directly targeting Fra-1. Oncogene. 2013;32:4294–4303. doi: 10.1038/onc.2012.432. [DOI] [PubMed] [Google Scholar]
- 31.Dong F, Lou D. MicroRNA-34b/c suppresses uveal melanoma cell proliferation and migration through multiple targets. Mol Vis. 2012;18:537–546. [PMC free article] [PubMed] [Google Scholar]
- 32.Heinemann A, Zhao F, Pechlivanis S, Eberle J, Steinle A, Diederichs S, Schadendorf D, Paschen A. Tumor suppressive microRNAs miR-34a/c control cancer cell expression of ULBP2, a stress-induced ligand of the natural killer cell receptor NKG2D. Cancer Res. 2012;72:460–471. doi: 10.1158/0008-5472.CAN-11-1977. [DOI] [PubMed] [Google Scholar]
- 33.Luzna P, Gregar J, Uberall I, Radova L, Prochazka V, Ehrmann J. Changes of microRNAs-192, 196a and 203 correlate with Barrett’s esophagus diagnosis and its progression compared to normal healthy individuals. Diagn Pathol. 2011;6:114. doi: 10.1186/1746-1596-6-114. [DOI] [PMC free article] [PubMed] [Google Scholar]
- 34.Chen C, Zhang Y, Zhang L, Weakley SM, Yao Q. MicroRNA-196: critical roles and clinical applications in development and cancer. J Cell Mol Med. 2011;15:14–23. doi: 10.1111/j.1582-4934.2010.01219.x. [DOI] [PMC free article] [PubMed] [Google Scholar]
- 35.Akçakaya P, Caramuta S, Åhlen J, Ghaderi M, Berglund E, Östman A, Bränström R, Larsson C, Lui WO. microRNA expression signatures of gastrointestinal stromal tumours: associations with imatinib resistance and patient outcome. Br J Cancer. 2014;111:2091–2102. doi: 10.1038/bjc.2014.548. [DOI] [PMC free article] [PubMed] [Google Scholar]
- 36.Gao X, Shen K, Wang C, Ling J, Wang H, Fang Y, Shi Y, Hou Y, Qin J, Sun Y, et al. MiR-320a downregulation is associated with imatinib resistance in gastrointestinal stromal tumors. Acta Biochim Biophys Sin (Shanghai) 2014;46:72–75. doi: 10.1093/abbs/gmt118. [DOI] [PubMed] [Google Scholar]


