Abstract
AIM: To investigate the effect of microRNA-1 (miR-1) on tumor endothelial cells (TECs) of human hepatocellular carcinoma (HCC).
METHODS: MiR-1 specific short hairpin RNA (shRNA) was synthesized and cloned into a recombinant lentiviral vector. TECs were then infected by the miRNA-1-shRNA recombinant lentivirus. TECs were divided into three groups: a control (CON) group consisting of normal TECs without lentiviral infection, a negative control (NC) group consisting of normal TECs infected with a negative control virus, and a micro-down (MD) group consisting of normal TECs infected with the miR-1-inhibition virus containing the target gene. Silencing of miR-1 expression was quantified via quantitative reverse transcription-polymerase chain reaction (qRT-PCR). The proliferation of TECs was detected using MTT (Thiazolyl Blue Tetrazolium Bromide) assay; the observations were continued for 5 d, and the optical density value at 490 nm was detected every day. Apoptosis was detected via flow cytometry using Annexin V-APC single staining. The migration and invasion of TECs were detected using transwell assays.
RESULTS: Lentiviral miR-1 shRNA was successfully transduced into TECs, and specifically silenced the expression of miR-1. The results of qRT-PCR showed that the expression of miR-1 was significantly decreased in the MD group (2-ΔΔCt = 0.57 ± 0.14) compared with the CON group (2-ΔΔCt = 1) and the NC group (2-ΔΔCt = 1.05 ± 0.13) (P < 0.01). The results of MTT assay showed that the cell proliferation was all significantly inhibited in the MD group in the 5 days compared with the CON and NC groups (P < 0.01). The results of flow cytometry showed that the apoptosis was significantly increased in the MD group (6.32% ± 0.33%) compared with the CON group (2.03% ± 0.30%) and the NC group (2.18% ± 0.15%) (P < 0.01). The ability of cell migration was significantly inhibited in the MD group (62.0 ± 5.48) compared with the CON group (99.8 ± 3.11) and the NC group (97.2 ± 3.70) (P < 0.01). The ability of invasion of TECs was also significantly inhibited in the MD group (29.8 ± 2.39) compared with the CON group (44.6 ± 3.36) and the NC group (44.4 ± 5.17) (P < 0.01).
CONCLUSION: MiR-1 might be a potential tumor activator. Inhibiting its expression could decrease proliferation, induce apoptosis, and inhibit the migration and invasion of TECs of human HCC.
Keywords: Tumor endothelial cells, Hepatocellular carcinoma, Short hairpin RNA, MicroRNA-1
Core tip: Our study demonstrated that microRNA-1 (miR-1) might be a potential tumor activator. Inhibition of the expression of miR-1 could decrease the proliferation, induce the apoptosis, and inhibit the migration and invasion of tumor endothelial cells of human hepatocellular carcinoma.
INTRODUCTION
Currently, primary liver cancer, which consists predominantly of hepatocellular carcinoma (HCC), is the fifth most prevalent cancer worldwide, the second most frequent cause of cancer death in men, the seventh most commonly diagnosed cancer and the sixth leading cause of cancer death in women[1]. The only treatment that offers a potential for curing patients with HCC is surgical resection or liver transplantation. However, only a small number of patients can receive surgical treatment due to the limitations such as the stage of the carcinoma, the number and the size of the nodules, and the liver function. Furthermore, no effective treatment is presently established once surgical treatment cannot be performed, especially for advanced HCC patients[2]. Therefore, identifying novel therapeutic targets for the treatment of HCC is urgently required.
Recent evidence highlighted that tumor microenvironment plays an important role in the initiation, progression and metastasis of cancer[3]. Cancer is an ensemble production in which tumor cells act as the leading villains and the tumor stroma, blood vessels, infiltrating inflammatory cells and a variety of associated tissue cells in tumor microenvironment play the role of supporting player to aid the malignant progression of cancer[4]. The nontumor cells in the tumor microenvironment can be modified by the cancer cells to produce a variety of growth factors, chemokines, and matrix-degrading enzymes that enhance the proliferation and invasion of the tumor. Recent experiments have suggested various approaches to target different cell types in the tumor microenvironment such as the tumor stroma[5], tumor vasculature[6] and immune cells[7]. Therefore, an increasing number of experts believe that the treatment strategy for cancer targeting to the tumor microenvironment may produce unexpected effects.
HCC is a solid cancer with a rich blood supply. Angiogenesis is crucial in the occurrence, development and prognosis of this cancer. Its growth, invasion and metastasis are all closely associated with angiogenesis. Therefore, regulation of tumor angiogenesis can control tumor growth[8]. During the development of the tumor from the avascular stage to the vascular stage, angiogenesis is regulated by angiogenic growth factors and their inhibitors, and once this balance is disturbed, angiogenesis can be accelerated[9]. Therefore, identifying the specific molecular markers of tumor vascular endothelial cells can provide a new basis for antiangiogenic therapy targeting the tumor neovasculature in HCC.
MicroRNAs (miRNAs) are a class of non-coding, small RNA molecules consisting of 20-22 nucleotides that regulate gene expression at the post-transcriptional level[10]. They regulate the expression of downstream target genes at the protein level, thus playing important regulatory roles in cellular pathways[11]. Many recent studies have suggested that abnormal expression of miRNA target genes is associated with the initiation and development of various types of cancer[12,13]. MiR-1 has been reported as a down-regulated miRNA in various human malignancies and has a tumor suppressive function[14-17]. However, Liu et al[18] found that miR-1 was markedly up-regulated in the serum of gastric cancer patients. Our previous studies also found that miR-1 was up-regulated in tumor endothelial cells (TECs) of human HCC[19]. Therefore, to investigate the effect of miR-1 on TECs of human HCC, we inhibited the expression of miR-1 in TECs using antisense oligonucleotides and observed the effect on biological behaviors including proliferation, apoptosis, migration, and invasion of TECs.
MATERIALS AND METHODS
Cells
TECs of human HCC, human hepatic sinusoidal endothelial cells (HSECs), and 293T cells were purchased from Shanghai Xinran Biotechnology (Shanghai, China) and cultured in DMEM (Dulbecco’s Modified Eagle’s Medium) high-glucose medium supplemented with 10% fetal bovine serum, 100 U/mL penicillin, and 100 mg/mL streptomycin under 5% CO2 in a humidified incubator at 37 °C.
Construction of lentiviral vectors
A DNA template and oligonucleotides corresponding to miRNA-1 were targeted. The oligonucleotide sequences were designed and synthesized as follows: miR-1-inhibition-F: 5’- TGGAATGTAAAGAAGTATGTAT- 3’, and miR-1-inhibition-R: 5’- ATACATACTTCTTTACATTCCA- 3’. The combined sequences of the enhanced green fluorescent protein (EGFP) gene and the miRNA-1-inhibitor were cloned into the Age I and EcoR I sites of the GV159 vector (Genechem, Biotechnology, China) containing a CMV-driven GFP reporter. All constructed plasmids were confirmed via sequence analysis. All plasmids were transfected into 293T cells using a packaging vector mix (Invitrogen). Eight hours after transfection, the culture medium was replaced with complete culture medium. After another 48 h of culture, the cell culture supernatant rich in lentiviral particles was collected and filtered by using a 0.45 μm filter which allows only viruses, and not cells to pass through. Then, the filtrate was centrifuged to obtain a high titer, concentrated lentiviral solution. The virus titer was determined and calibrated in 293T cells.
Infection of TECs by lentiviruses
The experimental cells were divided into 3 groups: a control (CON) group consisting of normal TECs without lentiviral infection, a negative control (NC) group consisting of normal TECs infected with a negative control virus, and a micro-down (MD) group consisting of normal TECs infected with the miR-1-inhibition virus containing the target gene. Cells under good culture conditions from each experimental group were inoculated into 6-well plates one day prior to viral infection. On the day of infection, lentiviruses were added to each group of cells to perform the infection experiments. Three days after infection, the expression of GFP was observed under a fluorescence microscope, and the proportion of cells with positive fluorescence was higher than 90%. When cells became confluent, they were harvested and examined.
Quantitative reverse transcription-polymerase chain reaction for detection of mature miR-1 expression
Quantitative reverse transcription-polymerase chain reaction (qRT-PCR) was performed to detect the expression of miR-1 in the different groups and the U6 small nuclear RNA was used as the internal standard control. Total RNA was harvested from cells of different groups using the Trizol reagent (Invitrogen) according to the manufacturer’s instructions. For reverse transcription, 5 μg of total RNA was converted to cDNA using a TaqMan MicroRNA Reverse Transcription Kit (Fermentas) according to the manufacturer’s protocol. The resulting cDNA was diluted 1:10 and used for PCR with 4 μL of miR-1 or U6 TaqMan primers and SYBR Green/Flourescein qPCR Master Mix (Fermentas) in the ABI PRISM 7900HT (Applied Biosystems, Foster City, CA, USA). The sequences of the primers were as follows: miR-1 forward: 5’-TGCGCTGGAATGTAAAGAAGTA-3’; miR-1 reverse: 5’-CCAGTGCAGGGTCCGAGGTATT-3’; U6 forward: 5’-CTCACTTCGGCAGCACATA-3’; U6 reverse: 5’-AACTCTTCACGATTTTGTCTGTC-3’. PCR amplification from cDNA was performed in a final volume of 25 μL, and the cycling parameters were preheat at 95 °C for 10 min, then 40 cycles of 95 °C for 30 s and 60 °C for 1 min, followed by a melting curve analysis. The specificity of the PCR amplification was confirmed via a dissociation curve analysis. All reactions were performed in triplicate. The ΔCt data were collected automatically and -ΔΔCt was calculated using the following formula:-ΔΔCt = ΔCt of CON group-ΔCt of the NC or MD group. The relative expression of the target gene was calculated using 2-ΔΔCt[20].
Detection of TEC proliferation using MTT assay
Cells from each group that were in the logarithmic phase were digested with trypsin and resuspended in complete culture medium. The cells were counted using a hemocytometer, and the cell density used for inoculation was determined according to the growth rate (usually 2000 cells/well). Each group had 3-5 duplicate wells with 100 μL of cell suspension in each well; a total of five 96-well plates were used, and the observations were continued for 5 d. When adding cells to the tissue culture plates, the cell number in each well was consistent. After the cells were plated, they were cultured at 37 °C in a 5% CO2 incubator. During the period starting from the second day of plating to 4 h before the termination of culture, 10 μL of 5 mg/mL MTT (Thiazolyl Blue Tetrazolium Bromide) was added to each well without changing the medium. After 4 h, the culture medium was discarded, and 100 μL DMSO was added to each well to stop the reaction. After vortexing for 5-10 min, the optical density (OD) value was detected at 490 nm using a microplate reader, and the results were statistically analyzed.
Flow cytometry detection of TEC apoptosis by Annexin V-APC single staining
Apoptosis was determined using an Annexin-V-APC apoptosis detection kit (eBioscience, San Diego, CA, United States). The cell culture supernatant from each group was collected into 5 mL centrifuge tubes after the cells were infected for 5 d. The cells were washed once with D-Hanks and digested with trypsin; the digestion was stopped by the addition of culture supernatant. The cells were harvested and collected into the same 5 mL centrifuge tube, and each group had three duplicate wells. Then, the cells were collected via centrifugation at 1500 rpm for 5 min and washed twice in PBS. Next, cells were resuspended in binding buffer, and cell suspensions were collected, stained with 5 μL Annexin V-APC at room temperature for 15 min in the dark, and then transferred into flow cytometry tubes for detection using a FACSCalibur (BD Biosciences, San Jose, CA, United States).
The excitation and emission wavelengths of the Annexin V-APC fluorescent signals were 633 nm and 660 nm, respectively. The signals were detected in logarithmic mode at FL4. Annexin V-APC was set as the horizontal axis. Cells staining positive for Annexin V-APC were considered apoptotic (the right upper quadrant and right lower quadrant).
Transwell migration assay
A total of 3 × 10⁴ cells were resuspended in serum-free DMEM after transfection and placed in the top portion of a Transwell chamber with 8-μm pores (Millipore). The lower portion of the chamber contained 10% FBS as a chemoattractant. The chambers were incubated at 37 °C in 5% CO2 for 12 h. Non-migrating cells on the top of the membrane were removed with cotton swabs. Cells that migrated to the bottom of the insert were fixed with 95% ethanol, stained with 0.2% crystal violet (Beyotime, China), and counted and photographed under magnification × 100. Five random fields were analyzed in each chamber.
Transwell invasion assay
A total of 3 × 10⁴ cells were resuspended in serum-free DMEM after transfection and placed in the top portion of a Transwell chamber with 8-μm pores (Millipore) and coated with 30 mg/cm2 matrigel extracellular matrix (ECM) gel (Sigma-Aldrich, United States). The lower portion of the chamber contained 10% FBS as a chemoattractant. The chambers were incubated at 37 °C in 5% CO2 for 24 h. Cells on the top of the membrane were removed with cotton swabs. Cells that invaded the bottom of the insert were fixed with 95% ethanol, stained with 0.2% crystal violet (Beyotime, China), and counted and photographed under × 100 magnification. Five random fields were analyzed in each chamber.
Statistical analysis
All data are expressed as the mean ± SD. SPSS 17.0 software was used for statistical analyses. Differences among groups were assessed using an unpaired Student’s t-test. P-values less than 0.05 were considered statistically significant.
RESULTS
Cell morphology
Observations under a microscope revealed that most of the TECs showed a thin and long “filamentous rod-shaped” morphology, and some showed a triangle or a polygon shape with different sizes (Figure 1A), whereas HSECs showed a uniform, typical, “cobblestone-like” morphology (Figure 1B).
Figure 1.
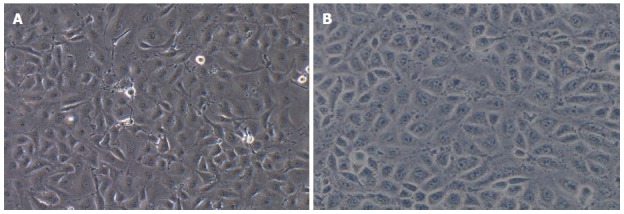
Comparison of the morphology of tumor endothelial cells and hepatic sinusoidal endothelial cells. A: The morphology of tumor endothelial cells (magnification × 100); B: The morphology of hepatic sinusoidal endothelial cells (magnification × 100).
Determination of lentivirus titers after infection of TECs
Three days after infection, the expression of GFP was observed under a fluorescence microscope. A1, B1 and C1 in Figure 2 show the morphology of cells in the CON, NC and MD groups, respectively, under the bright field and A2, B2 and C2 show the same fields under the green fluorescence field. The CON group showed no green fluorescence (Figure 2A2); the NC group (Figure 2B2) and the MD group (Figure 2C2) showed obvious green fluorescence. The results indicated that the lentiviral shRNA was successfully constructed and the proportion of cells with positive fluorescence was over 90%.
Figure 2.
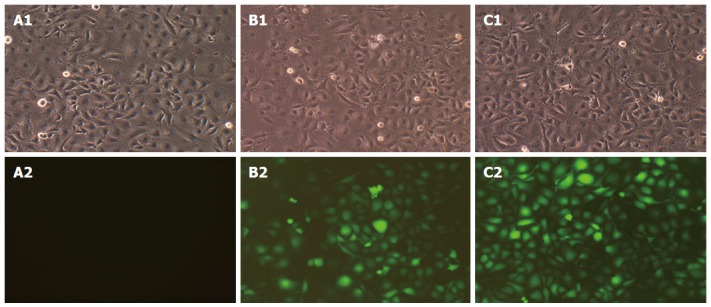
Determination of lentivirus titers after infection of tumor endothelial cells. The morphology of cells in the three groups under bright field and green fluorescence field (A1: CON 100 × B; B1: NC 100 × B; C1: MD 100 × B; A2: CON 100 × G; B2: NC 100 × G; C2: MD 100 × G). B and G indicate the bright field and the green fluorescence field, respectively. MD: Micro-down; NC: Negative control; CON: Control.
MiR-1 expression in cells of three groups
As observed in Figure 3, the expression of miR-1 was significantly decreased in the MD group (2-ΔΔCt = 0.57 ± 0.14) compared with the CON group (2-ΔΔCt = 1) and the NC group (2-ΔΔCt = 1.05 ± 0.13) (P < 0.01). There was no significant difference between the NC group and the CON group (P > 0.05).
Figure 3.
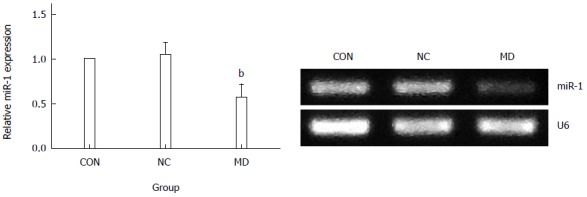
MiR-1 expression in cells of the three groups. The expression of miR-1 was significantly decreased in the MD group compared with the NC and CON groups (P < 0.01). There was no significant difference between the NC group and CON group (P > 0.05). bP < 0.01 vs CON and NC group. MD: Micro-down; NC: Negative control; CON: Control.
Detection of TEC proliferation by MTT assay
As observed in Figure 4, cell proliferation was all significantly inhibited in the MD group for the 5 d (the OD490 of days 1-5 was 0.258 ± 0.005, 0.518 ± 0.029, 1.140 ± 0.054, 1.457 ± 0.106, and 1.543 ± 0.047) compared with the CON group (the OD490 of days 1-5 was 0.328 ± 0.005, 0.672 ± 0.008, 1.362 ± 0.044, 1.653 ± 0.173, and 1.829 ± 0.031) and the NC group (the OD490 of days 1-5 was 0.322 ± 0.011, 0.695 ± 0.007, 1.419 ± 0.031, 1.778 ± 0.037, and 1.843 ± 0.039) (P < 0.01), whereas cell proliferation in the CON and NC groups was not affected (P > 0.05).
Figure 4.
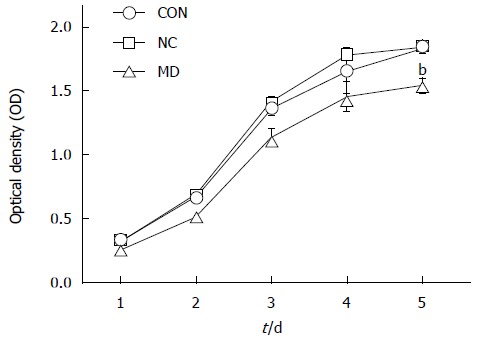
Detection of tumor endothelial cell proliferation by MTT assay. Cell proliferation was significantly inhibited in the MD group compared with the CON and NC groups (P < 0.01), while there was no significant difference between the CON and NC groups (P > 0.05). bP < 0.01 vs CON and NC groups.
Flow cytometric detection of apoptosis in each group after transduction
Five days after transduction, the confluence of each group of cells was approximately 90%. As observed in Figure 5, there was no significant difference between the CON group (2.03% ± 0.30%) and the NC group (2.18% ± 0.15%) (P > 0.05), whereas the MD group (6.32% ± 0.33%) showed significant apoptosis compared with the other groups (P < 0.01).
Figure 5.
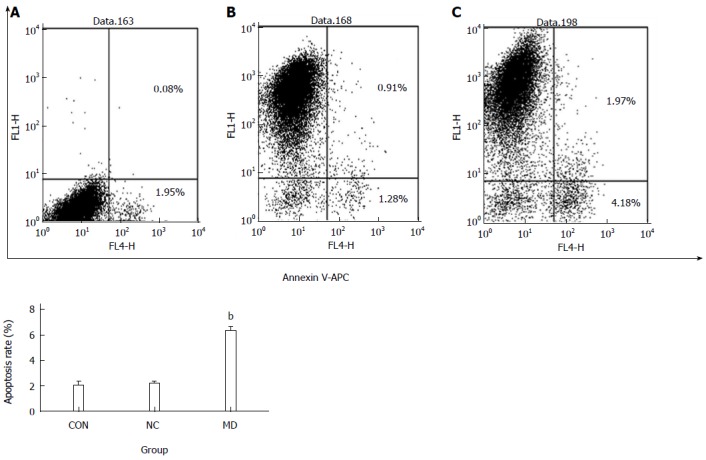
Flow cytometric detection of apoptosis in each group after transduction. A: Flow cytometry results of the CON group; B: Flow cytometry results of the NC group; C: Flow cytometry results of the MD group. Cells staining positive for Annexin V-APC were considered apoptotic (the right upper quadrant and right lower quadrant). bP < 0.01 vs CON and NC groups. MD: Micro-down; NC: Negative control; CON: Control.
Transwell migration assay in each group after transduction
As shown in Figure 6, the number of cells that migrated to the lower portion of the chamber in the CON, NC group, and MD groups was 99.8 ± 3.11, 97.2 ± 3.70, and 62.0 ± 5.48, respectively. The results showed that the migration of TECs was significantly inhibited in the MD group compared with the CON and NC groups (P < 0.01). There was no significant difference between the CON group and the NC group (P > 0.05).
Figure 6.
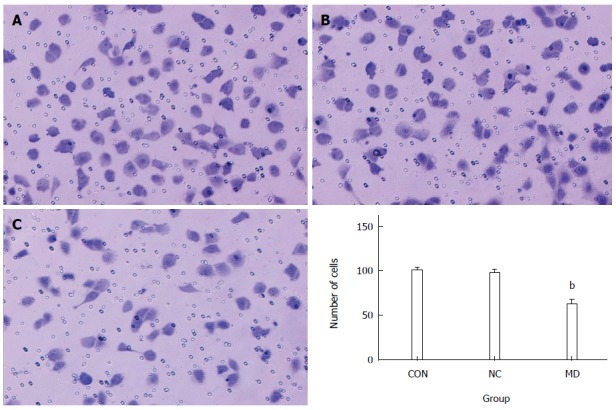
Transwell migration assay. The number of cells migrated to the lower portion of the chamber was significantly decreased in the MD group compared with the CON and NC groups (P < 0.01). There was no significant difference between the CON and NC groups (P > 0.05). bP < 0.01 vs CON and NC groups. A: CON group; B: NC group; C: MD group. MD: Micro-down; NC: Negative control; CON: Control.
Transwell invasion assay in each group after transduction
As observed in Figure 7, the number of the cells that invaded the lower portion of the chamber in the CON, NC, and MD groups was 44.6 ± 3.36, 44.4 ± 5.17, and 29.8 ± 2.39, respectively. The results showed that the invasion of TECs was significantly inhibited in the MD group compared with the CON and NC group (P < 0.01). There was no significant difference between the CON group and the NC group (P > 0.05) (Figure 7).
Figure 7.
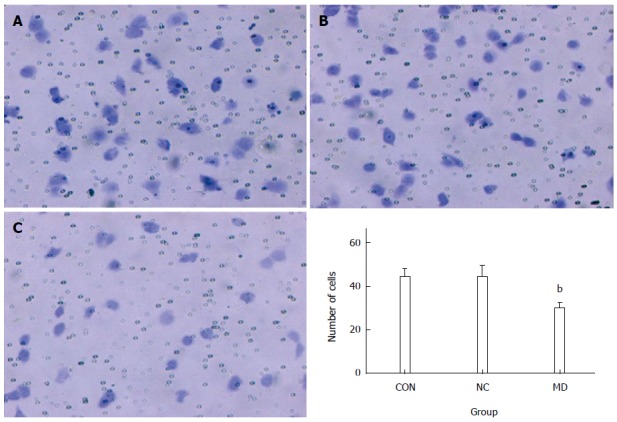
Transwell invasion assay. The number of cells invading to the lower portion of the chamber was significantly decreased in the MD group compared with the CON and NC groups (P < 0.01). There was no significant difference between the CON and NC groups (P > 0.05), bP < 0.01 vs CON and NC groups. A: CON group; B: NC group; C: MD group. MD: Micro-down; NC: Negative control; CON: Control.
DISCUSSION
HCC is one of the most common malignant tumors of the digestive system. More and more studies demonstrated that angiogenesis can influence tumor genesis and growth[21,22]. Therefore, if we can selectively inhibit or directly kill the TECs of HCC, this may provide a more effective and less toxic therapeutic method for HCC patients. Thus, the identification of specific markers for HCC TECs and the investigation of specific targeted therapies against TECs have become new hot spots in the field of tumor therapy[23]. MiRNAs are involved in the regulation of diverse cellular processes, such as proliferation, differentiation, cellular migration and apoptosis[24-27]. MiR-1 has initially been described as a regulator of myogenesis[28]. Subsequently, it has been found that miR-1 is dysregulated in many diseases especially in tumors. In this study, we explored the effect of suppressing the expression of miRNA-1 on biological behavior of TECs of HCC and the following major findings were obtained from our study: suppressing the expression of miRNA-1 could inhibit proliferation, promote apoptosis and inhibit migration and invasion of TECs of HCC.
RNA interference (RNAi) is a posttranscriptional gene silencing mechanism that has emerged as a powerful method for silencing gene expression[29]. However, its two greatest disadvantages, inefficient delivery and transient effects, prohibit its application in chronic degenerative diseases. Lentivirus can easily integrate into the host genome and stably encode shRNA to overcome these drawbacks[30]. As a result, miR-1 shRNA was explored as a means to silence endogenous miR-1 expression in the present study. The transduction rate was almost 90%.
It is well known that tumorigenesis is due to an imbalance between cell proliferation and apoptosis[31]. Therefore, in the present study, we observed the effect of miR-1 on the proliferation and apoptosis of TECs. The results of MTT assay indicated that inhibition of the expression of miR-1 could significantly decrease TEC proliferation, and the difference was the most significant on day 5. Therefore, based on the initial MTT assay results, day 5 presented the most significant proliferation inhibition and was used as the time point for apoptosis detection. The results of apoptosis detection also showed that inhibition of the expression of miR-1 could significantly induce apoptosis in TECs. The death-inducing signaling complex pathway and the mitochondrial pathway are the two major pathways of cellular apoptosis that have been identified[32]. The mechanism of regulation of miR-1 for apoptosis in TECs was not identified in this study and we will conduct further research to reveal the potential mechanism.
Tumor invasion and metastasis are important causes of morbidity and death for liver cancer patients. Blood vessels play an important role in the invasion and metastasis of HCC. Our experiments concerning in vitro migration and invasion showed that inhibition of the expression of miR-1 could significantly inhibit the migration and invasion of TECs of human HCC. However, Weiwei et al[33] found that overexpression of miR-1 could inhibit the invasion and migration of HepG2 cells. Therefore, to investigate the effect of miR-1 on the invasion and metastasis of HCC, in vivo experiments will need to be performed in our further research.
In summary, our study demonstrated that miR-1 might be a potential tumor activator. Inhibition of the expression of miR-1 could decrease proliferation, induce apoptosis, and inhibit migration and invasion of TECs of human HCC. The mechanism of the effect described above still requires further research. We have found some potential target genes of miR-1 such as gap junction protein (GJA1), tankyrase (TNKS2), monocyte to macrophage differentiation-associated 2 (MMD2) using the software TargetScan and we will use methods such as luciferase activity assay and Northern blot to confirm these genes. In addition, we will also perform in vivo experiments to observe the effect of miR-1 on the growth, invasion and metastasis of HCC.
ACKNOWLEDGMENTS
The cell experiments were finished in the lab of “Key laboratory of Hubei Province for Digestive System Disease”. The authors thank Professor Hong Xia in the Institute of Digestive and Liver disease, Wuhan University, for excellent technical support.
COMMENTS
Background
Hepatocellular carcinoma (HCC) is a solid cancer with a rich blood supply. Angiogenesis is crucial in the occurrence, development and prognosis of this cancer. Therefore, if we can selectively inhibit or directly kill the tumor endothelial cells (TECs) of HCC, it may provide a more effective and less toxic therapeutic method for HCC patients. MiR-1 is dysregulated in many diseases especially in tumor. Therefore, it is meaningful to research the effect of miR-1 to TECs of HCC.
Research frontiers
Current studies on microRNAs (miRNAs) are mostly focused on tumor cells. Thus far, few studies have described the miRNAs in TECs of human HCC. The underlying mechanism was also investigated to provide new targets and a theoretical basis for the anti-angiogenic gene therapy of HCC.
Innovations and breakthroughs
Current studies on miRNAs are mostly focused on tumor cells. This study for the first time focused on the role of TECs in HCC and explored the effect of miR-1on biological behavior of TECs of HCC.
Applications
MiR-1 can be used as a new target for gene therapy and can provide effective and specific reference indicators for HCC anti-angiogenic therapy and prognosis evaluation.
Terminology
MiRNAs are non-coding, small RNAs that regulate gene expression at the posttranscriptional level. RNA interference is a posttranscriptional gene silencing mechanism that has emerged as a powerful method for silencing gene expression.
Peer-review
This study described the effect of suppression of miRNA-1 on several biological functions, aiming its future use as a potential tumor suppressor. The results of this study are very interesting and are promising.
Footnotes
Ethics approval: All experiments involving animals and human subjects were designed and performed in compliance with the relevant laws regarding the humane care and use of subjects.
Institutional animal care and use committee: All procedures involving animals were reviewed and approved by the Institutional Animal Care and Use Committee of the Renmin Hospital of Wuhan University (IACUC protocol number: SYXK 2014-0013).
Conflict-of-interest: We declare that we do not have any commercial or associative interest that represents a conflict of interest in connection with the work submitted.
Data sharing: No additional data are available.
Open-Access: This article is an open-access article which was selected by an in-house editor and fully peer-reviewed by external reviewers. It is distributed in accordance with the Creative Commons Attribution Non Commercial (CC BY-NC 4.0) license, which permits others to distribute, remix, adapt, build upon this work non-commercially, and license their derivative works on different terms, provided the original work is properly cited and the use is non-commercial. See: http://creativecommons.org/licenses/by-nc/4.0/
Peer-review started: December 1, 2014
First decision: December 26, 2014
Article in press: February 13, 2015
P- Reviewer: Wang L, Silva AM S- Editor: Qi Y L- Editor: Wang TQ E- Editor: Liu XM
References
- 1.Jemal A, Bray F, Center MM, Ferlay J, Ward E, Forman D. Global cancer statistics. CA Cancer J Clin. 2011;61:69–90. doi: 10.3322/caac.20107. [DOI] [PubMed] [Google Scholar]
- 2.Raza A, Sood GK. Hepatocellular carcinoma review: current treatment, and evidence-based medicine. World J Gastroenterol. 2014;20:4115–4127. doi: 10.3748/wjg.v20.i15.4115. [DOI] [PMC free article] [PubMed] [Google Scholar]
- 3.Joyce JA. Therapeutic targeting of the tumor microenvironment. Cancer Cell. 2005;7:513–520. doi: 10.1016/j.ccr.2005.05.024. [DOI] [PubMed] [Google Scholar]
- 4.Whiteside TL. The tumor microenvironment and its role in promoting tumor growth. Oncogene. 2008;27:5904–5912. doi: 10.1038/onc.2008.271. [DOI] [PMC free article] [PubMed] [Google Scholar]
- 5.Kalluri R. Basement membranes: structure, assembly and role in tumour angiogenesis. Nat Rev Cancer. 2003;3:422–433. doi: 10.1038/nrc1094. [DOI] [PubMed] [Google Scholar]
- 6.Benelli R, Lorusso G, Albini A, Noonan DM. Cytokines and chemokines as regulators of angiogenesis in health and disease. Curr Pharm Des. 2006;12:3101–3115. doi: 10.2174/138161206777947461. [DOI] [PubMed] [Google Scholar]
- 7.Whiteside TL. The role of immune cells in the tumor microenvironment. Cancer Treat Res. 2006;130:103–124. doi: 10.1007/0-387-26283-0_5. [DOI] [PubMed] [Google Scholar]
- 8.Seaman S, Stevens J, Yang MY, Logsdon D, Graff-Cherry C, St Croix B. Genes that distinguish physiological and pathological angiogenesis. Cancer Cell. 2007;11:539–554. doi: 10.1016/j.ccr.2007.04.017. [DOI] [PMC free article] [PubMed] [Google Scholar]
- 9.Hobert O. Gene regulation by transcription factors and microRNAs. Science. 2008;319:1785–1786. doi: 10.1126/science.1151651. [DOI] [PubMed] [Google Scholar]
- 10.Lagos-Quintana M, Rauhut R, Lendeckel W, Tuschl T. Identification of novel genes coding for small expressed RNAs. Science. 2001;294:853–858. doi: 10.1126/science.1064921. [DOI] [PubMed] [Google Scholar]
- 11.Selbach M, Schwanhäusser B, Thierfelder N, Fang Z, Khanin R, Rajewsky N. Widespread changes in protein synthesis induced by microRNAs. Nature. 2008;455:58–63. doi: 10.1038/nature07228. [DOI] [PubMed] [Google Scholar]
- 12.Tutar L, Tutar E, Tutar Y. MicroRNAs and cancer; an overview. Curr Pharm Biotechnol. 2014;15:430–437. doi: 10.2174/1389201015666140519095304. [DOI] [PubMed] [Google Scholar]
- 13.Yang G, Yin B. The advance of application for microRNAs in cancer gene therapy. Biomed Pharmacother. 2014;68:137–142. doi: 10.1016/j.biopha.2013.10.002. [DOI] [PubMed] [Google Scholar]
- 14.Chiyomaru T, Enokida H, Kawakami K, Tatarano S, Uchida Y, Kawahara K, Nishiyama K, Seki N, Nakagawa M. Functional role of LASP1 in cell viability and its regulation by microRNAs in bladder cancer. Urol Oncol. 2012;30:434–443. doi: 10.1016/j.urolonc.2010.05.008. [DOI] [PubMed] [Google Scholar]
- 15.Datta J, Kutay H, Nasser MW, Nuovo GJ, Wang B, Majumder S, Liu CG, Volinia S, Croce CM, Schmittgen TD, et al. Methylation mediated silencing of MicroRNA-1 gene and its role in hepatocellular carcinogenesis. Cancer Res. 2008;68:5049–5058. doi: 10.1158/0008-5472.CAN-07-6655. [DOI] [PMC free article] [PubMed] [Google Scholar] [Retracted]
- 16.Nasser MW, Datta J, Nuovo G, Kutay H, Motiwala T, Majumder S, Wang B, Suster S, Jacob ST, Ghoshal K. Down-regulation of micro-RNA-1 (miR-1) in lung cancer. Suppression of tumorigenic property of lung cancer cells and their sensitization to doxorubicin-induced apoptosis by miR-1. J Biol Chem. 2008;283:33394–33405. doi: 10.1074/jbc.M804788200. [DOI] [PMC free article] [PubMed] [Google Scholar] [Retracted]
- 17.Yan D, Dong Xda E, Chen X, Wang L, Lu C, Wang J, Qu J, Tu L. MicroRNA-1/206 targets c-Met and inhibits rhabdomyosarcoma development. J Biol Chem. 2009;284:29596–29604. doi: 10.1074/jbc.M109.020511. [DOI] [PMC free article] [PubMed] [Google Scholar]
- 18.Liu R, Zhang C, Hu Z, Li G, Wang C, Yang C, Huang D, Chen X, Zhang H, Zhuang R, et al. A five-microRNA signature identified from genome-wide serum microRNA expression profiling serves as a fingerprint for gastric cancer diagnosis. Eur J Cancer. 2011;47:784–791. doi: 10.1016/j.ejca.2010.10.025. [DOI] [PubMed] [Google Scholar]
- 19.Cui ZH, Shen SQ, Chen ZB, Hu C. Growth inhibition of hepatocellular carcinoma tumor endothelial cells by miR-204-3p and underlying mechanism. World J Gastroenterol. 2014;20:5493–5504. doi: 10.3748/wjg.v20.i18.5493. [DOI] [PMC free article] [PubMed] [Google Scholar]
- 20.Liu X, Fang H, Chen H, Jiang X, Fang D, Wang Y, Zhu D. An artificial miRNA against HPSE suppresses melanoma invasion properties, correlating with a down-regulation of chemokines and MAPK phosphorylation. PLoS One. 2012;7:e38659. doi: 10.1371/journal.pone.0038659. [DOI] [PMC free article] [PubMed] [Google Scholar]
- 21.El-Serag HB, Rudolph KL. Hepatocellular carcinoma: epidemiology and molecular carcinogenesis. Gastroenterology. 2007;132:2557–2576. doi: 10.1053/j.gastro.2007.04.061. [DOI] [PubMed] [Google Scholar]
- 22.Yoder MC, Mead LE, Prater D, Krier TR, Mroueh KN, Li F, Krasich R, Temm CJ, Prchal JT, Ingram DA. Redefining endothelial progenitor cells via clonal analysis and hematopoietic stem/progenitor cell principals. Blood. 2007;109:1801–1809. doi: 10.1182/blood-2006-08-043471. [DOI] [PMC free article] [PubMed] [Google Scholar]
- 23.Jones CA, London NR, Chen H, Park KW, Sauvaget D, Stockton RA, Wythe JD, Suh W, Larrieu-Lahargue F, Mukouyama YS, et al. Robo4 stabilizes the vascular network by inhibiting pathologic angiogenesis and endothelial hyperpermeability. Nat Med. 2008;14:448–453. doi: 10.1038/nm1742. [DOI] [PMC free article] [PubMed] [Google Scholar]
- 24.Karp X, Ambros V. Developmental biology. Encountering microRNAs in cell fate signaling. Science. 2005;310:1288–1289. doi: 10.1126/science.1121566. [DOI] [PubMed] [Google Scholar]
- 25.Fleissner F, Jazbutyte V, Fiedler J, Gupta SK, Yin X, Xu Q, Galuppo P, Kneitz S, Mayr M, Ertl G, et al. Short communication: asymmetric dimethylarginine impairs angiogenic progenitor cell function in patients with coronary artery disease through a microRNA-21-dependent mechanism. Circ Res. 2010;107:138–143. doi: 10.1161/CIRCRESAHA.110.216770. [DOI] [PubMed] [Google Scholar]
- 26.Miska EA, Alvarez-Saavedra E, Townsend M, Yoshii A, Sestan N, Rakic P, Constantine-Paton M, Horvitz HR. Microarray analysis of microRNA expression in the developing mammalian brain. Genome Biol. 2004;5:R68. doi: 10.1186/gb-2004-5-9-r68. [DOI] [PMC free article] [PubMed] [Google Scholar]
- 27.Xu P, Guo M, Hay BA. MicroRNAs and the regulation of cell death. Trends Genet. 2004;20:617–624. doi: 10.1016/j.tig.2004.09.010. [DOI] [PubMed] [Google Scholar]
- 28.Chen JF, Mandel EM, Thomson JM, Wu Q, Callis TE, Hammond SM, Conlon FL, Wang DZ. The role of microRNA-1 and microRNA-133 in skeletal muscle proliferation and differentiation. Nat Genet. 2006;38:228–233. doi: 10.1038/ng1725. [DOI] [PMC free article] [PubMed] [Google Scholar]
- 29.Hannon GJ. RNA interference. Nature. 2002;418:244–251. doi: 10.1038/418244a. [DOI] [PubMed] [Google Scholar]
- 30.Couto LB, High KA. Viral vector-mediated RNA interference. Curr Opin Pharmacol. 2010;10:534–542. doi: 10.1016/j.coph.2010.06.007. [DOI] [PubMed] [Google Scholar]
- 31.Williams GT, Smith CA. Molecular regulation of apoptosis: genetic controls on cell death. Cell. 1993;74:777–779. doi: 10.1016/0092-8674(93)90457-2. [DOI] [PubMed] [Google Scholar]
- 32.Scaffidi C, Fulda S, Srinivasan A, Friesen C, Li F, Tomaselli KJ, Debatin KM, Krammer PH, Peter ME. Two CD95 (APO-1/Fas) signaling pathways. EMBO J. 1998;17:1675–1687. doi: 10.1093/emboj/17.6.1675. [DOI] [PMC free article] [PubMed] [Google Scholar]
- 33.Wei W, Hu Z, Fu H, Tie Y, Zhang H, Wu Y, Zheng X. MicroRNA-1 and microRNA-499 downregulate the expression of the ets1 proto-oncogene in HepG2 cells. Oncol Rep. 2012;28:701–706. doi: 10.3892/or.2012.1850. [DOI] [PubMed] [Google Scholar]


