

Abstract
A prominent hypothesis states that specialized neural modules within the human lateral frontopolar cortices (LFPCs) support “relational integration” (RI), the solving of complex problems using inter-related rules. However, it has been proposed that LFPC activity during RI could reflect the recruitment of additional “domain-general” resources when processing more difficult problems in general as opposed to RI specifically. Moreover, theoretical research with computational models has demonstrated that RI may be supported by dynamic processes that occur throughout distributed networks of brain regions as opposed to within a discrete computational module. Here, we present fMRI findings from a novel deductive reasoning paradigm that controls for general difficulty while manipulating RI demands. In accordance with the domain-general perspective, we observe an increase in frontoparietal activation during challenging problems in general as opposed to RI specifically. Nonetheless, when examining frontoparietal activity using analyses of phase synchrony and psychophysiological interactions, we observe increased network connectivity during RI alone. Moreover, dynamic causal modeling with Bayesian model selection identifies the LFPC as the effective connectivity source. Based on these results, we propose that during RI an increase in network connectivity and a decrease in network metastability allows rules that are coded throughout working memory systems to be dynamically bound. This change in connectivity state is top-down propagated via a hierarchical system of domain-general networks with the LFPC at the apex. In this manner, the functional network perspective reconciles key propositions of the globalist, modular, and computational accounts of RI within a single unified framework.
Keywords: fMRI, frontopolar cortex, functional networks, phase synchrony, relational integration, rostrolateral prefrontal cortex
Introduction
“Relational integration” (RI) is considered to be a definitive component of human cognition. It is crucial for abstract thought and a key aspect of intelligence (Christoff et al., 2001; Penn et al., 2008; Krawczyk, 2012). Despite much research, the neural basis of RI remains divisive. In support of the modular perspective (Christoff et al., 2003; Ramnani and Owen, 2004; Bunge et al., 2005), the lateral frontopolar cortices (LFPCs) are situated at the apex of, and receive numerous inputs from, multimodal frontal-lobe areas (Ramnani and Owen, 2004; Bunge et al., 2009). Furthermore, lesion studies have demonstrated that prefrontal cortex damage is accompanied by significant impairments in RI (Duncan et al., 1995; Waltz et al., 1999; Krawczyk et al., 2008). Finally, neuroimaging studies have reported increased LFPC activation when subrule products of compound problems must be integrated during visuospatial reasoning (Christoff et al., 2001; Kroger et al., 2002), when integrating semantic relations in propositional analogies (Wendelken et al., 2008; Bunge et al., 2009), and during relational matching tasks (Christoff et al., 2003; Bunge et al., 2009).
However, the existence of an RI module within the LFPC has been questioned because the observed activation could be a secondary consequence of a general increase in task difficulty. Specifically, globalist models (Duncan and Owen, 2000; Cole and Schneider, 2007; Seeley et al., 2007; Vincent et al., 2008; Duncan, 2010, 2013) propose that activity within “domain-general” cortex covaries with a broad range of cognitive demands. In this respect RI, like many other cognitive tasks, may take proxy measures of, and infer overspecified roles for, domain-general systems (Hampshire et al., 2012c; Erika-Florence et al., 2014).
To complicate matters further, data-driven analyses support the view that the human frontoparietal cortices are functionally organized into distributed networks as opposed to discrete processing modules (Hampshire et al., 2012c; Erika-Florence et al., 2014). This observation has led to a refinement of the globalist viewpoint, which states that cognitive demands should be taxonomized into broad classes according to the functional networks they recruit (Sporns et al., 2005; Bullmore and Sporns, 2009; Poldrack, 2011; Yarkoni et al., 2011; Hampshire et al., 2012c).
Nonetheless, while diverse cognitive demands activate the same functional networks, they may still differ in terms of the dynamic processes that those networks engage in. Indeed, computational modeling research has demonstrated how RI may be encoded by a temporal binding mechanism (Hummel and Holyoak, 1997; Palva et al., 2010; Knowlton et al., 2012); specifically, dynamic binding by neural synchrony could encode temporary structural relations between knowledge representations distributed throughout working memory systems. However, there is a lack of empirical evidence to support this view and, consequently, it remains unclear whether RI should be considered a distinct cognitive process and, if so, whether it has a basis within a dedicated module, a specialized functional network, or a specific mode of network dynamics. Here, we address this issue by applying a suite of network analysis methods to data from a novel fMRI reasoning paradigm, which orthogonally manipulates RI demands while controlling for task difficulty.
Materials and Methods
Task design.
Participants were required to deduce a set of stepwise rules underlying relationships between abstract shapes in a reasoning display (Fig. 1) and to then predict the array that would logically follow. A 2 × 2 factorial design was used with reasoning problems differing according to the number of subrules (NSRs; two or three) and the requirement for RI (inter-related or parallel rules). Each problem consisted of sequences of four arrays with each array divided into three sections housing items of the sequence. In the two-subrule problems, the bottom section contained an item that did not differ across the four arrays to match the three-subrule problems for visual complexity. In the parallel problems, the rules governing the top, middle, and bottom section were stepwise and unrelated to one another. For example, as seen in Figure 1a, the top section contains a symbol of a triangle and a dot and the middle section contains an array of eight triangles. The rules governing the top section is to rotate the image 90° at each step, and the rule governing the second section is for the item that is filled in among the array to move one position left at each step. In the inter-related problems, the output of one section forms the input for another, with the rules governing the second (and third) sections being related to the rule in the section above. For example, as seen in Figure 1c, the rule in the top box is stepwise, rotating the image right by 90° at each step. This time the rule in the second section relates to the rule in the first box. In this example, the orientation of the triangle above determines which item is colored in below. Before each problem, a screen with the word “inter-related” or “parallel” was presented for 600 ms to inform the participant which type of problem would follow.
Figure 1.
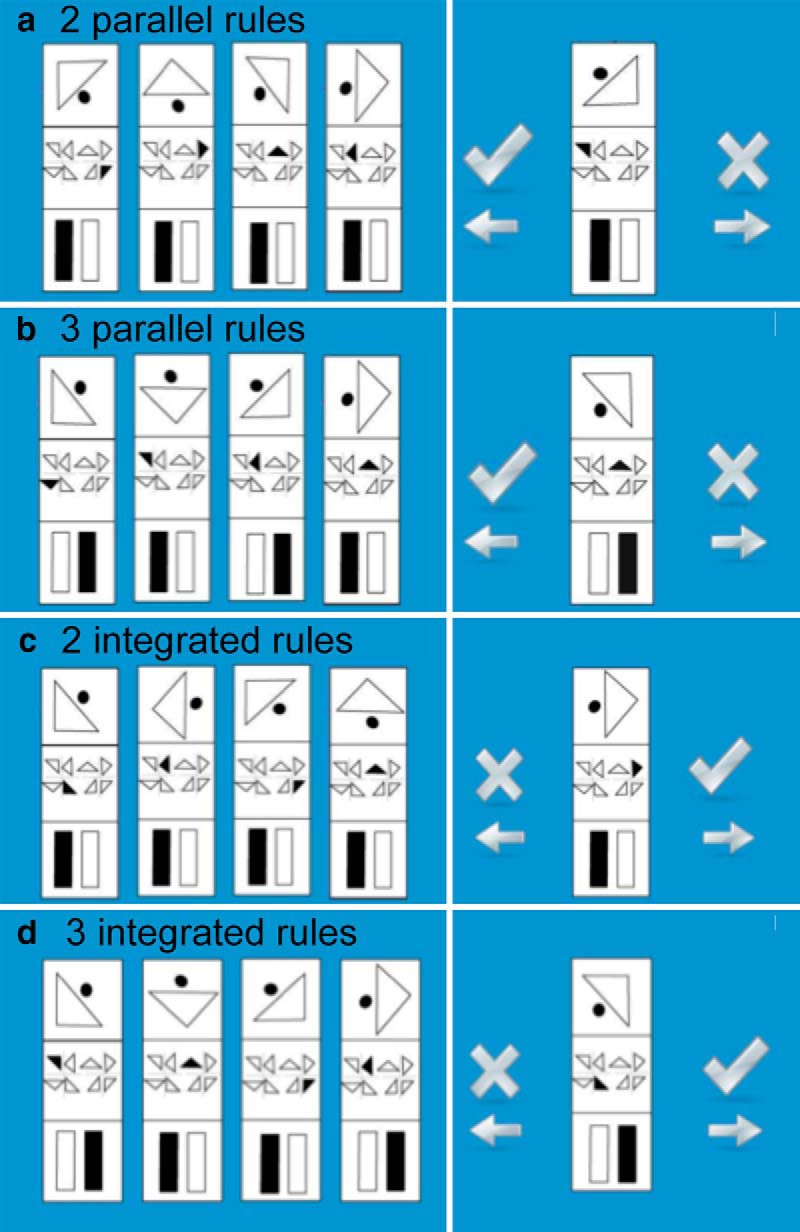
The nonverbal reasoning task. Initially the text “integrated” or “parallel” was presented to inform the participant which type of problem would follow. Then, the rule derivation screen was presented, which presented the reasoning problem. Last was the rule application phase, whereby participants indicated whether the item shown to them was the next logical item in the sequence.
The participant was required to indicate, with a button press, when they had derived the rules and had formed a prediction of what the next array in the sequence should be. The rule answer screen then displayed one array, and participants had to indicate whether that array matched their prediction. The correct answer was displayed in 50% of the trials. Participants were required to indicate their answer (yes or no) with a button press. Completion of the task was self-paced and all problems were displayed on the screen until a response was made. To motivate and guide behavior, feedback consisting of either the word “correct” in green or “incorrect” in red was presented in the middle of the screen for 600 ms after the response. Subsequently there was a 4 s blank screen before the presentation of the next problem.
The task consisted of 32 problems in total with eight of each of the four types of problems. The surface features that were used in the arrays were matched across the four conditions to control for visual complexity. Problems were presented in a predefined pseudorandomized sequence to control for any effects of rule or task familiarity across the conditions.
Participants.
Twenty right-handed participants (10 female) aged 19–27 years were recruited from the Medical Research Council Cognition and Brain Sciences Unit subject panel. Two participants were excluded from the behavioral analysis due to poor performance (<50% correct) and one was removed from the group level region of interest (ROI) analyses due to outlier values (>3 SDs from the mean). All participants had normal or corrected-to-normal vision and no history of neurological or psychiatric illness. Participants were reimbursed for their time.
Data acquisition and preprocessing.
The scans were acquired on a Siemens 3T Tim Trio scanner in the Wolfson Brain Imaging Centre at Addenbrookes Hospital, Cambridge, United Kingdom. Data were collected in one continuous block; the scan continued until the participant had completed the task or until 20 minutes had elapsed. Thirty-two 3 mm slices (0.75 interslice gap) gave an in-plane resolution of 3 × 3 mm and were acquired using a time repetition of 2 s. The T2*-weighed echoplanar images depicting the blood oxygenation level-dependent (BOLD) contrast were acquired with a flip angle of 78°. The stimulus display was projected onto a screen located behind the bore of the magnet and viewed via a mirror mounted on the headcoil. Each display subtended a visual angle of ∼9°. Before analysis, images were preprocessed using SPM8 (Wellcome Department of Cognitive Neurology). Data were slice-timing and motion corrected, spatially normalized to the standard Montreal Neurological Institute template, and spatially smoothed with an 8 mm full-width at half-maximum Gaussian kernel.
fMRI analyses.
In brief, we assessed functional connectivity in terms of phase synchronization. We then addressed significant changes in regional coupling using psychophysiological interactions. Finally, we tested for condition-specific effects on (hierarchical) effective connectivity using dynamic causal modeling. Data were analyzed using these complementary approaches, each designed to address a specific research question. First, to ensure an unbiased selection of ROIs for subsequent connectivity analyses, we performed independent component analysis (ICA) on voxel activation time courses from within the lateral prefrontal cortices. ICA was conducted using the FSL [FMRIB (Functional Magnetic Resonance Imaging of the Brain) Software Library)] MELODIC (Multivariate Exploratory Linear Optimized Decomposition into Independent Components) command line function (Smith et al., 2009) with the concatenate option. The ICA was restricted to an anatomical mask, which included bilateral lateral frontal cortex and insula as defined by the Automatic Anatomical Labeling templates (Tzourio-Mazoyer et al., 2002) to try to achieve a complete and accurate decomposition of this region (Braga et al., 2013). Next, seed analyses were conducted to determine whether the regions identified by the ICA were associated with different large-scale networks. Specifically, seed time courses were extracted from the most prominent peak from each (physiologically plausible) ICA component using the MarsBaR ROI toolbox (Brett et al., 2002), which calculates the average value from all voxels within the ROI. Data were extracted from seed ROIs as opposed to using raw component time courses to ensure that time courses did not concurrently capture variance from distal regions within the mask, which could affect subsequent connectivity analyses. This approach enabled us to construct a two-tier layer network or graph that comprised three key networks and their constituent nodes. Our subsequent analyses of activity and connectivity among the network nodes were based upon this (data-led) characterization of distributed responses.
Having defined the networks of interest in a model-free manner, fixed effects analyses were then performed on each individual's fMRI data using general linear modeling (GLM) in SPM. The data were high-pass filtered (cutoff period, 180 s) to remove low-frequency drifts in the MRI signal. Regressor functions for each condition were created by convolving timing functions indicating the onset and duration of each event with a basis function representing the canonical hemodynamic response. Explicitly modeling the duration of each event was necessary as it ensured that the resultant parameter estimates represented an estimate of the neural activity per unit time spent solving the problem. This meant the model controlled for systematic differences in the time taken to solve different types of problems with any activation differences observed in harder problems being due to a heightened as opposed to prolonged neural responses. Our long response times were beneficial as they enabled us to model each event as a miniblock, giving our analysis good statistical power and allowing us to compare the first and second halves of each problem when investigating time-dependent effects. Activation during the task was modeled with 10 psychological predictor functions. These consisted of two regressors for each of the four reasoning conditions (two-subrule parallel, three-subrule parallel, two-subrule inter-related, three-subrule inter-related), one for the rule-derivation phase, and one for the answer phase. Two regressors were used to model any confounding effects of positive and negative feedback events. A further six regressors were included representing the translational and rotational movement parameters within the x, y, and z planes.
Task-related changes in network connectivity were examined using three types of analyses, each of which provides a complementary perspective on distrusted responses. First, phase synchrony analyses were applied to time course data extracted from each ROI using MarsBaR. The phase analysis was applied because it provides an efficient approach for examining global changes in connectivity across all regions simultaneously. The time course data were high-pass filtered at 60 s and an instantaneous measure of phase was estimated by applying the Hilbert transform (Laird et al., 2002). Phase synchrony across time was then estimated using the Kuramoto order parameter (Hellyer et al., 2014). Essentially, a time course representing the phase synchrony was calculated by taking the exponent of the phase multiplied by the square root of −1 for each data point, providing a complex representation with magnitude of one and argument dependent on phase angle. The absolute of the mean of this representation across the time courses at each time point provides a convenient measure of phase co-ordination according to the following equation:
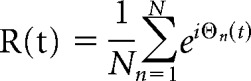 |
where R is a vector representing the level of phase synchrony between N time courses (ROIs or voxels) at each time point (t) and ϴ represents the N*t matrix of instantaneous phases (1, fully synchronous time courses; 0, fully asynchronous time courses). The model from the univariate GLM, including all psychological events, movement parameters, and the constant term, was regressed onto the synchronicity time course R. The RI and NSR contrast values were calculated from the regression parameter estimates and these were collated for group-level analysis to determine whether there were consistent task-related changes in connectivity across the networks. This analysis was then repeated with time courses extracted from all voxels within the brain to determine whether RI or NSR manipulations evoked a global change in synchronization within the brain, which can be interpreted as a task-related change in global network metastability (Hellyer et al., 2014).
Next, psychophysiological interaction (PPI) analyses were performed across the graph of network nodes to determine whether task-related changes in connectivity differed between the networks of interest. PPIs were conducted using SPM8 in the following standard manner. BOLD activation time courses were extracted from bilateral masks composed of 10 mm spheres within the inferior frontal sulcus (IFS), LFPC, and anterior insula and frontal operculum (AIFO) using the volume-of-interest (VOI) function, which extracts the first eigenvector across all voxels within the mask. VOIs were centered at peak voxels from the ICA. The neural signal underlying the BOLD response was estimated using the deconvolution function before being interacted with psychological time courses for the RI (interrelated, 1; parallel, −1) and NSR (three rules, 1; two rules, −1) factors to produce the PPIs. The physiological, psychological, and psychophysiological time courses were convolved with the hemodynamic response function to produce predictor functions. Each set of predictors was tested with a separate GLM. That is, one set each for the three seed regions and for each factor (RI and NSRs). Movement parameters were also included in the GLMs. Mean parameter estimates for the PPI predictor functions were extracted for each GLM and from each ROI using the MarsBaR ROI toolbox. These data were exported for group level analyses in SPSS.
As discussed above, the reasoning problems applied here involve relatively long average processing times; therefore, the trials were modeled as miniblocks as opposed to rapid and interspersed events. This design allowed us to investigate the basis of connectivity effects in more detail within the timescale of each trial. To assess whether the PPI effect related to the early or late stage of problem solving, separate PPIs were created for each of the four conditions of the factorial design with the first half of the trials set to −1, the latter half set to 1, and all other time points set to 0. The resultant parameter estimates for PPI predictors were extracted for each ROI and were contrasted for the RI and NSR manipulations. That is, we compared the change in PPI across first and second halves of the trials for the contrast of RI (integrated minus parallel conditions) and the contrast of NSRs (three vs two rules).
Finally, dynamic causal modeling (DCM; Friston et al., 2003) was conducted using SPM12 to examine directed effective connectivity between network nodes. Each model was fitted to time course data from three ROIs. In the analysis of between-network connections, time courses were extracted from masks composed of bilateral 10 mm spheres based at the peak coordinates from the ICA within the lateral prefrontal cortex. In the analysis of within-network connections, data were extracted in the same manner from 10 mm spheres located at peak coordinates from the seed analysis. All ROIs were reciprocally connected and self-connected (A matrix). The driving input (C matrix) was a time course that included the durations for all four types of reasoning problem within the 2 * 2 factorial design. The driving input was connected to all three ROIs in parallel. The modulatory input (B matrix) included a single time course with the durations of all parallel problems set to −1 and all inter-related problems to +1. DCMs only differed with respect to the connections that were targeted by the modulatory inputs because hypotheses related to the basis of the observed increase in network connectivity in response to RI. The models were compared using Bayesian model selection with fixed-effects analysis because it was assumed that healthy controls have consistent network architecture (Stephan et al., 2010); however, we note that model selection with random-effects analysis favors the same models.
Results
Latencies and accuracies
In the task design (Fig. 1), problems had either two or three subrules (NSRs) and those rules were either parallel or inter-related (RI) with the output of one rule providing the input of another. Thus, there were two difficulty manipulations in a 2 * 2 factorial design. Mean reaction times (from stimulus onset to participant responding that they had deduced rule) and error rates are displayed in Figure 2a. A 2 × 2 repeated-measures ANOVA was performed in which the factors were NSR (3 vs 2 subrules) and RI (inter-related vs parallel). Critically, there were significant increases in response times for both factors (NSR: F(1,17) = 18.173, p < 0.001; RI: F(1,17) = 13.320 p < 0.002) and no significant interaction (F(1,17) = 2.193, p < 0.157; calculated from correct trials only), demonstrating that both manipulations required additional processing time. The total numbers of correctly solved problems were examined using the same design, revealing a significant main effect of RI (F(1,17) = 11.524, p < 0.003), no significant main effect of NSR (F(1,17) = 0.014, p < 0.907) and no significant interaction (F(1,17) = 0.052, p < 0.154).
Figure 2.

Behavioral data for the different task conditions. a, Mean latencies (seconds) and SEMs, both NSRs and RI caused an increase in response times. b, Percentage of correctly solved problems and SEMs. RI caused a decrease in the number of correctly solved problems.
Determining the functional topography of the frontal cortex
In the ICA analysis, calculation of the Akaike Information Criteria indicated 10 significant components. Three of the components related to movement artifacts and were discarded. The remaining seven components (Table 1a, C1–C7) included well established functional subdivisions of the lateral prefrontal cortex. Notably, C1 was a good candidate for the RI module as it included anterior and lateral regions of the orbitofrontal cortex bilaterally, extending into the LFPC. This region was also similar (Fig. 3a) to the pattern of activation that we have previously observed during spatial planning (Williams-Gray et al., 2007) and contingency reversal learning (Hampshire and Owen, 2006). C2 included the IFS bilaterally, a region previously associated with “rule processing” demands (Hampshire et al., 2012c; Fig. 3b). C3 included the AIFO bilaterally, areas previously implicated in attentionally demanding tasks, including target detection and attentional switching (Hampshire and Owen, 2006; Hampshire et al., 2007; Fig. 3c). The other four components centered on the medial orbitofrontal cortex (C4), anterior superior frontal gyrus (C5), premotor cortex (C6), and the left middle frontal gyrus (C7). For further analysis, 5 mm spherical ROIs were defined at peak coordinates of these components.
Table 1.
Coordinates for peak voxels within the frontal cortex for the seven components of the ICA (1a) and seed connectivity analysis (1b)
| 1a: Coordinates for peak voxels within the frontal cortex for the seven components of the ICA | |||
|---|---|---|---|
| Component, region | x | y | z |
| C1 | |||
| LFPC left | −34 | 56 | −4 |
| LFPC right | 34 | 56 | −8 |
| C2 | |||
| IFS left | −46 | 34 | 14 |
| IFS right | 50 | 40 | 18 |
| C3 | |||
| AIFO left | −38 | 18 | −4 |
| AIFO right | 46 | 18 | −4 |
| ACC/pre-SMA left | −2 | 24 | 38 |
| C4 | |||
| Middle orbitofrontal cortex/ventromedial prefrontal cortex left | −2 | 48 | −8 |
| ACC right | 6 | 26 | 26 |
| C5 | |||
| Superior frontal gyrus/ACC left | −4 | 42 | 42 |
| Superior frontal gyrus/ACC right | 10 | 38 | 42 |
| C6 | |||
| Premotor cortex left | −24 | 2 | 56 |
| Premotor cortex right | 28 | 8 | 56 |
| C7 | |||
| Middle frontal gyrus left | −24 | 40 | 30 |
| Precentral gyrus left | −6 | 26 | 42 |
| 1b: Seed connectivity analysis | ||||
|---|---|---|---|---|
| Seed, region | x | y | z | t |
| LFPC | ||||
| pDLPFC left | −46 | 16 | 42 | 8.21 |
| pDLPFC right | 40 | 20 | 48 | 5.70 |
| Parietal cortex left | −46 | −58 | 44 | 9.05 |
| Parietal cortex right | 44 | −62 | 44 | 9.05 |
| IFS | ||||
| Inferior parietal cortex left | 32 | −66 | 34 | 4.22 |
| Inferior parietal cortex right | −28 | −72 | 34 | 4.71 |
| Caudate left | −12 | 10 | 4 | 8.93 |
| Caudate right | 12 | 12 | 4 | 9.25 |
| AIFO | ||||
| ACC left | −6 | 26 | 26 | 11.93 |
| ACC right | 6 | 26 | 26 | 13.82 |
| Temporal parietal junction left | −58 | −30 | 26 | 9.66 |
The LFPC seed showed connectivity with pDLPFC and parietal cortex. The IFS showed connectivity with inferior parietal cortex and caudate. The AIFO showed connectivity with the anterior cingulate cortex and temporal parietal junction.
Figure 3.
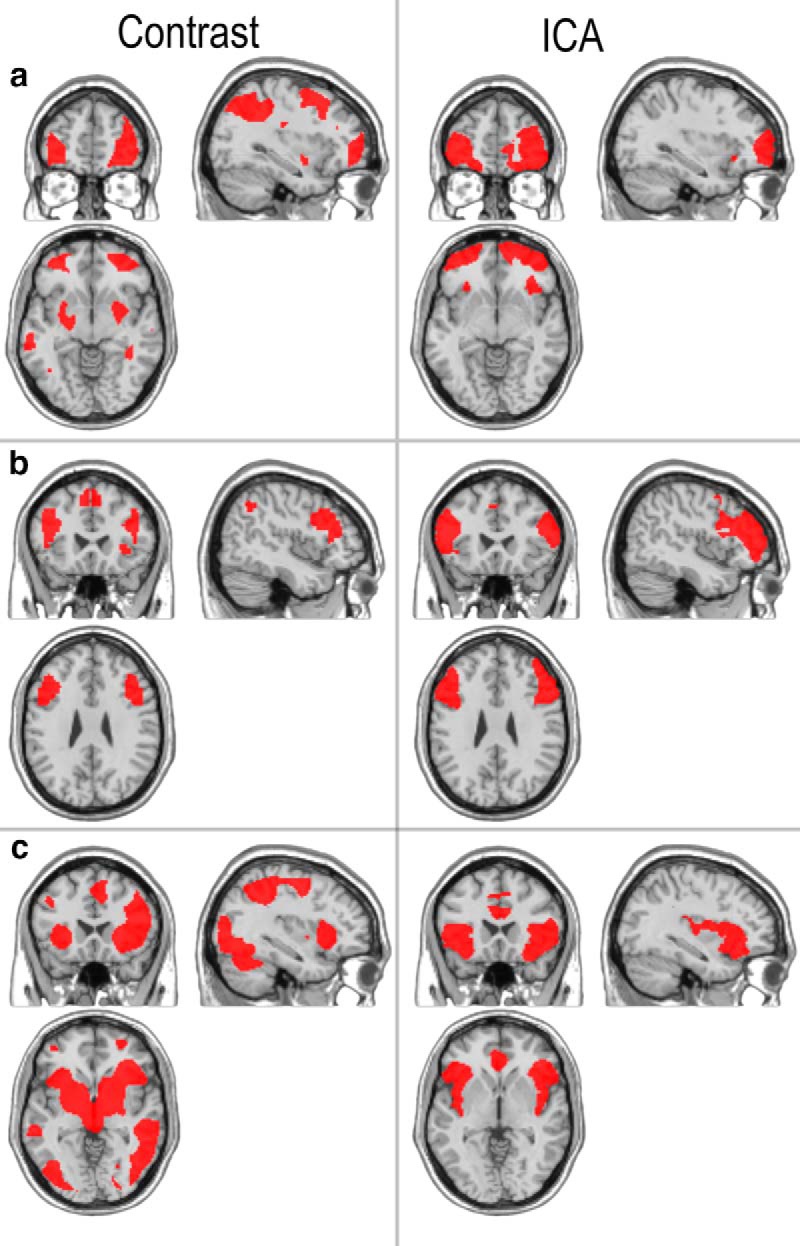
Comparisons between ICA components and representative contrasts reported in previous publications. a, On the right is the LFPC ICA cluster and on the left is the pattern of activation observed during contingency reversal learning (Hampshire et al., 2006). b, On the right is the IFS ICA cluster and on the left is the “Reasoning” component from a recent study comparing activations across 12 challenging cognitive tasks (Hampshire et al., 2012). c, On the right is the AIFO ICA cluster and to the left is a contrast of targets minus distractors during target detection (Hampshire et al., 2007). All contrasts are thresholded at p < 0.05 false-discovery rate corrected for the whole brain mass.
Localizing functional networks within the whole brain
In the seed analysis, activation time courses for each participant were extracted from the 5 mm ROIs and were averaged across hemispheres. These “seed” time courses were entered together into a GLM in which voxel time courses across the entire brain were the dependent variables (Braga et al., 2013). Whole-brain maps depicting parameter estimates for each of the seed time courses were examined at the group level, using a design with seed as the within-subject factor (C1–C7; Figs. 4, 5a). When the LFPC was contrasted against the other six seed ROIs at the group level, significantly greater connectivity was evident across a distributed cortical network that included bilateral posterior middle frontal gyrus and parietal cortex. The IFS seed produced greater functional connectivity within a network including bilateral caudate head, dorsal and ventral visual processing streams, and inferior parietal cortex. Contrasting the AIFO against the other six seed ROIs produced significantly greater functional connectivity within the anterior cingulate cortex/pre-SMA and temporal parietal junction bilaterally. The other four seeds also produced distinctive distributed functional networks; however, this study focuses on the first three due to their established roles in relational integration, reasoning, and attentional task demands. For further analysis, 5-mm-radius ROIs were defined at peak-activation coordinates from the three seeded contrasts (Table 1b). The ROIs from the ICA and seed analysis were structured into a two-layer hierarchical graph (Fig. 5c), in which the top layer was formed from the LFPC, IFS, and AIFO ROIs, and the bottom layer was formed from the networks of ROIs identified in the seed analysis.
Figure 4.

Task-related ICA activation maps FWE corrected at p < 0.05 for the whole brain mass for seed analysis with ICA ROIs C1–C7. The LFPC, IFS, and AIFO networks (bottom right) were selected for further analysis.
Figure 5.

a, Frontal cortex regions form subcomponents of distributed cortical networks. Blue represents LFPC seed; green represents IFS seed; red represents AIFO seed. FWE corrected at p < 0.05 for the whole brain mass. b, Phase sychrony and SEM for RI and NSR are presented. The RI but not the NSR contrast was associated with a global increase in phase synchrony throughout the networks. c, Schematic diagram representing analysis of activation magnitude and connectivity. The LFPC network responds to increased task difficulty in general; however both within-network and between-network connectivity increases to RI alone. Orange, Significant effect of the NSRs; purple, significant effect of RI; yellow, significant effect of NSRs and RI; gray, no significant effects. PC, Parietal cortex; IPC, inferior parietal cortex; ACC, anterior cingulate cortex; pDLFC, posterior dorsolateral prefrontal cortex; TPJ, temporopatietal junction.
The relationship between RI and network activation magnitudes
To test the hypothesis of a dedicated RI module, we examined the orthogonal contrasts of RI (inter-related minus parallel trials) and NSR (three-subrule minus two-subrule trials). Contrast values were calculated for each ROI within the two-layer graph, for each participant, and these data were examined at the group level using a GLM where the within-subject conditions were Contrast (two), Network (three), ROI (six), and Hemisphere (two). There was a significant interaction of Contrast * Network (F(2,36) = 6.98, p = 0.003), a significant main effect of Network (F(2,36) = 41.74, p < 0.001), and a significant main effect of Hemisphere (F(1,18) = 7.45, p = 0.014). One-sample t tests demonstrated that, in accordance with a role in RI, the LFPC ROIs were significantly more active during RI; however, the broader LFPC network [posterior DLPFC (pDLPFC) and parietal cortex] responded in the same manner. Furthermore, the LFPC and its associated network showed significantly greater activation when processing problems with a higher NSRs. Paired t tests were conducted to directly compare RI and NSR contrasts within this network and revealed no significant differences. Conversely, the IFS network showed significant increases in activation to NSR task manipulations only, as demonstrated by both one-sample t tests and pairwise comparisons of NSR versus RI contrasts. There were no significant main effects, interactions, or pairwise comparisons within the AIFO network (Table 2). Thus, results were consistent throughout networks and across hemispheres, which is counter to the notion of functionally unique and anatomically discrete neural modules.
Table 2.
Activation magnitudes within the three networks in response to NSR and RI task manipulations
| ROI | Number of subrules (test value, 0) |
Rule integration (test value, 0) |
Paired t test, NSRs versus RI |
|||
|---|---|---|---|---|---|---|
| t | Significance (one-tailed) | t | Significance (one-tailed) | t | Significance (two-tailed) | |
| LFPC network | ||||||
| LFPC left | 2.675 | 0.008* | 2.393 | 0.014* | −0.303 | 0.765 |
| LFPC right | 1.702 | 0.053* | 1.737 | 0.050* | 0.181 | 0.859 |
| pDLPFC left | 3.801 | 0.001* | 3.245 | 0.002* | −0.412 | 0.685 |
| pDLFPC right | 1.467 | 0.080* | 2.821 | 0.006* | −1.004 | 0.329 |
| Parietal cortex left | 3.219 | 0.003* | 2.813 | 0.006* | −0.361 | 0.722 |
| Parietal cortex right | 2.806 | 0.006* | 4.070 | 0.001* | −1.264 | 0.222 |
| IFS network | ||||||
| IFS left | 4.344 | 0.000* | 0.112 | 0.456 | 3.901 | 0.001* |
| IFS right | 3.688 | 0.001* | 0.420 | 0.339 | 2.513 | 0.022* |
| Inferior parietal cortex left | 2.436 | 0.013* | 0.608 | 0.275 | 1.686 | 0.109 |
| Inferior parietal cortex right | 2.961 | 0.004* | −0.212 | 0.417 | 2.179 | 0.043* |
| Caudate left | 1.458 | 0.081 | −0.312 | 0.379 | 1.573 | 0.133 |
| Caudate right | 0.603 | 0.277 | −0.640 | 0.265 | 0.952 | 0.354 |
The LFPC network showed increased activation during NSR and RI manipulations. The IFS showed increased activation to NSR only.
*Statistically significant at p < 0.05.
Voxelwise analyses were conducted within the whole brain using a 2 * 2 factorial design to determine whether there were any other voxels in the brain that were specifically sensitive to RI demands (Table 3; Fig. 6). The positive effect of condition (t contrast collapsed across all four conditions) rendered activation within a bilateral set of brain regions including IFS and inferior parietal cortex. The main effect of RI rendered a set of brain regions including the LFPC bilaterally. However, in accordance with the ROI analyses, a similar pattern of activation was evident for the main effect of NSRs. Contrasting RI minus NSR main effects rendered no voxels within the frontal lobes that were specifically sensitive to RI demands.
Table 3.
Peak activation coordinates for whole-brain analysis
| x | y | z | t | Region | Approximate BA |
|---|---|---|---|---|---|
| Positive effect of condition | |||||
| 32 | −88 | 4 | 13.04 | Occipital cortex (V2) right | 18 |
| −26 | −90 | −4 | 11.89 | Occipital cortex (V2) left | 18 |
| 26 | −62 | 46 | 11.72 | Superior parietal cortex right | 7 |
| 28 | 6 | 52 | 10.03 | Premotor right | 6 |
| −24 | 8 | 54 | 8.98 | Premotor left | 8 |
| −44 | 30 | 24 | 8.30 | Inferior frontal gyrus (triangularis) left | 48/45 |
| 46 | 36 | 28 | 4.11 | Inferior frontal gyrus (triangularis) right | 45 |
| −42 | 4 | 34 | 6.45 | Inferior frontal gyrus (opercularis) left | 44 |
| 50 | 12 | 26 | 5.12 | Inferior frontal gyrus (opercularis) right | 44 |
| −28 | −70 | −50 | 4.56 | Cerebellum left | Not applicable |
| General difficulty (3-subrule integrated vs 2-subrule parallel) | |||||
| 50 | −66 | 44 | 5.97 | Inferior parietal cortex right | 39 |
| −4 | 44 | 44 | 5.90 | Superior frontal gyrus midline | 9 |
| −14 | 32 | 58 | 5.11 | Frontal eye fields left | 8 |
| −42 | 48 | −8 | 4.96 | LFPC left | 47/10 |
| −2 | −62 | 34 | 4.94 | Precuneus | n/a |
| 2 | −82 | 24 | 4.56 | Cuneus | n/a |
| −58 | −44 | −8 | 4.48 | Inferior temporal gyrus left | 20 |
| −60 | −26 | 18 | 4.39 | Superior temporal sulcus left | 42 |
| 20 | −80 | −32 | 4.11 | Cerebellum right | n/a |
| −10 | 76 | −2 | 3.95 | Medial frontopolar cortex left | 10 |
| 66 | −34 | −6 | 3.58 | Middle temporal gyrus right | 21 |
| 54 | −12 | −24 | 3.48 | Inferior temporal gyrus right | 20 |
| 66 | −50 | 18 | 3.31 | Superior temporal sulcus right | 22 |
| 24 | 20 | −20 | 3.15 | LFPC right | 11 |
| −38 | −74 | 48 | 2.96 | Inferior parietal cortex left | 7 |
| −42 | −8 | −30 | 2.75 | Inferior temporal gyrus left | 20 |
| −26 | 58 | 18 | 2.74 | LFPC left | 10 |
| 54 | 38 | −2 | 2.72 | LFPC right | 45 |
| 62 | −40 | 12 | 2.63 | Superior temporal sulcus right | 42 |
| 42 | 18 | −30 | 2.61 | Temporopolar right | 38 |
| −52 | −60 | 18 | 2.60 | Inferior parietal cortex left | 39 |
| 52 | 36 | −4 | 2.58 | LFPC right | 45 |
| −2 | −42 | −32 | 2.58 | Vermis | n/a |
| 64 | −38 | 10 | 2.57 | Superior temporal sulcus right | 22 |
| −2 | 54 | 12 | 2.57 | Medial frontopolar cortex | 10 |
| The main effect of RI | |||||
| 2 | 40 | 42 | 5.52 | Superior frontal sulcus midline | 9 |
| 54 | −64 | 40 | 5.48 | Inferior parietal cortex right | 39 |
| −42 | 50 | −8 | 5.10 | LFPC left | 47/11 |
| 46 | 48 | −12 | 4.78 | LFPC right | 47 |
| 38 | 22 | 54 | 4.60 | Posterior middle frontal gyrus/DLPFC right | 9 |
| 38 | 20 | 44 | 4.46 | Posterior middle frontal gyrus/DLPFC right | 46 |
| −2 | −62 | 34 | 4.09 | Precuneus | n/a |
| −44 | −58 | 36 | 4.04 | Inferior parietal cortex left | 39 |
| −40 | 20 | 42 | 3.85 | Posterior middle frontal gyrus/DLPFC left | 46 |
| −34 | 18 | −18 | 3.68 | Temporopolar left | 38 |
| 66 | 34 | −6 | 3.57 | LFPC right | 47 |
| −38 | 14 | 56 | 3.48 | Posterior middle frontal gyrus/DLPFC left | 9 |
| −14 | 30 | 50 | 3.30 | middle frontal gyrus/DLPFC left | 9 |
| −62 | −24 | −18 | 3.29 | Inferior temporal gyrus left | 20 |
| 52 | −12 | −22 | 3.24 | Inferior temporal gyrus right | 20 |
| The main effect of the NSRs | |||||
| 2 | −82 | 22 | 5.27 | Cuneus | |
| −8 | −76 | 2 | 4.70 | Occipital cortex (lingual V1) left | 17 |
| 10 | −70 | 2 | 4.48 | Occipital cortex (lingual V1) right | 18 |
| −48 | −40 | 2 | 4.47 | Middle temporal gyrus left | 21/37 |
| −48 | −28 | 14 | 4.44 | Posterior superior temporal gyrus left | 48 |
| −50 | 22 | −10 | 4.44 | Temporopolar left | 38 |
| −14 | 32 | 58 | 4.37 | Frontal eye fields | 8 |
| −6 | 46 | 46 | 4.32 | Middle frontal gyrus/DLPFC left | 9 |
| −50 | −56 | 26 | 3.92 | Inferior parietal cortex left | 39 |
| 48 | −68 | 44 | 3.73 | Inferior parietal cortex right | 39 |
| 20 | 48 | 24 | 3.44 | Middle frontal gyrus/DLPFC right | 46 |
| 16 | 50 | 14 | 3.02 | Anterior cingulate right | 32 |
| 32 | 22 | 40 | 2.93 | Middle frontal gyrus/DLPFC left | 46 |
| 36 | −46 | −24 | 3.25 | Cerebellum | Not applicable |
| 54 | −64 | −16 | 3.16 | Posterior inferior temporal gyrus right/fusiform gyrus | 37 |
| 68 | −44 | 18 | 3.24 | Superior temporal gyrus right | 22 |
| 70 | −28 | 14 | 2.90 | Superior temporal gyrus right | 22 |
| 12 | −40 | 4 | 2.91 | Precuneus right | 27 |
Figure 6.
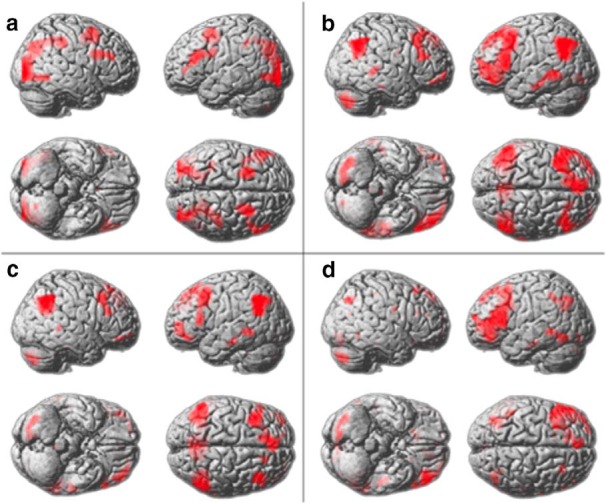
Voxelwise contrasts false-discovery rate corrected at p < 0.05 for the whole brain mass. a, Positive effect of condition. b, General difficulty (3-subrule integrated vs 2-subrule parallel problems). c, Main effect of RI. d, Main effect of NSRs. There were no differences between the main effects.
The relationship between RI and network phase synchrony
To determine whether RI involves a global increase in activation synchrony across the frontoparietal networks, we estimated the instantaneous phase of each network node using the Hilbert transform (see Materials and Methods). The instantaneous phase can be used to assess aspects of synchrony across many activation time courses and how these change with task demands. Comparing the spread of phases across the network nodes at each time point generated a time course of global phase synchrony throughout the two-tier graph. Each individual's time courses of psychological events and movement parameters were extracted from the GLMs and regressed together with a constant onto the phase synchrony time course. The resultant parameter estimates were contrasted for the RI and NSR main effects at the group level. There was a significant increase in the phase synchrony for the RI contrast (t = 2.71, p = 0.014) and no significant effect for the NSR contrast (t = −0.25, p = 0.81; Fig. 5b). There were also no significant effects for the six movement parameters on phase synchrony measures (all p > 0.1). The greater effect of RI on network connectivity was further supported when comparing directly between the RI and NSR contrasts with a paired t test (t = 2.26, p = 0.037). A second analysis examined phase synchrony in the same manner but with time courses extracted separately for all voxels within the brain. Again, there was a significant effect of RI on phase synchrony (t = 3.23, p = 0.005) and no effect of NSRs (t = −0.75, p = 0.46), demonstrating that the RI synchrony effect was widespread throughout much of the brain. When the analysis was repeated but focused only on brain regions that showed deactivation during more difficult reasoning trials (consisting primarily of sensorimotor areas), there was no significant effect of RI (t = 1.43, p = 0.17) or NSRs (t = −0.19, p = 0.86) on synchrony. That is, while there was a global increase in phase synchrony throughout frontoparietal networks and more broadly, this increase was not evident for all brain regions.
PPIs
Functional connectivity effects were examined in greater detail using PPI models focused on the RI and NSR contrasts. Unlike the phase synchronization measures, which considered all nodes simultaneously in terms of phase and so provided a global measure of connectivity, the PPI analysis considered specific connections in terms of task-related changes in inter-regional regression coefficients, either between networks and nodes or between networks. PPIs were calculated across all edges of the two-tier graph for the RI and the NSR contrasts using the LFPC, IFS, and AIFO as seed regions (see Materials and Methods). A GLM was conducted on the upper tier edges of the graph (between networks), with the conditions Contrast (two), Seed ROI (three), and Target ROI (two). There was a significant Contrast * Seed interaction (F(2,36) = 4.86, p = 0.014) and no other significant effects (all p > 0.1). One-sample t tests showed that this interaction was driven by an asymmetrical and task-specific change in connectivity with increases in the IFS → LFPC and the IFS → AIFO PPIs for RI but not for NSRs. None of the other edges within the upper tier of the graph showed significant PPI effects. Three GLMs were conducted examining connections from the upper to the lower tier of the graph for each of the three networks. Conditions were Contrast (two), ROI (two), and Hemisphere (two). Analysis of the LFPC network showed a significant main effect of Contrast (F(1,18) = 6.77, p = 0.018) and a subthreshold interaction of Contrast * Hemisphere (F(1,18) = 3.95, p = 0.062). Similarly, analysis of the IFS network showed a significant main effect of Contrast (F(1,18) = 6.98, p = 0.017) and an interaction of Contrast * Hemisphere (F(1,18) = 4.52, p = 0.048). There were no significant effects for the analysis of the AIFO network (all p > 0.1). One-sample t tests showed that these effects were driven by increased functional connectivity within the LFPC and IFS networks for the RI contrast but not for the NSR contrast (Fig. 5c; Table 4). Analysis of the within-trial PPI effects (see Materials and Methods) showed that there was a greater increase in connectivity toward the end of each trial when processing integrated relative to parallel rules. By contrast, there was no such effect when comparing trials with three minus two rules (Fig. 7). Thus, connectivity was greatest toward the end of RI trials, when rules had been identified and integrated.
Table 4.
Connectivity within and between networks in response to NSR and RI task manipulations
| Connectivity | NSRs (test value, 0) |
RI (test value, 0) |
||
|---|---|---|---|---|
| t | Significance (one-tailed) | t | Significance (one-tailed) | |
| Within networks | ||||
| LFPC | ||||
| pDLPFC left | −0.742 | 0.234 | 4.054 | 0.001* |
| pDLPFC right | 0.153 | 0.440 | 2.976 | 0.004* |
| Parietal cortex left | −0.657 | 0.260 | 2.999 | 0.004* |
| Parietal cortex right | −0.139 | 0.446 | 3.539 | 0.001* |
| AIFO | ||||
| ACC right | −0.114 | 0.456 | 0.579 | 0.285 |
| ACC left | −0.301 | 0.384 | 1.297 | 0.106 |
| Temporoparietal junction left | −0.935 | 0.181 | 0.997 | 0.166 |
| Temporoparietal junction right | −0.214 | 0.417 | 0.534 | 0.300 |
| IFS | ||||
| Inferior parietal cortex left | −0.894 | 0.192 | 1.281 | 0.108 |
| Inferior parietal cortex right | −0.676 | 0.254 | 2.125 | 0.024* |
| Caudate left | −0.123 | 0.452 | 2.638 | 0.009* |
| Caudate right | −0.880 | 0.195 | 2.927 | 0.005* |
| Between networks | ||||
| LFPC | ||||
| AIFO | −1.260 | 0.112 | 0.669 | 0.256 |
| IFS | −0.892 | 0.192 | 1.222 | 0.119 |
| AIFO | ||||
| LFPC | −0.819 | 0.212 | 1.185 | 0.126 |
| IFS | −0.026 | 0.490 | 0.609 | 0.275 |
| IFS | ||||
| LFPC | −0.717 | 0.241 | 2.307 | 0.017* |
| AIFO | −1.135 | 0.136 | 2.205 | 0.021* |
There is increased connectivity in response to the RI within the LFPC and IFS networks as well as between IFS → LFPC and IFS → AIFO networks.
*Statistically significant at p < 0.05.
Figure 7.
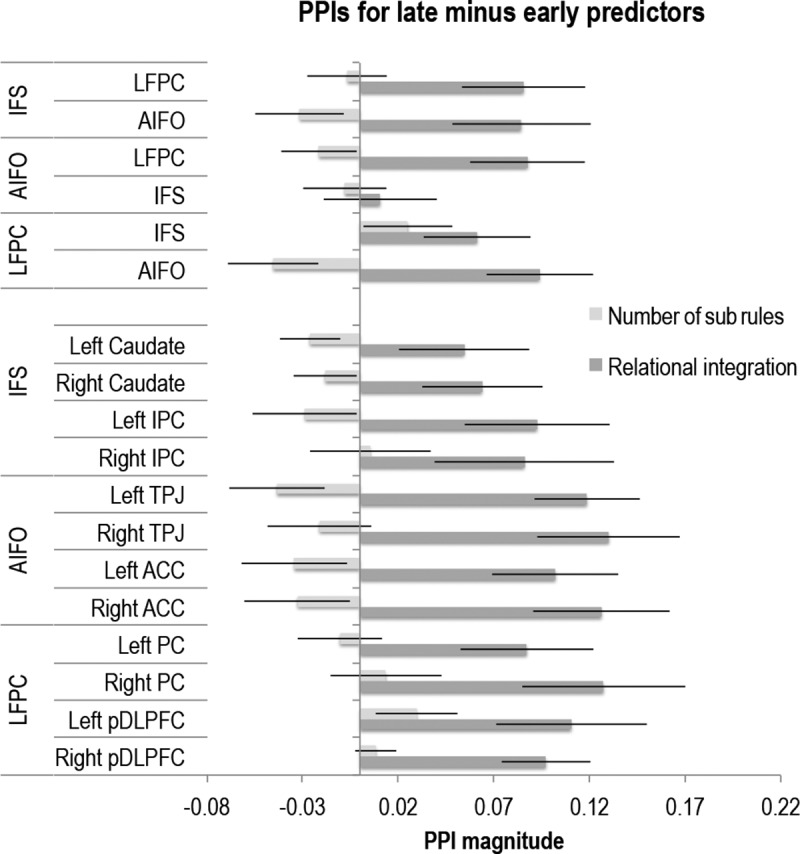
Early-to-late modulator PPI effect for RI and NSRs. There was increased functional connectivity in late versus early stages of each problem for the RI contrast but not for the NSR contrast.
Relational integration and effective connectivity
The PPI results indicated a possible asymmetry in internetwork connectivity during RI; however, while this method is optimal for examining changes in connectivity strengths in response to psychological manipulations, it is not ideal for determining directions of information flow between regions. Consequently, a pertinent question regards whether a particular region formed the source of the observed increase in connectivity. To address this question, we compared seven DCMs, which include driving psychological inputs to network nodes, connectivities between nodes, and psychological modulators of the strengths of those connections. All models were fitted to the observed activation time courses from the AIFO, IFS, and LFPC regions. Two psychological time courses were generated: one “Task” captured the onsets and durations for all four types of trials (task, 1; rest, 0); the other “RI” captured the RI contrast (inter-related, 1; parallel, −1). The models (Fig. 8) were fitted to each individual's ROI data. In all seven models, Task was applied as a driving input to all three regions and all three regions had reciprocal connections. The RI contrast formed the modulatory input in all models; however, the models differed with respect to the connection targeted by RI modulation. Specifically, in three of the models, the modulatory input was applied to both efferent connections from the LFPC, the IFS, or the AIFO node. These models tested the hypothesis that RI-related functional connectivity changes were driven directly from one network to all others. In another two models, either all of the between-node connections or none of the connections were modulated by RI to test the hypothesis that there was no specific source of RI-related functional connectivity. Finally, AIFO → IFS and IFS → LFPC connections were modulated in a “bottom-up” model and LFPC → IFS and IFS → AIFO connections were modulated in a “top-down” model to test the hypothesis that RI functional connectivity is propagated through a hierarchical arrangement of networks. Bayesian model selection with fixed effects analysis clearly favored the top-down model (Fig. 8), supporting a hierarchical interaction between frontoparietal networks during RI with the LFPC as the ultimate source. Three further models were compared focusing on connections between ROIs (collapsed across hemisphere) within the LFPC network to test the hypothesis that within this network it is the LFPC that drives RI functional connectivity. In the three models, Task was the driving input to all nodes and all nodes were connected with RI modulating all connections, just the bottom-up connections, or just the top-down connections (Fig. 9). In accordance with the internetwork analysis, Bayesian model selection with fixed effects analysis favored the top-down intranetwork model.
Figure 8.

DCM of internetwork connections. Bayesian model selection with fixed effects analysis (right) favored the “top-down” model (7) in which RI modulated connectivity from anterior to posterior regions of the frontal cortex, with the LFPC acting upon IFS and IFS acting upon the AIFO.
Figure 9.

DCM of intranetwork connections. Comparison of models of connectivity within the LFPC network using Bayesian model selection with fixed effects analysis favored a model (3) in which RI modulated top-down connections from LFPC → pDLPFC and pDLPFC → parietal cortex over models in which bottom-up or all connections were modulated.
Discussion
This study examined the relative validity of the modular, globalist, and network perspectives on the neural basis of RI by applying a combination of neuroimaging methods that measure different aspects of brain activity and connectivity. As opposed to favoring any of these apparently disparate models, the results demonstrated how aspects of each can be reconciled within an alternative framework, which captures the interactions of distributed frontoparietal networks.
Notably, the modular perspective of RI is largely based on neuroimaging studies that have reported increases in LFPC activity during tasks designed to target RI processes (Christoff et al., 2001, 2003; Kroger et al., 2002; Wendelken et al., 2008; Bunge et al., 2009). These studies have typically applied mass-univariate analyses that do not capture network dynamics because they treat activations in different regions independently. The modular perspective is further supported by the observation that damage to LFPC is associated with impairments in tasks involving RI (Duncan et al., 1995; Waltz et al., 1999; Krawczyk et al., 2008). Together, this suggests that LFPC is both “active during” and “necessary for” RI, fulfilling a central tenet of cognitive neuroscience for associating a function with a region. However, although this relationship provides support for a critical involvement of LFPC in RI, it does not necessarily equate to proof of a discrete and dedicated LFPC module.
Interestingly, the globalist perspective is largely based on the same function-to-region mapping approach; however, it considers how a common pattern of frontoparietal brain activation is observed during a broader range of cognitive tasks, which are often assumed to be distinct (Duncan and Owen, 2000). Based on this observation, the globalist perspective proposes that domain-general cortex (Cole and Schneider, 2007; Seeley et al., 2007; Duncan, 2010) rapidly adapts to support whichever task is currently being undertaken. Electrophysiology research supports this interpretation, because neurons within the domain-general cortex adapt to selectively represent task-relevant information, including stimulus dimensions, rules, and responses (Freedman et al., 2001; Miller and Cohen, 2001; Stokes et al., 2013).
Here, when we applied a similar mass-univariate mapping approach, the results clearly supported the globalist perspective. Specifically, while we observed significant activation within the LFPC in response to RI, the LFPC also responded when the number of nonintegrated subrules increased. Furthermore, other frontoparietal brain regions showed a similar response to RI demands. This result accords poorly with the hypothesis of a dedicated LFPC module. However, it does not necessarily follow that the frontal and parietal cortices house a functionally homogeneous domain-general resource; nor is it necessarily the case that RI is a proxy for more general cognitive processes.
There is growing evidence that the frontoparietal cortices house multiple functionally distinct networks, each supporting a different aspect of cognition. These networks are evident when applying data-driven analyses to extract spatial components from fluctuations in regional activation at rest (Smith et al., 2009), during task performance (Dosenbach et al., 2007; Erika-Florence et al., 2014), or from task-rest activation patterns under different task conditions (Poldrack, 2011; Hampshire et al., 2012c). In close accordance, applying ICA to activation time courses from within the lateral frontal cortices delineated multiple distinct subregions. Each subregion formed part of a different large-scale network and these networks corresponded closely with those reported previously. Furthermore, the sensitivity of each network to the task manipulations was quite distinct, which accords with the view that they support different aspects of cognition.
For example, the LFPC network, which includes the putative RI module, responded to both RI and NSR manipulations. The observation of a broader role in cognition for this network accords with previous studies in which we have reported similar activation patterns during contingency reversal learning (Hampshire and Owen, 2006; Hampshire et al., 2012a, 2012b) and spatial planning (Williams-Gray et al., 2007; Grant et al., 2013; Hampshire et al., 2013). Notably, low-level demands, such as stimulus discriminability, which has no explicit hierarchical control component, can also activate the LFPC (Reynolds et al., 2012; Fedorenko et al., 2013; Crittenden and Duncan, 2014).
In direct contrast, the AIFO network was insensitive to both RI and NSR manipulations. This result is partially supported by Fedorenko, Duncan, and Kanwisher (Fedorenko et al., 2013), who reported only a weak multiple-demand pattern in the left ACC across a number of task difficulty manipulations. The observation of the AIFO's relative insensitivity to reasoning demands also replicates our previous work, from which we have reported that analogical reasoning, rule complexity, grammatical complexity, and spatial planning, all activate other frontoparietal areas, yet have little impact on AIFO activation (Hampshire et al., 2011, 2012c). Conversely, the AIFO activates more strongly than the IFS in response to simple attentional and motor control demands, including target detection, attentional switching, working memory maintenance, and response inhibition (Hampshire and Owen, 2006; Hampshire et al., 2007, 2010; Erika-Florence et al., 2014). Thus, engaging in an effortful task may be sufficient to recruit the AIFO network, while the complexity of the reasoning processes has a more pronounced effect on dorsal and anterior frontal lobe areas.
Unexpectedly, the IFS network responded to the NSR, but not to the RI, manipulation. The observed sensitivity to NSR demands replicates our previous studies, where we have reported strong IFS-inferior parietal cortex activation in response to spatial manipulations, complex nonverbal reasoning problems, and, more generally, tasks that require the mental transformation of stimulus inputs (Hampshire et al., 2012b,c). However, the dissociation in the context of LFPC activation indicates that the NSR and RI manipulations most likely tap different neural processes.
In stronger support of this view, only RI demands modulated network dynamics, increasing phase synchrony and cross-correlation within the graph of frontoparietal networks. Unexpectedly, the phase synchrony analysis conducted across all voxels showed a global increase in connectivity during RI. This result may be interpreted as a global decrease in network metastability; however, it was not significant for all networks. For example, there was no significant effect within regions that were deactivated during performance of the task relative to rest, including the default mode network. Moreover, the strength of the PPI effect was differential across the lateral frontal cortices, being nonsignificant for the AIFO network, and varied across each individual RI trial, being greatest during the latter half when subrules had been identified and were being integrated.
The DCM analyses added further insight into the basis of the functional-connectivity results. Specifically, Bayesian model selection indicated that the global change in network connectivity during RI was best explained by a change in top-down effective connectivity from the LFPC, via the IFS and to the AIFO. Similar top-down effects were evident when contrasting DCMs of the lateral orbitofrontal cortex network ROIs alone. This top-down flow accords with, but also extends, studies that have proposed a hierarchical organization within the human frontal cortices (Koechlin et al., 2003; Ramnani and Owen, 2004; Hampshire et al., 2007; Badre and D'Esposito, 2007, 2009). Therefore, cognitive control would appear to be an emergent property of multiple networks, comprising a hierarchically organized domain-general system.
Our results lead us to propose a tentative account for the novel observation of increased network connectivity during RI. During the performance of complex tasks, the subrules that form distinct components of the task may be differentially encoded across anatomically distinct nodes of the domain-general networks. While in accordance with the globalist perspective, an increase in the NSRs, or other increases in difficulty, lead to the recruitment of more network nodes, which can be activated in a relatively independent manner within the temporal domain. When the rules that these nodes support are closely interrelated, as is the case for RI problems in the current study, these distinct nodes must work in a more coherent manner, leading to an increase in the correlations of the activation time courses. Thus complex cognitive functions, such as relational reasoning, which comprise the amalgamation of subcomponent processes, require the dynamic binding of items within the global workspace. From this perspective, the effect that we observe may be analogous to the “communication by coherence” theory of perceptual binding (Fries, 2005), where phase-locked gamma oscillations in disparate visual cortical regions are believed to integrate distinct stimulus features and are enhanced during attention (Bosman et al., 2012). While previous studies have also shown greater frontoparietal synchrony during conjunctive compared with nonconjunctive feature search using EEG (Phillips et al., 2012), here we present evidence that increased temporal synchrony mediates integration of information for higher-level cognitive processes too. This hypothesis accords well with some computational models, which have proposed that binding through synchrony may enable the dynamic and transient representation of higher-level inter-relationships (Hummel and Holyoak, 1997; Knowlton et al., 2012). Future studies, using electrophysiology/MEG techniques with higher temporal resolution should be applied to further elucidate the oscillatory basis of the effects reported here. Relatedly, an important future direction is to examine the RI effect in the context of individual differences in intelligence and as a potential functional anatomical marker of executive dysfunction (Williams-Gray et al., 2007; Chamberlain et al., 2008; Hampshire et al., 2013).
Footnotes
This work was supported by Medical Research Council Grant U1055.01.002.00001.01 and European Research Grant PCIG13-GA-2013-618351. B.L.P. undertook this study as part of a master's thesis project under the supervision of A.H. at the Medical Research Council Cognition and Brain Sciences Unit in Cambridge University.
The authors declare no competing financial interests.
This is an Open Access article distributed under the terms of the Creative Commons Attribution License Creative Commons Attribution 4.0 International, which permits unrestricted use, distribution and reproduction in any medium provided that the original work is properly attributed.
References
- Badre D, D'Esposito M. Functional magnetic resonance imaging evidence for a hierarchical organization of the prefrontal cortex. J Cogn Neurosci. 2007;19:2082–2099. doi: 10.1162/jocn.2007.19.12.2082. [DOI] [PubMed] [Google Scholar]
- Badre D, D'Esposito M. Is the rostro-caudal axis of the frontal lobe hierarchical? Nat Rev Neurosci. 2009;10:659–669. doi: 10.1038/nrn2667. [DOI] [PMC free article] [PubMed] [Google Scholar]
- Bosman CA, Schoffelen JM, Brunet N, Oostenveld R, CoBastos AM, Womelsdorf T, Rubehn B, Stieglitz T, De Weerd P, Fries P. Attentional stimulus selection through selective synchronization between monkey visual areas. Neuron. 2012;75:875–888. doi: 10.1016/j.neuron.2012.06.037. [DOI] [PMC free article] [PubMed] [Google Scholar]
- Braga RM, Sharp DJ, Leeson C, Wise RJ, Leech R. Echoes of the brain within default mode, association, and heteromodal cortices. J Neurosci. 2013;33:14031–14039. doi: 10.1523/JNEUROSCI.0570-13.2013. [DOI] [PMC free article] [PubMed] [Google Scholar]
- Brett M, Anton J, Valabregue R, Poline J. Region of interest analysis using an SPM toolbox. 8th International conference on functional mapping of the human brain; Sendai, Japan. 2002. [Google Scholar]
- Bullmore E, Sporns O. Complex brain networks: graph theoretical analysis of structural and functional systems. Nat Rev Neurosci. 2009;10:186–198. doi: 10.1038/nrn2575. [DOI] [PubMed] [Google Scholar]
- Bunge SA, Wendelken C, Badre D, Wagner AD. Analogical reasoning and prefrontal cortex: evidence for separable retrieval and integration mechanisms. Cereb Cortex. 2005;15:239–249. doi: 10.1093/cercor/bhh126. [DOI] [PubMed] [Google Scholar]
- Bunge SA, Helskog EH, Wendelken C. Left, but not right, rostrolateral prefrontal cortex meets a stringent test of the relational integration hypothesis. Neuroimage. 2009;46:338–342. doi: 10.1016/j.neuroimage.2009.01.064. [DOI] [PMC free article] [PubMed] [Google Scholar]
- Chamberlain SR, Menzies L, Hampshire A, Suckling J, Fineberg NA, del Campo N, Aitken M, Craig K, Owen AM, Bullmore ET, Robbins TW, Sahakian BJ. Orbitofrontal dysfunction in patients with obsessive-compulsive disorder and their unaffected relatives. Science. 2008;321:421–422. doi: 10.1126/science.1154433. [DOI] [PubMed] [Google Scholar]
- Christoff K, Prabhakaran V, Dorfman J, Zhao Z, Kroger JK, Holyoak KJ, Gabrieli JD. Rostrolateral prefrontal cortex involvement in relational integration during reasoning. Neuroimage. 2001;14:1136–1149. doi: 10.1006/nimg.2001.0922. [DOI] [PubMed] [Google Scholar]
- Christoff K, Ream JM, Geddes LP, Gabrieli JD. Evaluating self-generated information: anterior prefrontal contributions to human cognition. Behav Neurosci. 2003;117:1161–1168. doi: 10.1037/0735-7044.117.6.1161. [DOI] [PubMed] [Google Scholar]
- Cole MW, Schneider W. The cognitive control network: integrated cortical regions with dissociable functions. Neuroimage. 2007;37:343–360. doi: 10.1016/j.neuroimage.2007.03.071. [DOI] [PubMed] [Google Scholar]
- Crittenden BM, Duncan J. Task difficulty manipulation reveals multiple demand activity but no frontal lobe hierarchy. Cereb Cortex. 2014;24:532–540. doi: 10.1093/cercor/bhs333. [DOI] [PMC free article] [PubMed] [Google Scholar]
- Dosenbach NU, Fair DA, Miezin FM, Cohen AL, Wenger KK, Dosenbach RA, Fox MD, Snyder AZ, Vincent JL, Raichle ME, Schlaggar BL, Petersen SE. Distinct brain networks for adaptive and stable task control in humans. Proc Natl Acad Sci U S A. 2007;104:11073–11078. doi: 10.1073/pnas.0704320104. [DOI] [PMC free article] [PubMed] [Google Scholar]
- Duncan J. The multiple-demand (MD) system of the primate brain: mental programs for intelligent behaviour. Trends Cogn Sci. 2010;14:172–179. doi: 10.1016/j.tics.2010.01.004. [DOI] [PubMed] [Google Scholar]
- Duncan J. The structure of cognition: attentional episodes in mind and brain. Neuron. 2013;80:35–50. doi: 10.1016/j.neuron.2013.09.015. [DOI] [PMC free article] [PubMed] [Google Scholar]
- Duncan J, Owen AM. Common regions of the human frontal lobe recruited by diverse cognitive demands. Trends Neurosci. 2000;23:475–483. doi: 10.1016/S0166-2236(00)01633-7. [DOI] [PubMed] [Google Scholar]
- Duncan J, Burgess P, Emslie H. Fluid intelligence after frontal lobe lesions. Neuropsychologia. 1995;33:261–268. doi: 10.1016/0028-3932(94)00124-8. [DOI] [PubMed] [Google Scholar]
- Erika-Florence M, Leech R, Hampshire A. A functional network perspective on response inhibition and attentional control. Nat Commun. 2014;5:4073. doi: 10.1038/ncomms5073. [DOI] [PMC free article] [PubMed] [Google Scholar]
- Fedorenko E, Duncan J, Kanwisher N. Broad domain generality in focal regions of frontal and parietal cortex. Proc Natl Acad Sci U S A. 2013;110:16616–16621. doi: 10.1073/pnas.1315235110. [DOI] [PMC free article] [PubMed] [Google Scholar]
- Freedman DJ, Riesenhuber M, Poggio T, Miller EK. Categorical representation of visual stimuli in the primate prefrontal cortex. Science. 2001;291:312–316. doi: 10.1126/science.291.5502.312. [DOI] [PubMed] [Google Scholar]
- Fries P. A mechanism for cognitive dynamics: neuronal communication through neuronal coherence. Trends Cogn Sci. 2005;9:474–480. doi: 10.1016/j.tics.2005.08.011. [DOI] [PubMed] [Google Scholar]
- Friston KJ, Harrison L, Penny W. Dynamic causal modelling. Neuroimage. 2003;19:1273–1302. doi: 10.1016/S1053-8119(03)00202-7. [DOI] [PubMed] [Google Scholar]
- Grant JE, Odlaug BL, Chamberlain SR, Hampshire A, Schreiber LR, Kim SW. A proof of concept study of tolcapone for pathological gambling: relationships with COMT genotype and brain activation. Eur Neuropsychopharmacol. 2013;23:1587–1596. doi: 10.1016/j.euroneuro.2013.07.008. [DOI] [PubMed] [Google Scholar]
- Hampshire A, Owen AM. Fractionating attentional control using event-related fMRI. Cereb Cortex. 2006;16:1679–1689. doi: 10.1093/cercor/bhj116. [DOI] [PubMed] [Google Scholar]
- Hampshire A, Duncan J, Owen AM. Selective tuning of the blood oxygenation level-dependent response during simple target detection dissociates human frontoparietal subregions. J Neurosci. 2007;27:6219–6223. doi: 10.1523/JNEUROSCI.0851-07.2007. [DOI] [PMC free article] [PubMed] [Google Scholar]
- Hampshire A, Chamberlain SR, Monti MM, Duncan J, Owen AM. The role of the right inferior frontal gyrus: inhibition and attentional control. Neuroimage. 2010;50:1313–1319. doi: 10.1016/j.neuroimage.2009.12.109. [DOI] [PMC free article] [PubMed] [Google Scholar]
- Hampshire A, Thompson R, Duncan J, Owen AM. Lateral prefrontal cortex subregions make dissociable contributions during fluid reasoning. Cereb Cortex. 2011;21:1–10. doi: 10.1093/cercor/bhq085. [DOI] [PMC free article] [PubMed] [Google Scholar]
- Hampshire A, Chaudhry AM, Owen AM, Roberts AC. Dissociable roles for lateral orbitofrontal cortex and lateral prefrontal cortex during preference driven reversal learning. Neuroimage. 2012a;59:4102–4112. doi: 10.1016/j.neuroimage.2011.10.072. [DOI] [PMC free article] [PubMed] [Google Scholar]
- Hampshire A, Parkin BL, Cusack R, Espejo DF, Allanson J, Kamau E, Pickard JD, Owen AM. Assessing residual reasoning ability in overtly noncommunicative patients using fMRI. Neuroimage Clin. 2012b;2:174–183. doi: 10.1016/j.nicl.2012.11.008. [DOI] [PMC free article] [PubMed] [Google Scholar]
- Hampshire A, Highfield RR, Parkin BL, Owen AM. Fractionating human intelligence. Neuron. 2012c;76:1225–1237. doi: 10.1016/j.neuron.2012.06.022. [DOI] [PubMed] [Google Scholar]
- Hampshire A, MacDonald A, Owen AM. Hypoconnectivity and hyperfrontality in retired American football players. Sci Rep. 2013;3:2972. doi: 10.1038/srep02972. [DOI] [PMC free article] [PubMed] [Google Scholar]
- Hellyer PJ, Shanahan M, Scott G, Wise RJ, Sharp DJ, Leech R. The control of global brain dynamics: opposing actions of frontoparietal control and default mode networks on attention. J Neurosci. 2014;34:451–461. doi: 10.1523/JNEUROSCI.1853-13.2014. [DOI] [PMC free article] [PubMed] [Google Scholar]
- Hummel JE, Holyoak KJ. Distributed representations of structure: a theory of analogical access and mapping. Psychol Rev. 1997;104:427–466. doi: 10.1037/0033-295X.104.3.427. [DOI] [Google Scholar]
- Knowlton BJ, Morrison RG, Hummel JE, Holyoak KJ. A neurocomputational system for relational reasoning. Trends Cogn Sci. 2012;16:373–381. doi: 10.1016/j.tics.2012.06.002. [DOI] [PubMed] [Google Scholar]
- Koechlin E, Ody C, Kouneiher F. The architecture of cognitive control in the human prefrontal cortex. Science. 2003;302:1181–1185. doi: 10.1126/science.1088545. [DOI] [PubMed] [Google Scholar]
- Krawczyk DC. The cognition and neuroscience of relational reasoning. Brain Res. 2012;1428:13–23. doi: 10.1016/j.brainres.2010.11.080. [DOI] [PubMed] [Google Scholar]
- Krawczyk DC, Morrison RG, Viskontas I, Holyoak KJ, Chow TW, Mendez MF, Miller BL, Knowlton BJ. Distraction during relational reasoning: the role of prefrontal cortex in interference control. Neuropsychologia. 2008;46:2020–2032. doi: 10.1016/j.neuropsychologia.2008.02.001. [DOI] [PubMed] [Google Scholar]
- Kroger JK, Sabb FW, Fales CL, Bookheimer SY, Cohen MS, Holyoak KJ. Recruitment of anterior dorsolateral prefrontal cortex in human reasoning: a parametric study of relational complexity. Cereb Cortex. 2002;12:477–485. doi: 10.1093/cercor/12.5.477. [DOI] [PubMed] [Google Scholar]
- Laird AR, Rogers BP, Carew JD, Arfanakis K, Moritz CH, Meyerand ME. Characterizing instantaneous phase relationships in whole-brain fMRI activation data. Hum Brain Mapp. 2002;16:71–80. doi: 10.1002/hbm.10027. [DOI] [PMC free article] [PubMed] [Google Scholar]
- Miller EK, Cohen JD. An integrative theory of prefrontal cortex function. Annu Rev Neurosci. 2001;24:167–202. doi: 10.1146/annurev.neuro.24.1.167. [DOI] [PubMed] [Google Scholar]
- Palva JM, Monto S, Kulashekhar S, Palva S. Neuronal synchrony reveals working memory networks and predicts individual memory capacity. Proc Natl Acad Sci U S A. 2010;107:7580–7585. doi: 10.1073/pnas.0913113107. [DOI] [PMC free article] [PubMed] [Google Scholar]
- Penn DC, Holyoak KJ, Povinelli DJ. Darwin's mistake: explaining the discontinuity between human and nonhuman minds. Behav Brain Sci. 2008;31:109–130. doi: 10.1017/S0140525X08003543. discussion 130–178. [DOI] [PubMed] [Google Scholar]
- Phillips S, Takeda Y, Singh A. Visual feature integration indicated by phase-locked frontal-parietal EEG signals. PLoS One. 2012;7:e32502. doi: 10.1371/journal.pone.0032502. [DOI] [PMC free article] [PubMed] [Google Scholar]
- Poldrack RA. Inferring mental states from neuroimaging data: from reverse inference to large-scale decoding. Neuron. 2011;72:692–697. doi: 10.1016/j.neuron.2011.11.001. [DOI] [PMC free article] [PubMed] [Google Scholar]
- Ramnani N, Owen AM. Anterior prefrontal cortex: insights into function from anatomy and neuroimaging. Nat Rev Neurosci. 2004;5:184–194. doi: 10.1038/nrn1343. [DOI] [PubMed] [Google Scholar]
- Reynolds JR, O'Reilly RC, Cohen JD, Braver TS. The function and organization of lateral prefrontal cortex: a test of competing hypotheses. PLoS One. 2012;7:e30284. doi: 10.1371/journal.pone.0030284. [DOI] [PMC free article] [PubMed] [Google Scholar]
- Seeley WW, Menon V, Schatzberg AF, Keller J, Glover GH, Kenna H, Reiss AL, Greicius MD. Dissociable intrinsic connectivity networks for salience processing and executive control. J Neurosci. 2007;27:2349–2356. doi: 10.1523/JNEUROSCI.5587-06.2007. [DOI] [PMC free article] [PubMed] [Google Scholar]
- Smith SM, Fox PT, Miller KL, Glahn DC, Fox PM, Mackay CE, Filippini N, Watkins KE, Toro R, Laird AR, Beckmann CF. Correspondence of the brain's functional architecture during activation and rest. Proc Natl Acad Sci U S A. 2009;106:13040–13045. doi: 10.1073/pnas.0905267106. [DOI] [PMC free article] [PubMed] [Google Scholar]
- Sporns O, Tononi G, Kötter R. The human connectome: a structural description of the human brain. PLoS Comput Biol. 2005;1:e42. doi: 10.1371/journal.pcbi.0010042. [DOI] [PMC free article] [PubMed] [Google Scholar]
- Stephan KE, Penny WD, Moran RJ, den Ouden HE, Daunizeau J, Friston KJ. Ten simple rules for dynamic causal modeling. Neuroimage. 2010;49:3099–3109. doi: 10.1016/j.neuroimage.2009.11.015. [DOI] [PMC free article] [PubMed] [Google Scholar]
- Stokes MG, Kusunoki M, Sigala N, Nili H, Gaffan D, Duncan J. Dynamic coding for cognitive control in prefrontal cortex. Neuron. 2013;78:364–375. doi: 10.1016/j.neuron.2013.01.039. [DOI] [PMC free article] [PubMed] [Google Scholar]
- Tzourio-Mazoyer N, Landeau B, Papathanassiou D, Crivello F, Etard O, Delcroix N, Mazoyer B, Joliot M. Automated anatomical labeling of activations in SPM using a macroscopic anatomical parcellation of the MNI MRI single-subject brain. Neuroimage. 2002;15:273–289. doi: 10.1006/nimg.2001.0978. [DOI] [PubMed] [Google Scholar]
- Vincent JL, Kahn I, Snyder AZ, Raichle ME, Buckner RL. Evidence for a frontoparietal control system revealed by intrinsic functional connectivity. J Neurophysiol. 2008;100:3328–3342. doi: 10.1152/jn.90355.2008. [DOI] [PMC free article] [PubMed] [Google Scholar]
- Waltz JA, Knowlton BJ, Holyoak KJ, Boone KB, Fred S, Santos MDM, Thomas CR, Miller BL. A system for relational reasoning in human relational reasoning in prefrontal cortex. Psychol Sci. 1999;10:119–125. doi: 10.1111/1467-9280.00118. [DOI] [Google Scholar]
- Wendelken C, Nakhabenko D, Donohue SE, Carter CS, Bunge SA. “Brain is to thought as stomach is to?” investigating the role of rostrolateral prefrontal cortex in relational reasoning. J Cogn Neurosci. 2008;20:682–693. doi: 10.1162/jocn.2008.20055. [DOI] [PubMed] [Google Scholar]
- Williams-Gray CH, Hampshire A, Robbins TW, Owen AM, Barker RA. Catechol O-methyltransferase Val158Met genotype influences frontoparietal activity during planning in patients with Parkinson's disease. J Neurosci. 2007;27:4832–4838. doi: 10.1523/JNEUROSCI.0774-07.2007. [DOI] [PMC free article] [PubMed] [Google Scholar]
- Yarkoni T, Poldrack RA, Nichols TE, Van Essen DC, Wager TD. Large-scale automated synthesis of human functional neuroimaging data. Nat Methods. 2011;8:665–670. doi: 10.1038/nmeth.1635. [DOI] [PMC free article] [PubMed] [Google Scholar]