

Abstract
How Purkinje cell (PC) activity may be altered by learning is central to theories of the cerebellum. Pavlovian eyelid conditioning, because of how directly it engages the cerebellum, has helped reveal many aspects of cerebellar learning and the underlying mechanisms. Theories of cerebellar learning assert that climbing fiber inputs control plasticity at synapses onto PCs, and thus PCs control the expression of learned responses. We tested this assertion by recording 184 eyelid PCs and 240 non-eyelid PCs during the expression of conditioned eyelid responses (CRs) in well trained rabbits. By contrasting the responses of eyelid and non-eyelid PCs and by contrasting the responses of eyelid PCs under conditions that produce differently timed CRs, we test the hypothesis that learning-related changes in eyelid PCs contribute to the learning and adaptive timing of the CRs. We used a variety of analyses to test the quantitative relationships between eyelid PC responses and the kinematic properties of the eyelid CRs. We find that the timing of eyelid PC responses varies systematically with the timing of the behavioral CRs and that there are differences in the magnitude of eyelid PC responses between larger-CR, smaller-CR, and non-CR trials. However, eyelid PC activity does not encode any single kinematic property of the behavioral CRs at a fixed time lag, nor does it linearly encode CR amplitude. Even so, the results are consistent with the hypothesis that learning-dependent changes in PC activity contribute to the adaptively timed expression of conditioned eyelid responses.
Keywords: amplitude, cerebellum, eyelid conditioning, Purkinje cell, tetrode recording, timing
Introduction
As the principal neurons of the cerebellar cortex Purkinje cells (PCs) figure prominently in the computational and learning capabilities of the cerebellum. PC activity and its modulation are central to theories of cerebellar function, most of which assert that plasticity at parallel fiber synapses onto PCs, as controlled by climbing fiber inputs, contributes to the cerebellum's capacity for learning (Eccles et al., 1967; Marr, 1969; Albus, 1971; Ito, 1972; Raymond et al., 1996; Mauk and Donegan, 1997). Delay eyelid conditioning experiments provide evidence in general support of these theories. For example, the cerebellar cortex is necessary for the acquisition and extinction of conditioned responses (CRs; Perrett and Mauk, 1995; Garcia et al., 1999; Medina et al., 2002), and climbing fibers convey a teaching input (Simpson and Alley, 1974; McCormick et al., 1985; Mauk et al., 1986; Yeo et al., 1986, Sears and Steinmetz, 1991; Graf et al., 1988; Stone and Lisberger, 1990; Raymond and Lisberger, 1998).
As compelling a picture as these data may paint, understanding cerebellar contributions to learning also requires the more direct and quantitative evidence provided by recording PC activity during the acquisition and expression of learned responses. PC recordings during adaptation of the vestibulo-ocular reflex (Raymond and Lisberger, 1996, 1997, 1998), smooth pursuit learning (Medina and Lisberger, 2008), and for saccade adaptation (Fushiki et al., 1994) are excellent examples. Given the inherent control over stimuli and behavior that is provided by eyelid conditioning studies, understanding PC activity during eyelid conditioning should provide important insights into cerebellar mechanisms of learning, computation, and timing.
Past experiments have examined PC responses during expression of conditioned eyelid responses, but in each case with limitations that mitigate their ability to address core tenets of cerebellar theories. Such theories, for example, are only accountable to data from PCs whose climbing fiber inputs are activated by the unconditioned stimulus (US) used for training. Previous recordings from awake, behaving animals have sorted recordings based on response properties, but not by this criterion (Berthier and Moore, 1986; Gould and Steinmetz, 1996; Kotani et al., 2003; Green and Steinmetz, 2005). Hesslow and Ivarsson (1994) and others (Jirenhed et al., 2007; Rasmussen et al., 2008; Svensson et al., 2010; Jirenhed and Hesslow, 2011a,b) have identified PCs whose climbing fibers were activated by the US, but these studies are limited by the lack of behavioral responses.
We have recorded the responses of eyelid PCs, those with climbing fiber inputs that are activated by the US, during different interstimulus intervals (ISIs) to produce differently timed CRs (Schneiderman and Gormezano, 1964; Millenson et al., 1977; Mauk and Ruiz, 1992; Green and Steinmetz, 2005). From these data, we investigate the relationships between eyelid PC responses and various kinematic properties of the conditioned eyelid responses. We find that eyelid PC activity relates to CR timing and amplitude but does not encode directly a specific kinematic property of the eyelid responses, nor does it linearly encode CR amplitude. These results support the hypotheses that learning-dependent changes in PC activity contribute to the expression and adaptive timing of the conditioned eyelid responses.
Materials and Methods
Subjects.
The subjects were nine male New Zealand albino rabbits (Oryctolagus cuniculus; Myrtle's Rabbitry) weighing 2–3 kg at experiment onset. Treatment of rabbits and surgical procedures were in accordance with National Institutes of Health guidelines and an institutionally approved animal welfare protocol. All rabbits were maintained on a 12 h light/dark cycle.
Surgery.
One week before the start of recording, rabbits were removed from the home cage and anesthetized with a mixture of acepromazine (1.5 mg/kg) and ketamine (45 mg/kg). After onset of anesthesia animals were placed in a stereotaxic frame, intubated, and maintained on isoflurane (1∼2% mixed in oxygen) for the remainder of the surgery. Under sterile conditions, the skull was exposed with a midline incision (∼5 cm), and four holes were drilled for screws that anchored the head bolt in place. The animal's head was then positioned with lambda 1.5 mm ventral to bregma and a craniotomy was drilled out at 5.9 mm posterior and 6.0 mm lateral to lambda. The skull surface was marked and skull fragments were carefully removed from the craniotomy along with the dura matter under visual guidance. A custom-made hyperdrive array (12 tetrodes, 2 references; except one animal with 16 tetrodes and 2 references) fitted with an electronic interface board [(EIB)-54 or EIB-36-16TT; Neuralynx] was implanted in the left anterior lobe of the cerebellar cortex at 17.8 mm ventral to lambda. The drive was positioned at a 40° angle caudal to vertical to avoid the cerebellar tentorium. This region of the anterior lobe has been shown to be involved in acquisition and expression of well timed conditioned eyelid responses (Garcia et al., 1999; Kalmbach et al., 2010); therefore, tetrodes targeted PCs receiving evoked complex spikes from eyelid stimulation, which should be located within this region of cerebellar cortex. The bundle cannula of the hyperdrive was lowered to the surface of the brain and the craniotomy was sealed with low viscosity silicon (Kwik-Sil; World Precision Instruments). A screw attached to a coated silver grounding wire (0.003 inch bare, 0.0055 inch coated, A-M Systems) was then screwed into the skull. The silver wire was also attached to the ground of the EIB with a gold pin. The head bolt, screws, and hyperdrive were secured with dental acrylic (Bosworth Fastray, Pink; Harry J. Bosworth Company), and the skin was sutured where the skull and muscle was exposed. Finally, two stainless steel stimulating electrodes were implanted subdermally caudal and rostral to the left eye. Rabbits were given analgesics and antibiotics for 2 d after surgery and monitored until fully recovered.
Recording and unit isolation.
Each independently movable tetrode was comprised of four nichrome wires (12 μm diameter; Kanthal Palm Coast), twisted, and then heated so that the insulation partially melts together to form a tetrode. Individual wires of each tetrode were connected to the EIB with gold pins, all four wires of the reference tetrodes were connected to a single channel of the EIB. Each tetrode was gold plated to reduce final impedance to 0.5–1.5 MΩ measured at 1 kHz (impedance tester IMP-1; Bak Electronics). During surgery, the tetrodes were placed over the left anterior lobe of the cerebellar cortex and advanced to within 2.0 mm of the target during surgery using stereotaxic guidance. After recovery from surgery, each tetrode was lowered in 40 μm increments during turning sessions (∼1 h) until at least one stable single unit was identified, although there were often multiple units on a single tetrode. The tetrodes were allowed to stabilize for 24 h and units were checked again before recording and behavioral training commenced.
Neuronal signals were first preamplified at unity-gain. The signals were then fit to a window between 250 and 2000 μV and bandpass filtered (0.3–6 kHz; Neuralynx). Neural signals that exceeded a channel amplitude threshold were digitized and stored at 32 kHz (Cheetah system, Neuralynx). A custom interactive cluster-cutting program was used to isolate and identify single units. Waveform characteristics were plotted as a two-dimensional scatter plot of one wire of the tetrode versus another in terms of energy, peak, and valley measures. The energy measure represents the square root of the sum of the squared points for the entire waveform. The peak measure is the maximum height (positive amplitude) of the waveform. The valley measure is the maximum depth (negative amplitude) of the waveform. A late peak measure, defined as the maximum peak during the last five points of the 32 points that make up each waveform, was also used to identify the later peak component of the complex spikes from the earlier peak of the simple spikes. From these cluster-cutting analyses, a single PC recording would then yield two clusters, one containing simple spikes cut using peak, valley, and energy, and the second containing the complex spikes cut using the late peak parameter.
The procedure for identifying and categorizing PCs is represented in Figure 2. Putative PCs were initially identified by their higher baseline firing-rate relative to other cerebellar cortical interneurons and later confirmed by identifying the presence of both simple and complex spikes during cluster cutting. PCs were isolated from other units and from the US artifact with cluster cutting, which allows for separation of single units based on different features of the waveforms (peak, valley, energy) across the four channels of the tetrode. An example of this process is shown Figure 2B, which depicts a PC cluster (red) another unit (green) and the US artifact (top, right, white dots). Figure 2C then shows how the red cluster from Figure 2B could be split into two clusters using the late peak parameter, separating the complex spikes (purple cluster and waveforms) and the simple spikes (red cluster and waveforms). A final step was used to confirm that the two clusters were indeed simple and complex spikes and that they were produced by the same PC. This involved producing a spike-triggered average of the putative simple spikes triggered off the putative complex spikes. Only those pairs that showed the well known 30–40 ms pause in simple-spike activity following a complex spike were considered PCs and included in further analysis, an example is shown in Figure 2D. Finally, PCs were categorized as eyelid PCs if they showed short-latency complex spikes elicited by the US as shown in Figures 2D–F. The latencies of the complex spikes were measured from the first pulse of the US (see Fig. 2F,G) and complex spikes were considered “short-latency” if they occurred within the first two 10 ms time bins following US onset. The remaining PCs were considered “non-eyelid.” Recordings where the unit was lost any time during the session were not included in the analysis.
Figure 2.

A summary of tetrode recording sites and of the criteria used to identify and classify PCs from these recordings. A, Perisaggital sections of the cerebellum showing the location of all PC recordings in the cerebellar cortex. Red dots indicate sites of eyelid PC recordings; black dots indicate sites of non-eyelid PC recordings. Scale bar, 2.0 mm. B–G, Criteria used to categorize PCs as eyelid or non-eyelid involved identifying the complex spikes and determining whether or not they were activated by the US. B, An example of how single units (red and green clusters) were isolated from the multiunit recording and US artifact (top right, white dots) using the initial peak feature of the waveforms. C, After isolation of single units using the initial peak feature a PC recording would usually further separate into two distinct clusters using the late peak feature of the waveforms. The late peak feature isolated the classic simple spikes (red cluster and waveforms) from the late positive response characteristic of a PC complex spike (purple cluster and waveforms). D, To determine whether the simple and complex spikes so identified were from the same PC a complex spike-triggered average of the simple spikes was done to verify the characteristic 30–40 ms pause in simple spikes that follows a complex spike. E, Multiunit continuous recording from cerebellar cortex showing an isolated PC with simple spikes indicated with red dots and complex spikes with blue dots. The top recording shows a spontaneous complex spike and the bottom recording shows complex spikes elicited by the US (US artifact = 50 ms). The peristimulus histograms and raster plots shown in F and G represent the complex spike activity for this PC. Once clusters met these complex spike criteria, raster plots were used to determine whether the complex spikes for each PC were activated by the US. F, G, These raster plots and peristimulus histograms (10 ms bins) are from the same PC from a session involving training at two [ISI 250 (F) and ISI 700 (G)] ISIs. PCs identified with these criteria were classified as eyelid PCs based on the strong climbing fiber response to the US and non-eyelid PCs if the US did not evoke climbing fiber responses. In this and subsequent figures the duration of CS presentation is indicated by the gray shading, and the US presentation by the black arrow.
Conditioning procedure.
Conditioning experiments and recordings were done in custom training chambers (89 × 64 × 49 cm). Rabbits were placed in a plastic restrainer and the ears were stretched over a foam pad and taped down to limit head movement. An infrared emitter/detector was attached to the head bolt and aligned to the middle (between then canthi) of the upper left eyelid. The eyelid detectors were constructed using an infrared light emitting diode and an infrared detector (Radio Shack, part no. 276-142 for both). The detector was positioned snuggly inside of a 2 cm segment of a 1 cc syringe. The syringe was covered in black electrical tape so that light could enter only from the end opposite the infrared detector. The infrared LED was positioned next to the syringe barrel so that both the LED and the barrel were aimed at the same point, ∼1.5 cm from the tip of the syringe barrel. These properties bathe the eye in infrared light and restrict the field-of-view of the infrared detector to a circle just larger than the rabbit eye. The amount of light arriving at the detector increases as the eyelids close and this is reflected by changes in the output voltage of the device (−10 to 10 V).
The response was amplified to yield a signal that was linearly related to eyelid position (±0.1 mm), as confirmed by dual recordings using the infrared detector and a linear potentiometer attached to the upper eyelid (Ryan et al., 2006). The fact that the recorded signals accurately reflect the position of the upper eyelid, despite the likelihood that the detector is influenced by both eyelids, probably stems from how the eyelids move in unison during these responses. The gain of the eyelid position detector was then calibrated by delivering a test US to elicit maximum eyelid closure (defined as 6.0 mm, typical for an adult rabbit). The corresponding voltage deflection (∼6 V) was then divided by 6 mm to obtain a calibrated mm/V calibration.
Each training chamber was also equipped with a speaker connected to a stereo equalizer and receiver which were connected to a computer that generated the tone conditioned stimulus (CS). The CS used during training was either a 1 or 9.5 kHz sinusoidal tone (85 dB), which ramped at onset and offset with a 5 ms time constant to avoid audible clicks from the speaker. To deliver the US, leads from a stimulus isolator (Model 2100, A-M Systems) were attached to electrodes caudal and rostral to the eye. The US was eyelid stimulation, which consisted of trains of 1 ms current pulses delivered at 100 Hz for 50 ms (5 pulses total; see Fig. 2F). The intensity was adjusted for each animal to be just above threshold to elicit a full eyelid closure (between 0.8 and 3.0 mA, depending on the condition of the implanted wires).
Stimulus presentation was controlled by custom software written in Visual Basic and run on a Windows-based computer. To permit temporal alignment of neural and behavioral responses, digital timing pulses were generated by the computer controlling stimuli and measuring behavior and were sent to the digital input port on the Digital Lynx acquisition system (Neuralynx). During initial paired-delay conditioning, the tone CS was 550 ms which coterminated with the 50 ms eyelid stimulation US, which produced an ISI of 500 ms. All rabbits were initially trained with delay conditioning at ISI 500. Rabbits were also trained with standard paired-delay conditioning with ISIs of 200, 250, and 700 ms. Two other types of delay conditioning were also used, one in which rabbits received two different CSs trained at different ISIs (CS1 at ISI 200 or 250 and CS2 at ISI 700) on the same session to produce differently timed CRs to each CS. The other training paradigm included conditioning with a single CS at two different ISIs (CS1 at ISI 200 and CS1 at 700) on the same session to produce double-peaked CRs on the ISI 700 trials; this paradigm is known as temporal uncertainty (Millenson et al., 1977; Choi and Moore, 2003; Freeman et al., 2003). Trials were presented in pseudorandom order during these two mixed-delay paradigms. Each training session consisted of 12 nine-trial blocks (108 trials) with each block starting with a CS alone trial followed by eight paired CS–US trials. The mean intertrial interval was 30 s with a range of 20–40 s. Each rabbit was trained with multiple extinction (CS alone) and reacquisition sessions to obtain many PC recordings from each animal under different training paradigms. The number and quality of recordings from each animal determined how many sessions were run; therefore, each animal did not receive the same training sequence.
Data analysis
Following cluster cutting, all subsequent data analysis was performed using custom-written scripts in MATLAB.
Eyelid data analysis.
For each trial, 2500 ms of eyelid position (200 ms pre-CS, 2300 ms post-CS) were collected at 1 kHz and at 12 bit resolution. Data were stored to a computer disk for subsequent off-line analysis. Eyelid position data were passed through a low-pass filter. Response measures calculated for each trial included CR amplitude, latency to CR criterion, and latency to CR onset. CR amplitude was defined as the value of eyelid position from the baseline at the time of US onset. Latency to CR criterion was defined as the time point at which the CR reached the 0.3 mm criterion to be designated as a CR. Latency to CR onset was determined using a custom-written two-step algorithm. The first step was designed to detect the initial deflection away from the pre-CS baseline, whereas the second step used linear interpolation to determine the exact time of CR onset. For further analyses, eyelid trajectories were truncated at US onset to exclude noncerebellar influence on the eyelid movement.
Single unit data analysis.
Instantaneous firing rate of each PC was estimated on every trial using a one-sided Gaussian kernel with a 25 ms SD window. We chose to use a one-sided Gaussian to prevent neural responses related to the US from contaminating PC activity during the CS. For every PC the firing rate was normalized by the value of the baseline firing-rate during 1500 ms of pre CS activity. Figure 1 shows Z-scores computed from peristimulus histograms compared with instantaneous firing rate for PC data collected at ISI 250 and temporal uncertainty training. Peristimulus histograms of single-unit activity were created using 10 ms bins. Instantaneous firing rate provided more precise temporal PC data relative to peristimulus histograms and was therefore used for analysis. For calculation of Z-scores the mean and SD were calculated from 1500 ms of pre-CS baseline activity. For each training paradigm, Z-score values as a function of time were used to calculate the proportion of PCs showing a significant (p < 0.01) increase or decrease from the baseline activity. Figures 4B–8B show the proportion of PCs that had significant Z-score increases or decreases calculated from the instantaneous firing rate from each training paradigm, with mean and SD also calculated from 1500 ms of pre-CS activity.
Figure 1.
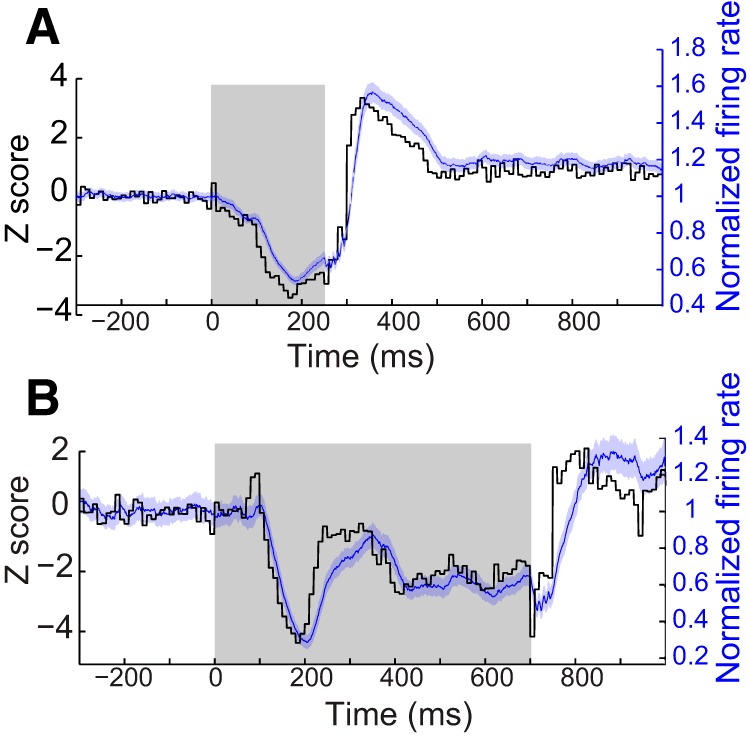
Example recordings from two PCs illustrating the relationship between peristimulus histograms and the firing rate approximation used in the present analyses. A, B, Two different PCs under different behavioral conditions. For each, the black trace represents a Z-score normalized peristimulus histogram with 10 ms time bins, whereas the blue trace represents an approximation of instantaneous firing rate, calculated using a half Gaussian kernel with 1 ms sampling. For this and all subsequent figures, the shaded region for the firing rate measure represents 95% confidence intervals. There are only small differences between the two measures, mostly when the neural response changes very rapidly.
Figure 4.
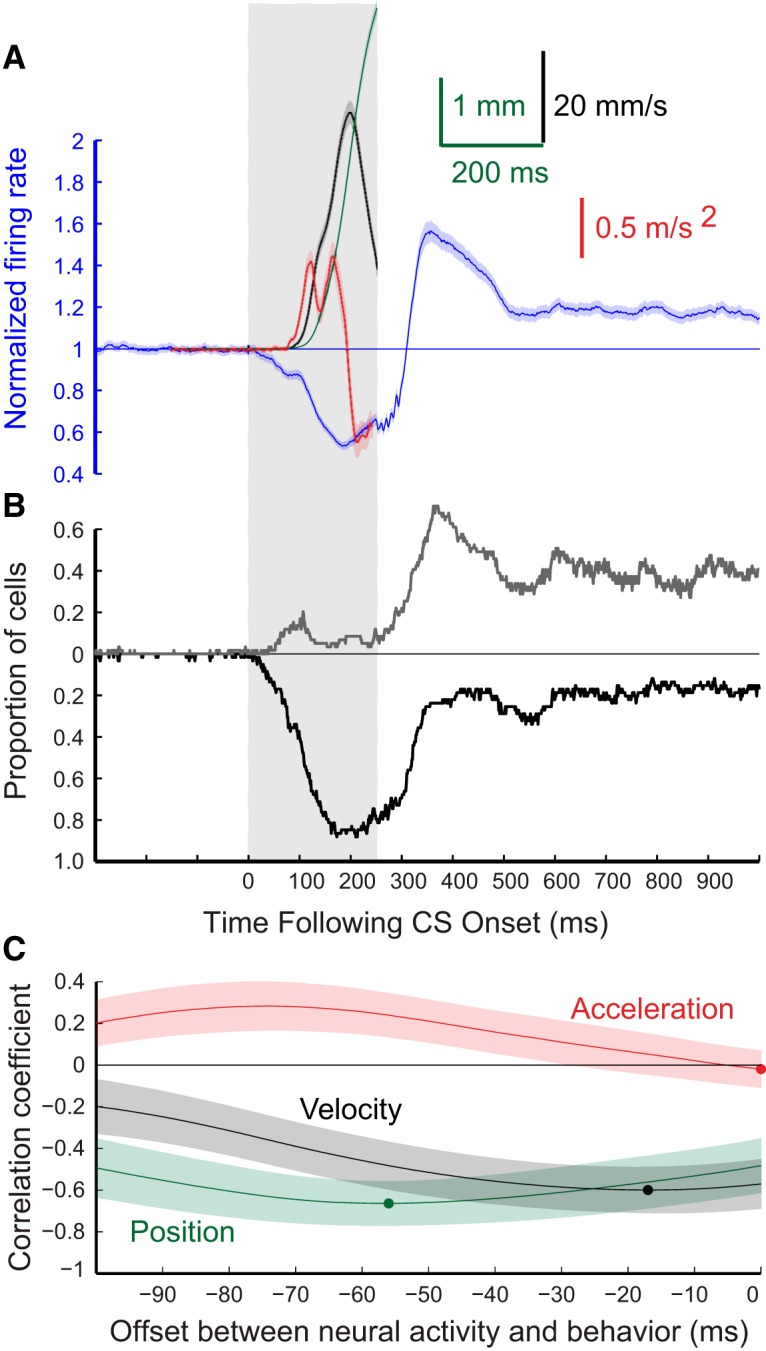
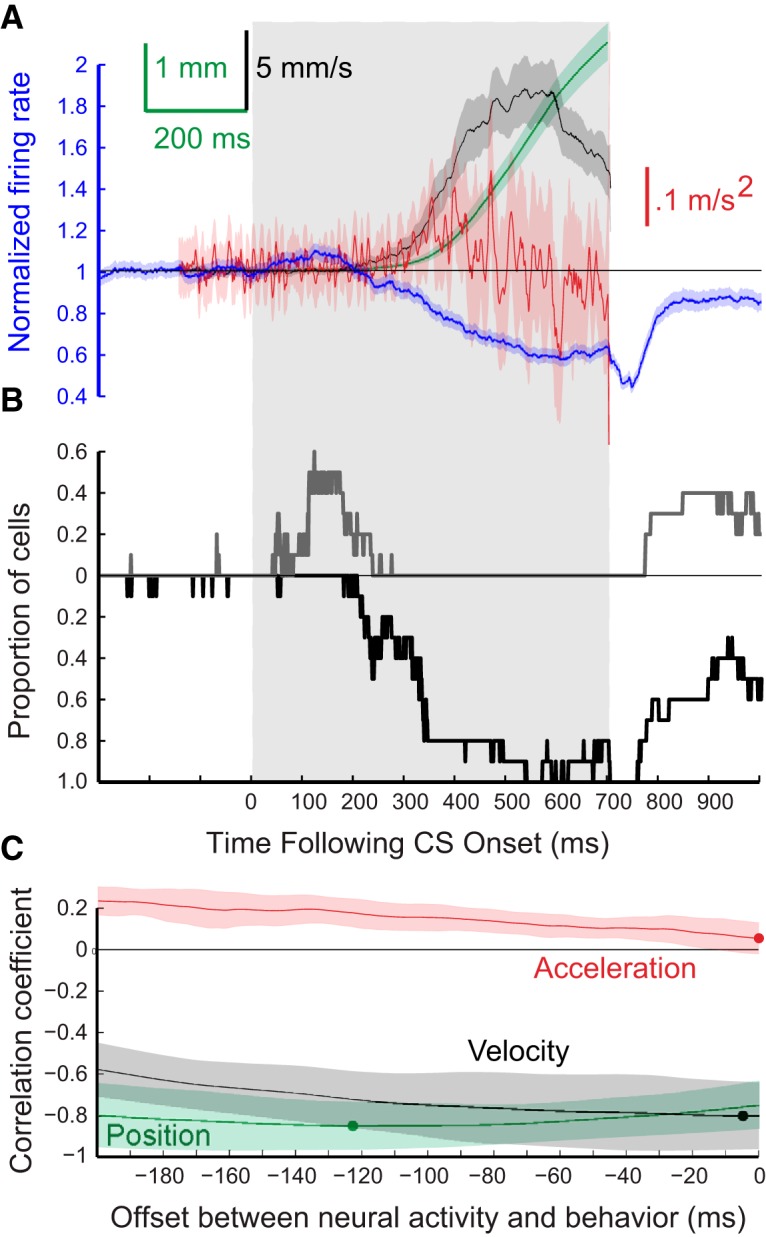
Grouped results for eyelid CRs and for the responses of the 48 eyelid PCs from three rabbits recorded during expression of conditioned eyelid responses where the ISI was 200 ms. A, Average PC activity (blue trace) and three measures of the eyelid CRs that were recorded at the same time. Green trace represents eyelid position, the black trace represents eyelid velocity, and the red trace represents eyelid acceleration. In each case, the shaded region of the trace shows the 95% confidence intervals for that measure. The gray rectangle indicates the time during which the tone CS was present. B, This graph displays for each 1 ms time bin the proportion of the 48 eyelid PCs that showed a significant deviation from background activity (Z-score with p < 0.01) during the 200 ms ISI conditioning trials. The black trace shows the proportion of cells with a significant decrease from background activity during that time bin and the gray trace shows the proportion of the same cells with a significant increase in activity during that time bin. C, Results of three separate cross-correlation analyses comparing the average PC activity during the 200 ms ISI training trials, and either average eyelid position (green), eyelid velocity (black), or eyelid acceleration (red). The dot on each trace shows the time of peak negative correlation value between PC activity and that eyelid response measure.
Figure 5.
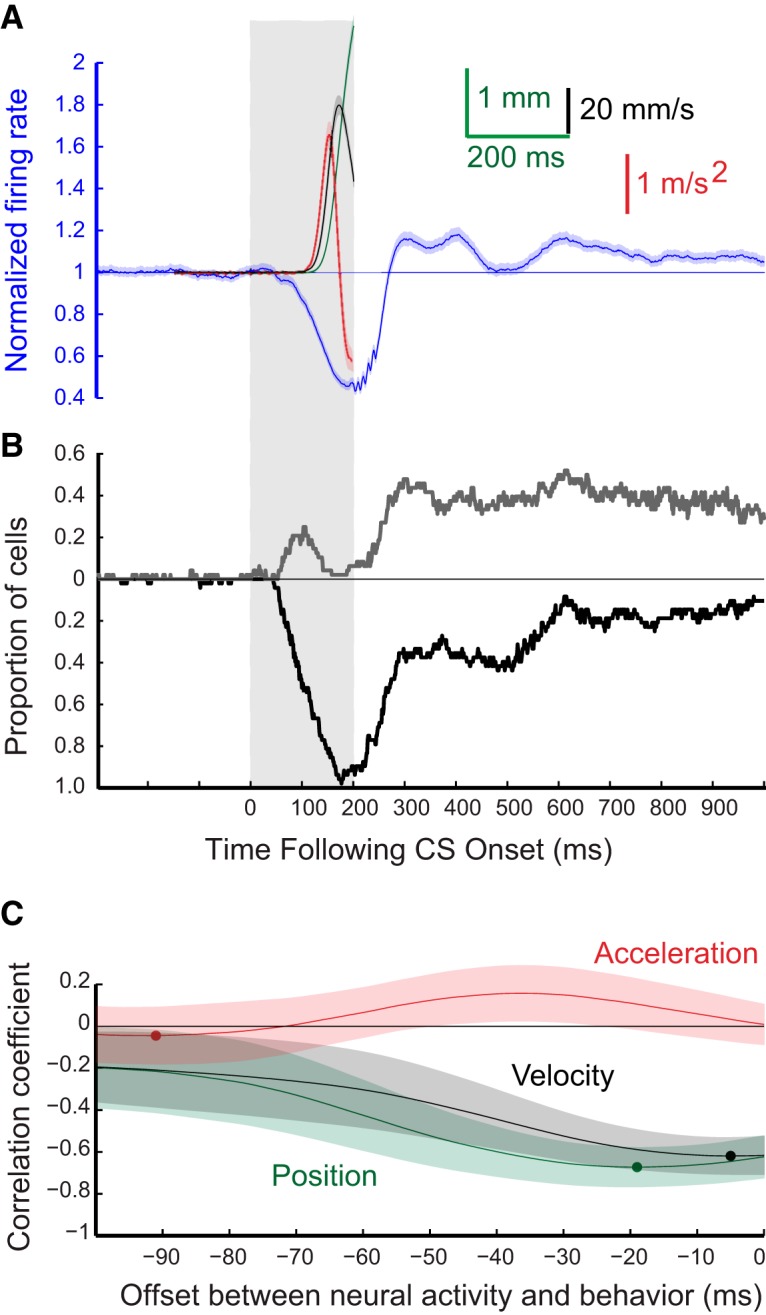
Grouped results for eyelid CRs and for the responses of the 53 eyelid PCs from four rabbits recorded during expression of conditioned eyelid responses where the ISI was 250 ms. The formatting of this figure is the same as Figure 4. A, Average PC activity (blue trace) and three measures of the eyelid CRs that were recorded at the same time. Blue trace, average PC activity; green trace, eyelid position; black trace, eyelid velocity; red trace, eyelid acceleration. B, Proportion of PCs for this group showing significant decreases in activity (black trace) or increases in activity (gray trace) for each 1 ms time bin. C, Results of three cross-correlation analyses comparing average PC activity and either average eyelid position (green), eyelid velocity (black), or eyelid acceleration (red).
Figure 6.
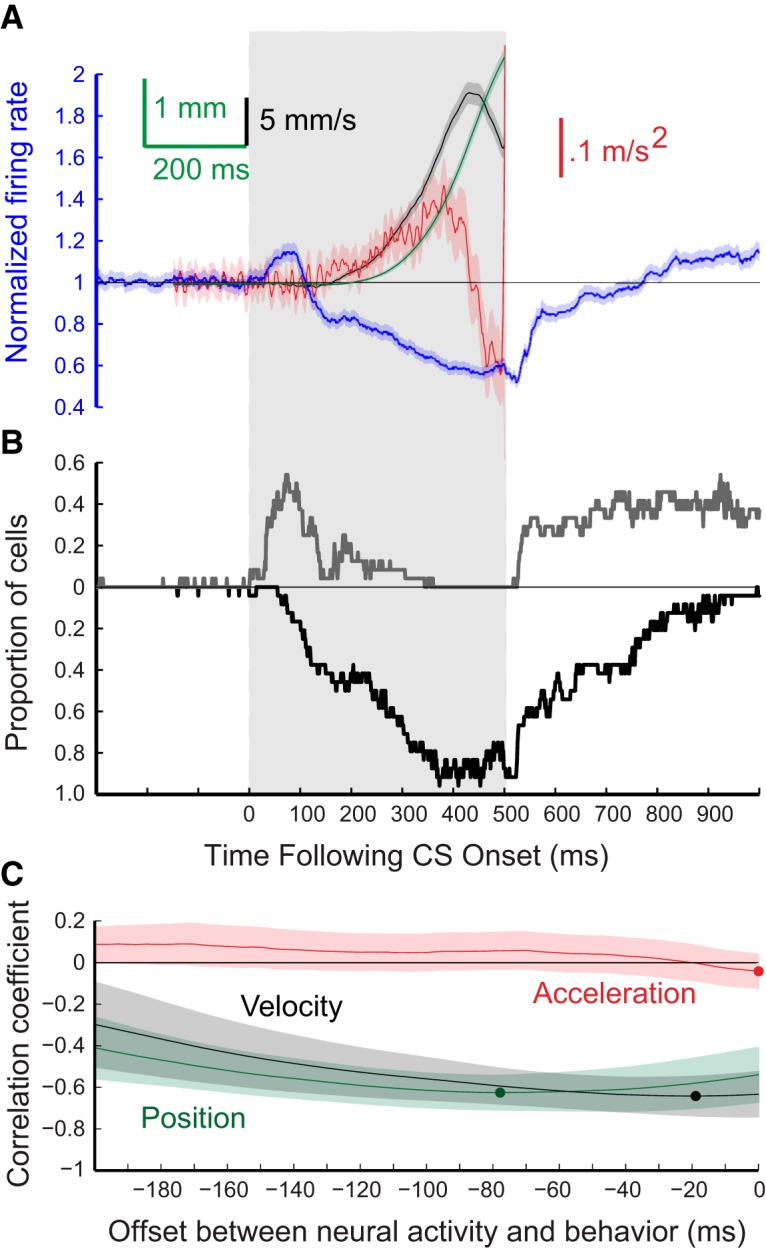
Grouped results for eyelid CRs and for the responses of the 24 eyelid PCs from five rabbits recorded during expression of conditioned eyelid responses where the ISI was 500 ms. The formatting of this figure is the same as Figure 4. A, Average PC activity (blue trace) and three measures of the eyelid CRs that were recorded at the same time. Blue trace, average PC activity; green trace, eyelid position; black trace, eyelid velocity; red trace, eyelid acceleration. B, Proportion of PCs for this group showing significant decreases in activity (black trace) or increases in activity (gray trace) for each 1 ms time bin. C, Results of three cross-correlation analyses comparing average PC activity and either average eyelid position (green), eyelid velocity (black), or eyelid acceleration (red).
Figure 7.
Grouped results for eyelid CRs and for the responses of the 10 eyelid PCs from one rabbit recorded during expression of conditioned eyelid responses where the ISI was 700 ms. The formatting of this figure is the same as Figure 4. A, Average PC activity (blue trace) and three measures of the eyelid CRs that were recorded at the same time. Blue trace, average PC activity; green trace, eyelid position; black trace, eyelid velocity; red trace, eyelid acceleration. B, Proportion of PCs for this group showing significant decreases in activity (black trace) or decreases in activity (gray trace) for each 1 ms time bin. C, Results of three cross-correlation analyses comparing average PC activity and either average eyelid position (green), eyelid velocity (black), or eyelid acceleration (red).
Figure 8.
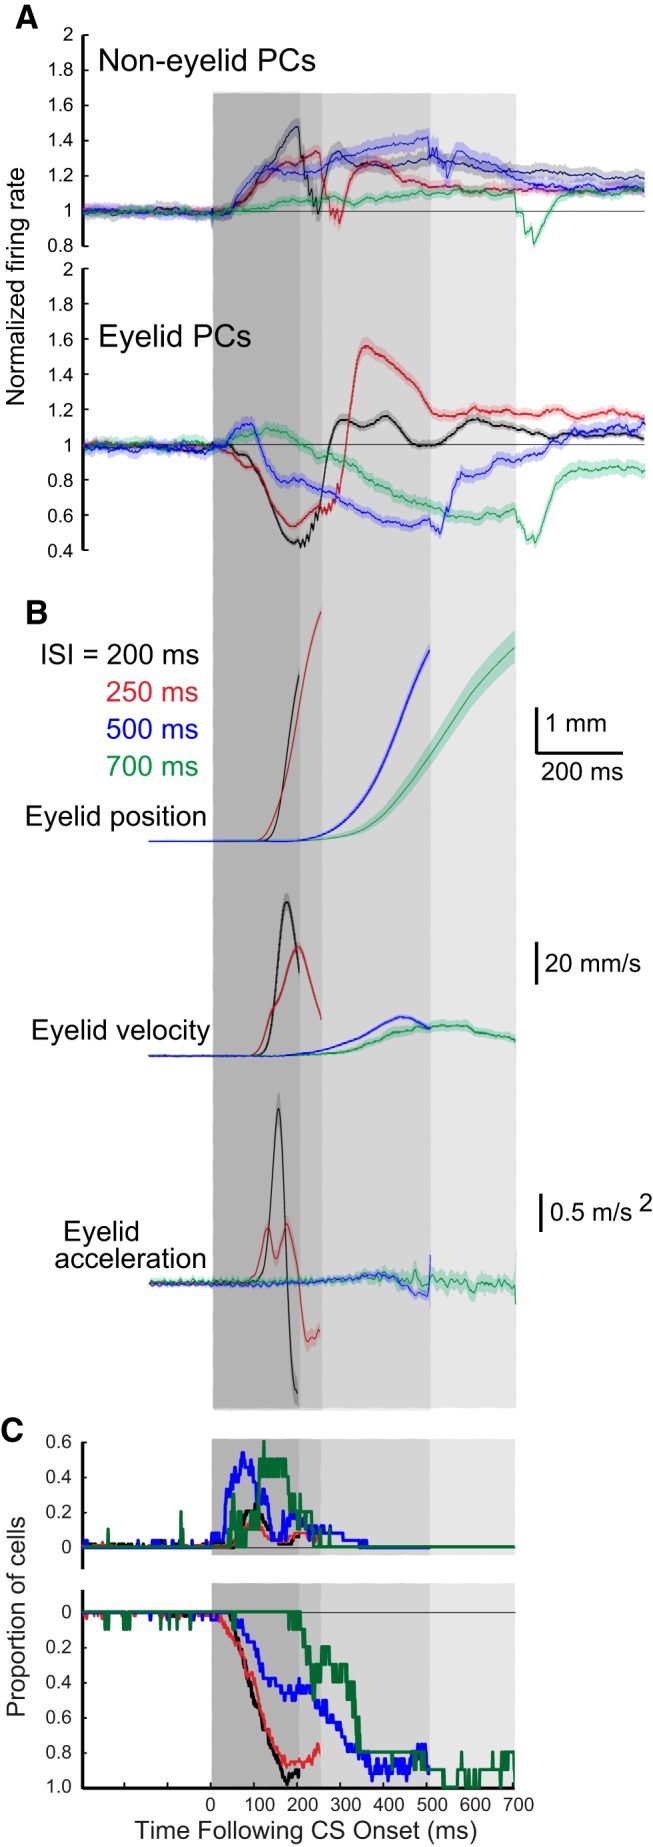
Averaged PC activity and different kinematic measures of conditioned eyelid responses for training using four different ISIs (black = 200 ms, red = 250 ms, blue = 500 ms, green = 700 ms). The differently shaded gray regions show the CS duration for the four ISIs. The darkest region shows the 200 ms ISI, this region plus the next darkest region show the 250 ms ISI, this region and the next darkest shows the 500 ms ISI, etc. A, Average PC activity for non-eyelid (top) PCs and eyelid (bottom) PCs for the four different ISIs. B, Three different kinematic measures of the average conditioned eyelid responses expressed during the PC activity shown in A. For the eyelid PCs shown in A and all of the sweeps shown in B, these are the same sweeps shown in Figures 4A, 5A, 6A, and 7A combined. C, Average proportion of PCs showing significant decreases or increases in activity for the four different ISIs. For each ISI the traces are truncated at the time of each corresponding US onset for better visibility. Together, these panels show the differences in the CRs that are acquired with training at the four different ISIs and how PC activity differs during the expression of these responses.
For every PC with US-evoked complex spikes, cross-correlations were calculated between the normalized firing rate averaged through the session and averaged session kinematic variables of the eyelid (position, velocity, and acceleration). Cross-correlations were calculated using kinematic variables starting from CS onset to exclude any influence of baseline position of the eyelid and also to isolate the learned component of the response. The MATLAB function corrcoef was implemented for computation of all cross-correlations.
Grouping.
To further investigate how PCs control the onset and amplitude of conditioned eyelid responses, data from each ISI and training paradigm were divided into equal subgroups of trials by CR onset in relation to CS onset or by CR amplitude. Data from PCs was divided with respect to CR onset and amplitude to further differentiate PC activity during CRs with different onsets and amplitudes within a given training paradigm and not just across paradigms. For each ISI, the data for each subgroup was divided equally so the same percentage of trials exists within each CR onset range or amplitude range. A few exceptions to dividing the data within each ISI equally were unavoidable and mostly involved the percentage of data in the group representing the non-CR trials within each paradigm. Dividing the data with respect to CR onset involved aligning each trial by CS onset and sorting the behavioral data into equal groups with respect to the CR onset time. Subgroup eyelid and PC data were then averaged within each training paradigm along with non-CR trials and overlaid to investigate how PC activity relates to differently timed CRs within each ISI. Dividing the data within each training paradigm with respect to CR amplitude involved aligning each trial by CR onset and sorting the behavioral data into equal subgroups with respect to CR amplitude above pre-CS baseline. Subgroup eyelid and PC data were then averaged within each training paradigm and overlaid to investigate how PC activity relates to CRs with different amplitudes within each ISI. The absence of overlap in 95% confidence intervals in between groups of PCs activity was used as an evidence of reliable separation.
Histology.
After the conclusion of experiments the final tetrode placement was determined by making small marking lesions by passing 10 μA of anodal DC current for 10 s through tetrodes which yielded data. Animals were killed with an overdose of sodium pentobarbital and perfused intracardially with 0.9% saline (∼1.0 L) followed by 10% formalin (∼1.0 L). Heads were postfixed in formalin for at least 3 d after which tetrodes were removed and the brains were extracted. Brains were then cryoprotected in 30% sucrose in formalin for 3 d, embedded in an albumin gelatin mixture, and the cerebellum was sectioned using a freezing microtome at 40 μm sections. Tissue was mounted on slides and stained with cresyl violet, sections were then examined to determine the final location of each tetrode, and this depth was compared with depth records from turning sessions to identify the location of PC recordings (Fig. 2).
Results
PC classification and location of recording sites
We analyzed 424 single-unit PC recordings obtained from nine rabbits. PCs were recorded on 61 of 112 total tetrodes (12 tetrodes per animal for 8 animals, 16 tetrodes for the 9th). Tetrodes were moved multiple times to locate new cells after a recording was lost. From these tetrode recordings, a single-unit recording was classified as a PC based on the presence of the classic and readily identifiable simple and complex spikes (Fig. 2B,C). During cluster-cutting complex spikes were distinguished by the characteristic late positive-going component to the waveform (Fig. 2C). Once a cluster was identified as the candidate PC in this manner, a complex spike-triggered average of the candidate simple spikes was used as a further verification that (1) the complex spikes had been identified correctly, and (2) that both simple and complex spikes were from the same PC. These criteria were verified by the presence of the characteristic pause in simple spikes immediately following a complex spike, an example of which is shown in Figure 2D.
Each PC so identified was then classified as either an eyelid- or a non-eyelid PC based on a single criterion: whether the presentation of the US elicited short-latency complex spikes (Fig. 2E–G). This involved the construction of a peristimulus histogram of the complex spikes as shown in Figure 2F,G. Examples of raw recordings showing spontaneous and US-evoked complex spikes is depicted in Figure 2E. Eyelid PCs often responded within 20 ms (i.e., in the first two 10 ms time bins) to the first stimulation pulse of the US with a complex spike (Fig. 2E–G), similar to previous reports (Green and Steinmetz, 2005; Jirenhed et al., 2007; Svensson et al., 2010). There was often a burst of two or more complex spikes in response to the eyelid stimulation US (Fig. 2E–G). A previous study that mapped periocular regions containing eyelid PCs in lobule HVI, which were primarily caudal, dorsal, and medial in relation to the present PC recordings, found evoked complex spikes with slightly longer latencies of 13–17 ms (Mostofi et al., 2010). Recordings that passed this criterion were classified as eyelid PCs, the remaining PCs were classified as non-eyelid. An unknown percentage of US-elicited complex spikes may have been masked by the stimulus artifact of the second and third pulses of the US. This means that the peristimulus histograms of complex spikes, such as those shown in Figure 2F,G may underrepresent the actual number of US-elicited complex spikes; specifically, those occurring 9.5–12 ms after the first US pulse. This did not preclude the ability to categorize PCs as eyelid or non-eyelid. Dropping some complex spikes could not, for example, result in incorrectly categorizing a non-eyelid PC as an eyelid PC. It could conceivably result in incorrectly categorizing an “eyelid” PC as non-eyelid only under the circumstances that the majority of the US-elicited complex spikes occurred with a latency between 9.5 and 12 ms. The subsequent analyses, however, are inconsistent with the non-eyelid PC group being contaminated by eyelid PCs.
Based on these criteria, 184 units were classified as eyelid PCs and 240 PCs were classified as non-eyelid. The non-eyelid PCs recorded during ISI 700 during temporal uncertainty and dual CS/ISI are not reported. These two categories of cells were analyzed separately throughout.
Recording sites of eyelid PCs were clustered for the most part around the primary fissure and were found in deeper parts of lobules HVI and HV of the anterior lobe, often in the sulcus that extended most caudally toward the deep nuclei (Fig. 2A). In many cases non-eyelid PCs were recorded quite close to eyelid PCs and sometimes both types of PCs were recorded on the same tetrode. The location of eyelid PCs is consistent with findings from infusion and lesion studies of cerebellar anterior lobe showing that inactivation of this region of cerebellar cortex abolishes the learned timing of delay and trace eyelid responses (Garcia and Mauk, 1998, Kalmbach et al., 2010). Eyelid PCs located more caudal, dorsal, and medial in lobule HVI hypothesized to be involved in CR expression, and not CR timing, were not sampled in the current experiment (Attwell et al., 1999, 2001; Mostofi et al., 2010). No difference was found between the spontaneous firing rate for eyelid PC simple spikes (48.7 Hz ± 1.6) and non-eyelid PC simple spikes (48.0 Hz ± 1.5).
Eyelid PC responses during training at four ISIs
Training at different ISIs promotes the acquisition of differently timed CRs. We recorded PCs during the expression of CRs during training using one of four ISIs (200, 250, 500, or 700 ms) to evaluate the relationship between PC responding and the timing of CRs; i.e., their amplitude/velocity/acceleration profiles. The 24 PC recordings using ISI 500 were collected during initial learning and before switching to conditioning with a different ISI. Data from PCs at ISI 200, 250, and 700 (n = 48, 53, and 10, respectively) were collected after rabbits were initially trained and extinguished at ISI 500. In addition, some of the recordings made during ISI 200 and ISI 250 were during sessions where rabbits were being trained with two ISIs in the same session. In each case, however, the second ISI was longer. Results from the longer ISI data collected during the two ISI sessions are presented in a later section. Figure 3A–D shows representative examples of simple-spike recordings from four eyelid PCs with the corresponding eyelid CRs during sessions using ISI 200, 250, 500, and 700, respectively.
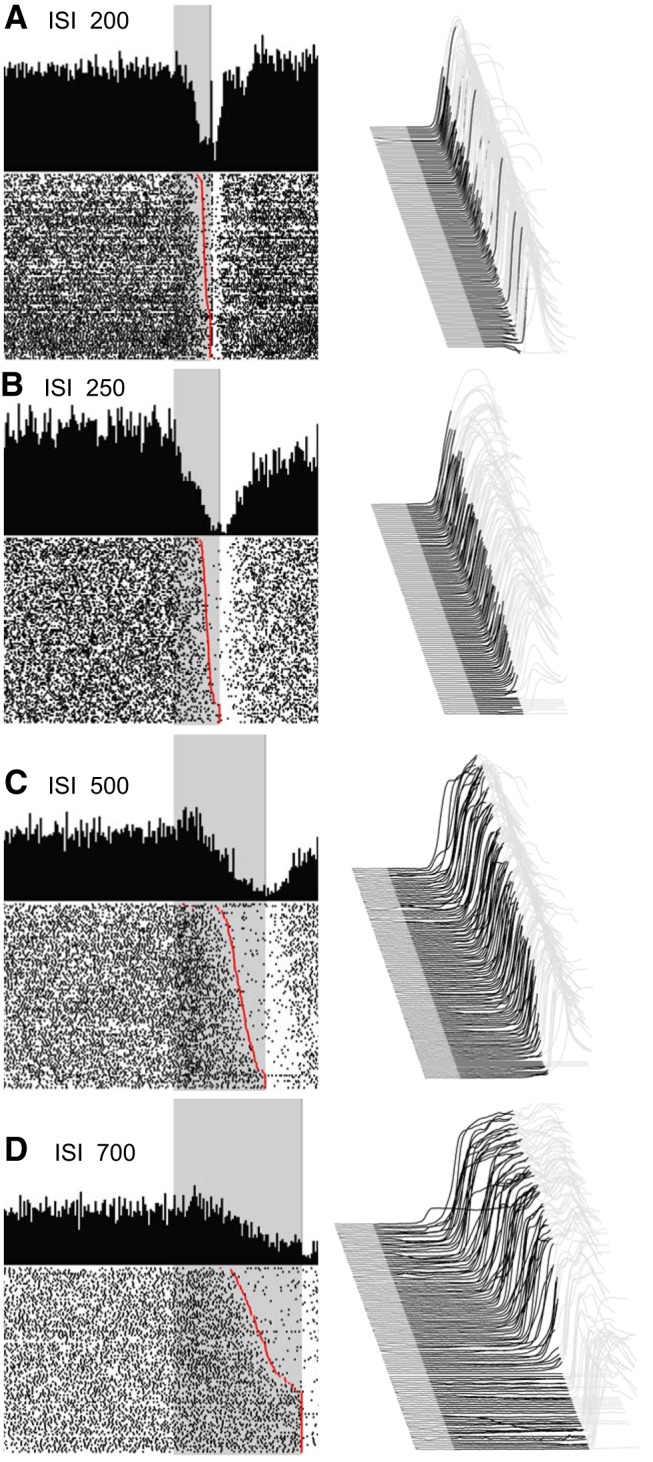
Figure 3.
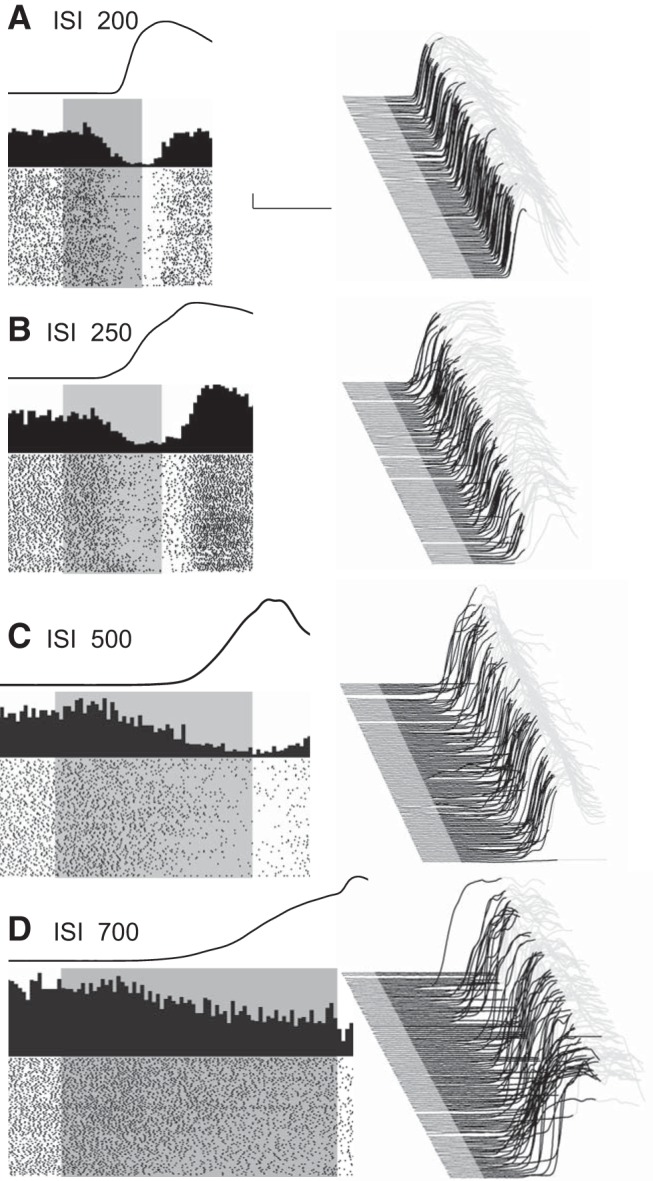
Representative examples of eyelid PC recordings during the four behavioral conditions that involved single ISIs of 200, 250, 500, and 700 ms (A–D as indicated). For each panel, a waterfall plot of all behavioral responses in the session is shown at right. For these plots, each sweep represents the response from an individual trial, first trial in front. Upward deflection represents closure of the eyelids. For each sweep the pre-CS portion is shown in dark gray, the time during which the CS was present is shown in black, with the post-US portion of each response shown in light gray. With this arrangement, all eyelid responses during the black portions of the trace are CRs. The average response during the paired CS-US trials over the entire session is shown as a single sweep above the raster plots. For the raster plots, where the first trial is on the bottom row, each dot represents the simple-spike recording from that PC. The trials are aligned such that the CS duration is shown by the gray rectangle. These data are from four different PCs and their responses are representative of those observed for the four different ISIs. Scale bar: (in A) A–D, 1 mm, 200 ms.
To examine how the activity of PCs corresponds to kinematic properties of conditioned eyelid responses, average position (green), velocity (black), and acceleration (red) of the eyelid were compared with the corresponding average instantaneous firing rate of eyelid PCs (blue) across all sessions for each ISI. These comparisons are shown separately for the four ISIs in Figures 4A–7A. The shaded region for each sweep represents the 95% confidence interval for the group data. In these same four figures, B shows the proportion of cells for each time bin with a significant deviation from pre-CS baseline (Z-score with p < 0.01) in their instantaneous firing rate. In each case, the black trace shows the proportion of cells with a significant decrease in activity and the gray trace shows the proportion with a significant increase in activity in that time bin. Finally,Figures 4C–7C show the cross-correlations between average instantaneous firing rate of eyelid PCs with average eyelid position (green), eyelid velocity (black), and eyelid acceleration (red) for each training paradigm. Here again, the shaded region of each sweep represents the 95% confidence interval. The dot on each of the cross-correlation plots denotes the offset with the peak negative correlation between normalized PC activity and the indicated kinematic property of the conditioned eyelid responses.
The timing of the CRs differed significantly for the four ISIs, providing a richer test of the relationship between PC activity and behavior than could be obtained from training with a single ISI. Average latencies to onset of the CRs were 128.3 ± 0.7, 120.4 ± 1.0, 258.2 ± 2.6, and 357.8 ± 6.7 ms, respectively for ISIs 200, 250, 500, and 700 ms. The average amplitude of the CRs were, in ascending order of ISI, 3.6 ± 0.1, 4.9 ± 0.1, 3.3 ± 0.1, and 3.4 ± 0.2 mm. Eyelid PCs showed the same general pattern of simple-spike activity during training at the four ISIs despite large differences in the timing of the CRs. There was a decrease in simple-spike activity that preceded the conditioned eyelid responses. At the longer two ISIs, eyelid PCs often showed an increase in simple-spike activity that preceded the decrease (Figs. 6, 7). Even for the shorter two ISIs ∼20% of the eyelid PCs showed a significant increase in simple-spike activity just after CS onset (Figs. 4B, 5B). This pattern of a decrease in activity preceded by an increase has been observed before in recordings from paralyzed animals (Hesslow and Ivarsson, 1994) and is generally consistent with the previously proposed role of PCs in response timing (Mauk and Donegan, 1997; Medina and Mauk, 2000), and a role for rebound excitation in the deep nucleus neurons in response expression (Freeman and Steinmetz, 2011). For all four ISIs the cross-correlation analyses revealed that eyelid PC activity was poorly related to subsequent eyelid acceleration but was about equally well related to subsequent eyelid position and velocity (Figs. 4–7C). In sum, eyelid PCs showed a tendency to increase simple spike activity at CS onset that was more robust at longer ISIs, showed a strong decrease in simple-spike activity that preceded the CRs, and these changes in simple-spike activity were much better predictors of eyelid position and velocity than of eyelid acceleration.
Despite these general similarities, the changes in simple-spike responding at the four ISIs showed robust and systematic differences. Figure 8 compares the responses of eyelid and non-eyelid PCs and the kinematic properties of the CRs across the four different ISIs, where ISI 200 is shown with black traces, ISI 250 with red traces, ISI 500 with blue traces, and ISI 700 with green traces. Five separate comparisons are shown across the four ISIs. Figure 8B shows average eyelid position, velocity, and acceleration, respectively, for the four ISIs. Figure 8A shows the robust differences in the simple-spike responses for the four ISIs between eyelid and non-eyelid PCs. Non-eyelid PCs showed a fixed latency increase in simple-spike activity across each ISI. In contrast, changes in simple-spike activity observed from eyelid PCs was dependent on the ISI in a manner similar to the ISI dependence of the CRs. The rapid decreases in activity for ISIs 200 and 250 were quite similar, corresponding to the quite similar kinematics of the eyelid responses for these two ISIs. The decreases seen in simple-spike activity were significantly later for ISI 500 and later still for ISI 700. Differences in simple-spike responding were most notable in the first 200–300 ms following CS onset. At 200 ms, for example, the robust decreases in simple-spike activity seen with ISI 200 and ISI 250 are at their peaks, the activity for ISI 500 has increased and has started to decrease, whereas the simple-spike activity at ISI 700 is just at the point of transition from the initial increase and the robust decrease that occurs later.
The relationship between PC activity and CR onset is particularly important. Among other factors, for decreases in PC activity to drive the expression of CRs, these decreases must begin before CR onset and presumably there should be a principled relationship between PC activity and CR onset. For these reasons the activity of eyelid PCs were averaged again, aligned now by CR onset rather than by the onset of the CS (Fig. 9). As in Figure 8, black traces show data from ISI 200, red traces from ISI 250, blue traces from ISI 500, and green trace from ISI 700. Also as with Figure 8, normalized firing rate from the four ISIs is compared with separate traces showing average eyelid position, velocity, and acceleration for each ISI. For each ISI eyelid PCs show decreases in activity that precede by ∼100 ms the onset of the eyelid CR. Averaged in this way the responses of eyelid PCs are quite similar before the onset of CRs for each ISI. At the time of CR onset, all four groups show a decrease in eyelid PC activity to between 80 and 85% of baseline. It appears from these results that, ignoring other factors, such as an increase in activity before the decrease, a decrease in eyelid PC activity to ∼80% of baseline is required to initiate a conditioned eyelid response. Although the normalized firing rate traces for the four ISIs are quite similar, the latencies to onset of the CRs for the four ISIs are quite different. These data show that the relationship between eyelid PC activity and CR onset is fairly uniform across ISIs, and therefore that differently timed conditioned eyelid responses require differently timed pauses in eyelid PCs. Differences in the PC responses for each ISI are clearly consistent with the hypothesized role of the PCs in the adaptive timing of conditioned eyelid responses.
Figure 9.
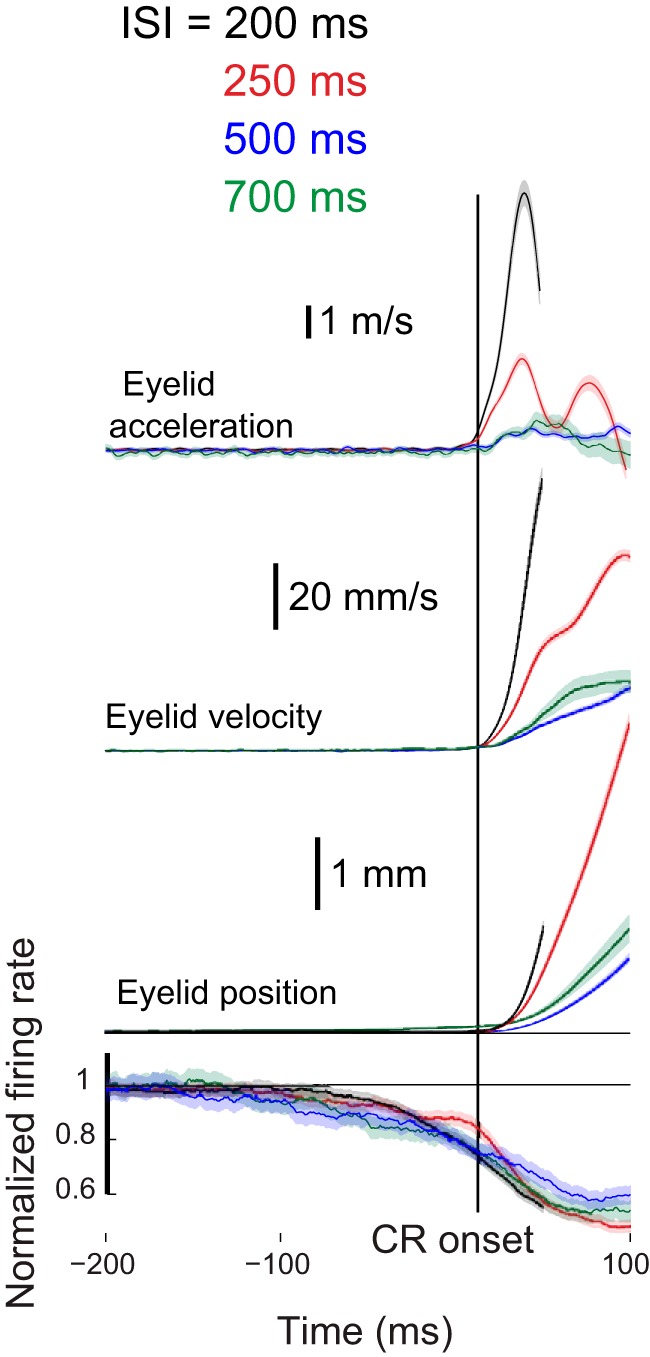
Average normalized firing rate relative to pre-CS baseline of eyelid PCs and average position, velocity, and acceleration of eyelid CRs where all mentioned quantities were aligned by onset of the CR at a given trial and then averaged. Therefore, here time equal zero means the onset of CR. CR kinematic measures for the different ISIs are truncated to prevent contamination from the response to the US due to the inconsistent relationship between onset and amplitude. Aligned by CR onset the average responses of eyelid PCs are quite similar over the 200 ms before CR onset. At CR onset, eyelid PC activity was between 80 and 85% of baseline for all four ISIs.
This is illustrated further by the four examples shown in Figure 10. These are sample raster plots of eyelid PCs and of eyelid responses sorted in each case by the latency to criterion of the CRs. Non-CRs are shown at the bottom and each CR is displayed in increasing order of its latency to criterion, which is shown for each trial as a red dot on the raster plots. These representative examples illustrate that the relationship between decreases in eyelid PC simple-spike activity and the timing of the CRs is readily apparent on a trial-by-trial basis. Because there tends to be some variation in the latency of the CRs within a particular session, and this variation increases with the ISI, averages of the eyelid responses and the PC responses are smeared in time, somewhat obscuring the tight relationship between simple-spike activity and the timing of CRs.
Figure 10.
Four example recordings of eyelid PCs where the raster plots are sorted by the latency to criterion of the CRs to illustrate the relationship between the timing of the CRs and the timing of the PC pauses. A–D, A raster plot of an eyelid PC and the associated peristimulus histogram, where the trials are sorted top to bottom from the longest to the shortest latency to criterion of the CRs. The corresponding behavioral responses, also sorted by latency to criterion, are shown at right. For each trial in the raster plots, the red dot depicts the latency to criterion of the CR for that trial. In each panel, non-CRs are at the bottom.
Eyelid PC activity when trials are grouped by latency to onset
To quantify this relationship further the CRs for each ISI were grouped according to latency to onset and the average eyelid PC activity for these groups were calculated separately (Fig. 11). For ISIs 250, 500, and 700 four groups were created: the third with the shortest latencies to onset (green traces), the third with the longest latencies to onset (black traces), the middle third (red traces), and finally the non-CRs (blue traces). For ISI 200, where there is low variability in CRs latencies, three groups were calculated: non-CRs (blue traces), responses with latency to onset below the median (green traces), and those above the median (red traces). The average simple-spike activity of eyelid PCs is shown for each group following the same color code as the behavioral responses. The shaded region of each trace depicts the 95% confidence interval.
Figure 11.
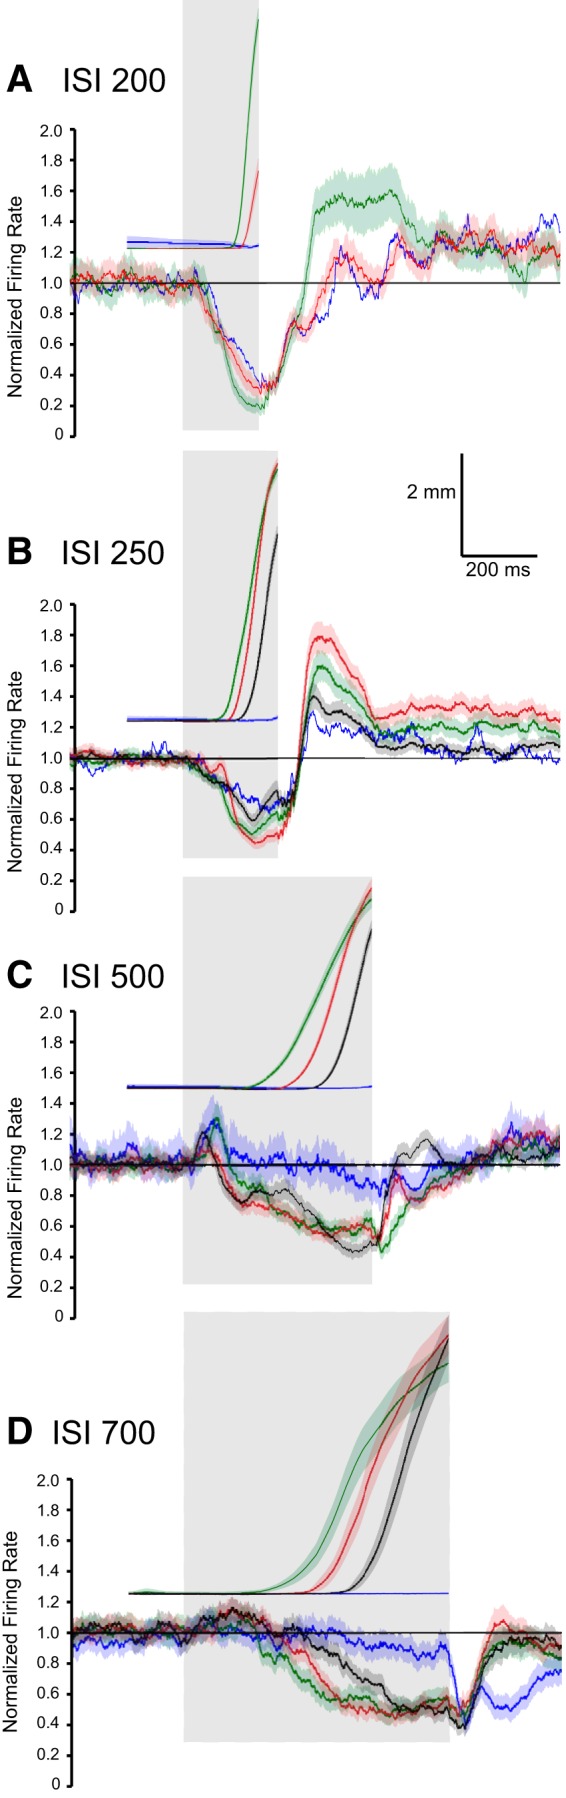
Average activity of eyelid PCs and corresponding average eyelid responses (position) where trials are grouped by latency to onset of the CRs. A, Average activity of 48 eyelid PCs and the corresponding eyelid CRs for those trials during training with an ISI of 200 ms. For both eyelid position and PC activity the green traces represent CRs with latencies to onset below the mean, the red traces represent CRs with latencies to onset above the mean, and the blue traces represent trials where there was not a CR. There are small but reliable differences in the average PC activity for the shorter-latency versus the longer-latency CRs. B, Average activity of 53 eyelid PCs and the corresponding eyelid CRs for an ISI of 250 ms. Here, and for C and D, the green traces represent the 33% of the trials with the shortest latencies to onset, the black traces the 33% with the longest latencies to onset, the red traces are the intermediate 33%, and the blue traces are the average of the non-CRs. With the large number of trials, there are small but systematic differences in the PCs responses during differently timed CRs. For the two shorter ISIs (200 and 250 ms) decreases in eyelid PC activity were observed during non-CR trials but these decreases were not sufficient for the cerebellum to generate responses. C, Same data format as in B, here for the 24 eyelid PCs that were recorded during training with an ISI of 500 ms. D, Same format as above for the 10 eyelid PCs recorded during training with an ISI of 700 ms. For the two longer ISIs (500 and 700 ms), there is very small change from baseline at the end of each ISI in eyelid PC activity during the non-CR trials.
Clear differences in eyelid PC activity were observed between the four different ISIs with respect to response onset. Grouping eyelid PC data with respect to the onset of the behavioral responses within each ISI allowed a more fine-grained investigation into the level of control the cerebellar cortex has over response onset. For ISI 200 there were significant differences between the simple-spike responses for the shorter-latency responses (Fig. 11A, green traces) and for the longer-latency responses (red traces). At this ISI the PCs also showed a large decrease in activity on the non-CR trials (blue traces). Many of the CS-alone trials at this short ISI involve CRs that begin after US onset (Fig. 10A). It may be, therefore, that for many of these non-CRs would have been CRs that began after US onset. This may also be true for ISI 250, as the eyelid PCs showed a significant decrease in activity on non-CR trials at this ISI as well (Fig. 11B, blue traces). In addition, for both of the shortest ISIs, average CR amplitude of the group with the longest latencies to onset was considerably smaller compared with the groups with earlier onsets. For the CRs at ISI 250, there was considerable overlap in the confidence intervals for the shortest-latency responses and the middle third group (Fig. 11B, green trace versus red trace). There is, however, a robust difference in PC responses for the earliest third and the latest third (green versus black traces, Fig. 11B).
For the longer two ISIs there were clear differences in simple-spike activity between the different groups and there was very little change in eyelid PC activity for the non-CR groups. Eyelid PC activity with ISI 500 showed an increase in simple-spike activity at the beginning of the CS for all four groups (Fig. 11C). The non-CR group did not show a significant decrease in simple-spike activity below the baseline during the CS. PC activity corresponding to the latest CR onset group (blue trace) showed a later decrease in activity than the group with median latency responses (red trace). PC activity for the earliest CR onset group showed the highest increase in simple-spike activity at the beginning of the CS, which was followed by a decrease below baseline, though not as pronounced relative to the other groups. At the longest ISI (700) there were clear differences in the simple-spike activity of eyelid PCs for the four groups (Fig. 11D). Here again, there was very little change in the activity of eyelid PCs for the non-CR trials. For the three groups separated by latency to onset, all three of the corresponding averaged PC responses were distinct.
Eyelid PC activity when trials are grouped by conditioned response amplitude
To investigate possible relationships between eyelid PC activity and the peak amplitude of the CRs, for each ISI the CRs were grouped according to their amplitude and within these groups average eyelid PC activity was calculated (Fig. 12). Four groups were created for each ISI: non-CRs (blue traces), the one-third with the smallest response amplitudes (green traces), the one-third with the middle-sized responses (red traces), and the final one-third with the largest amplitudes (black traces). As with the previous section, the average simple-spike activity of eyelid PCs is shown for each group following the same color code as the behavioral responses. The shaded region of each trace depicts the 95% confidence interval.
Figure 12.

Average activity of eyelid PCs and corresponding average eyelid responses (position), where trials are grouped by CR amplitude. For all panels the green traces represent the 33% of the trials with the smallest CR amplitudes, the black traces the 33% with the largest amplitudes, the red traces are the intermediate 33%, and the blue traces are the average of the non-CRs. A, Average activity of eyelid PCs and the corresponding eyelid CRs for those trials during training with an ISI of 200 ms. Results are plotted separately for two rabbits trained under that protocol. In both cases, there are differences in the average PC activity for trials with the highest CR amplitude versus non-CR trials. B, Same format for eyelid PCs recorded during training with an ISI of 250 ms. There are systematic differences in the PC activity for all four groups of CRs. Decreases were observed during the two shorter ISIs (200 and 250 ms) but were not sufficient to produce CRs. C, Same data format as above for the eyelid PCs recorded during training with an ISI 500 ms. D, Same format as above for the eyelid PCs recorded during training with an ISI 700 ms. For the two longer ISIs (500 and 700 ms) very small decreases in eyelid PC activity were observed during non-CR trials.
Because the two rabbits trained at ISI 200 showed different results, their data are presented separately in Figure 12A1,A2. For both rabbits, eyelid PC activity corresponding to the non-CR group showed a decrease bellow the baseline, this decrease was smaller than the decrease in activity corresponding to the smallest response amplitude group. Again, these decreases on non-CR trials only occurred for ISIs 200 and 250 (Fig. 12B) and may reflect that at these short ISIs many non-CRs are simply late CRs that did not begin before US onset. For the first rabbit, whose data are shown in Figure 12A1, eyelid PC activity was reliably different over the three amplitude groups during the last half of the CS. Eyelid PC activity during the largest amplitude CRs demonstrated a faster and larger decrease from the baseline. This pattern of activity was not observed for the second rabbit, whose data are shown in Figure 12A2. Here, there were no significant differences between the eyelid PC activity for the different CR amplitude groups. This may relate to the high degree of consistency in the amplitude of the CRs, and thus only small differences in the average PC activity of the three groups for this animal.
For ISI 250 eyelid PC responses were reliably different when grouped by CR amplitude (Fig. 12B). Eyelid PC activity corresponding to the smallest one-third response amplitude group was different during the last half of the CS from the non-CR and two higher amplitude groups. The middle and largest response amplitude groups showed PC activity that was significantly different through some but not all portions of the CS. These results were consistent with the average eyelid-position profiles for these two amplitude groups and were closer to each other during ISI 250 with respect to the other ISIs. Overall, for the eyelid PCs recorded during training with the two shortest ISIs, reliable differences in eyelid PC activity were seen when there were relatively large differences in CR amplitudes for the groups. On average, for both ISIs we observed the same trend of earlier and larger decreases in PC activity during the CS corresponded to faster eyelid closure and higher resulting CR amplitude.
The most robust differences between groups were seen for ISIs 500 and 700 (Fig. 12C,D). PC activity of the non-CR group did not show a significant decrease below the baseline with the exception of a very small decrease near the end of the CS. For ISI 500, an increase in simple-spike activity was observed for all four groups during the first 100 ms of the CS. PC activity corresponding to the groups with the smallest and largest CRs was fully separated during the second half of the CS. For ISI 700, PC simple-spike activity for the group with the smallest one-third response amplitude showed separation in a similar way. Activity for the two larger amplitude groups showed a more pronounced decrease in the later part of the CS, accompanied by an early increase in simple-spike activity, which was especially pronounced for the largest amplitude responses. In sum, grouping CRs by their amplitude led to eyelid PCs activity being also separated into distinct groups. In general, CRs with the largest amplitudes were a result of a combination of an early increase in eyelid PCs simple-spike activity followed by a pronounced decrease.
To further explore the potential relationship between eyelid PC decreases in activity and the amplitude of conditioned eyelid responses, we analyzed the relationship between the maximum decrease in firing rate during the CS and peak amplitude of the corresponding conditioned eyelid response. Because the instantaneous firing rate is inherently noisy, we rank ordered for each session CR amplitudes and made subgroups of nine trials with the closest amplitudes. For each subgroup, we then calculated the maximum decrease in averaged firing rate and corresponding average CR amplitude. The range of CR amplitudes was divided into eight bins and each nine-trial subgroup was placed in its appropriate amplitude bin. The average maximum decrease in firing rate and average CR amplitude were determined for each bin. This analysis was performed separately for each ISI. The overall results combined across all four ISIs are shown in Figure 13. For ISI 250, 500, and 700 there was a clear distinction between non-CR trials, small amplitude responses and all other responses across the entire range of amplitudes. For ISI 500, responses with the highest amplitudes were also clearly different that for smaller amplitudes. This analysis failed to reveal a significant trend between response amplitude and the maximum decrease in eyelid PC firing for data from ISI 200. Although again, at this short ISI many of the non-CRs may have actually been CRs that were truncated by the onset of the US. Overall, this analysis demonstrates that the magnitude of the decrease in PC activity alone does not directly or in a straightforward manner encode the peak amplitude of the CRs. This further supports a more complex relationship between the pattern of PC activity and the trajectory of the eyelid CRs. Similar analysis was also performed to investigate the relationship between decreases in eyelid PCs activity and maximum eyelid velocity. The results from the velocity analysis showed even lesser linear dependence compared with the amplitude data from Figure 13 (data not shown).
Figure 13.
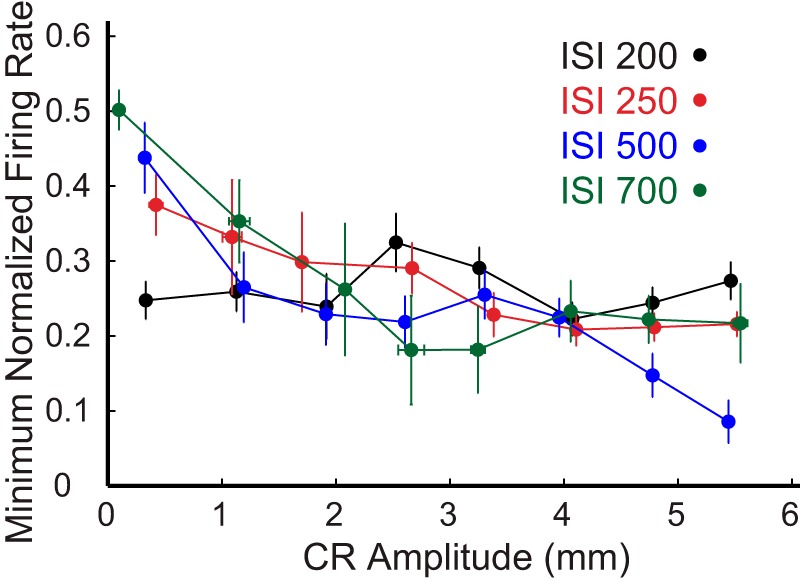
Relationship between CR amplitude and minimum averaged normalized firing rate with respect to pre-CS baseline firing rate of eyelid PCs. Different colors indicate data from eyelid PCs recorded at different ISIs. Each data point is mean within a bin (see Results). All non-CRs are located in the first bin followed by a progressive increase in CR amplitude in each successive bin. Error bars indicate SEM.
Temporal relationship between eyelid PC activity and conditioned eyelid responses
To address how kinematic properties of the behavioral CR correspond to eyelid PC activity we performed cross-correlation analysis between these measures. Cross-correlations were calculated between average instantaneous firing rate of eyelid PCs and averaged eyelid position, velocity, and acceleration profiles. Such analysis was repeated for each training paradigm. Due to the inverse relationship between eyelid PC activity and behavior, negative cross-correlation values were expected. A decrease in eyelid PC simple-spike activity results in disinhibiting the interpositus nucleus (IPN), which then drives expression of CRs.
For each training paradigm, eyelid acceleration showed almost no relationship with the activity of eyelid PCs, whereas eyelid position and velocity both showed high negative cross-correlation values with eyelid PCs firing rate. We explored the temporal specificity of cross-correlations, assuming that there is a constant time delay between PC firing rate and the corresponding eyelid kinematic variable (Figs. 4–7C).
The highest negative cross-correlation values between eyelid acceleration and eyelid PC activity were very small for all four ISIs: racc = −0.02 ± 0.04, racc = −0.04 ± 0.06, racc = −0.04 ± 0.04, and racc = 0.04 ± 0.03 for ISI 200, 250, 500, and 700, respectively. The highest negative cross-correlation values between eyelid PC firing rate and eyelid position/velocity during training at shorter ISIs (200, 250) were similar for both position and velocity (rpos = −0.67 ± 0.05, rvel = −0.62 ± 0.04 for ISI 200, rpos = −0.66 ± 0.05, rvel = −0.60 ± 0.05 for ISI 250). Time lags corresponding to the peak values were between 0 and 60 ms before CR onset with time lag for velocity being shorter than for position. However, correlation values close to the peak value were observed for a large range of time lags around the peak for both ISIs. For the two longer ISIs (500, 700), we also observed high cross-correlation values for both position and velocity: rpos = −0.63 ± 0.04 and rvel = −0.64 ± 0.05, respectively, for ISI 500; rpos = −0.84 ± 0.05 and rvel = −0.80 ± 0.07 for ISI 700. The dependence of the cross-correlation value on the time lag was very weak, especially for ISI 700. Therefore, the values of time lags corresponding to the peak negative cross-correlations are not very informative. However, it was still true that peak time lag for velocity was always shorter than for position.
Responses of non-eyelid PCs during training at the four ISIs
Predictions about PC activity from theories of cerebellar learning are only applicable to instances where the training paradigm activates the climbing fiber input to the PCs. The 178 non-eyelid PCs recorded during training at the four fixed ISIs provides an opportunity therefore to test the specificity of the responses seen from the eyelid PCs. Should, for example, non-eyelid PCs respond similarly to eyelid PCs, we could be less confident about the relationship between the responses of eyelid PCs and the expression of the eyelid CRs. The average activity of the non-eyelid PCs that we recorded during the different ISI training conditions are shown in Figure 8A, top. In general, non-eyelid PCs showed a tendency to increase simple-spike activity during the CS, and these increases were quite similar for ISIs 200, 250, and 500. The increase in simple-spike activity during the non-eyelid PC responses at ISI 700 was smaller than the shorter three ISIs. These averaged responses partially obscure the fact that some of these cells showed increases, whereas others showed almost no change in activity during the CS. Therefore, the differences in amplitude of the average increases in PC activity across ISIs could be due to different proportions of CS responsive versus unresponsive PCs.
Unlike the eyelid PCs, the timing of these increases in simple-spike activity in non-eyelid PCs bears no relationship to the timing of the CRs. This is quantified further in Figure 14 where CRs and non-eyelid PC responses for ISIs 250 and 700 are grouped by latency to onset (Fig. 14A1,A2) and amplitude (Fig. 14B1, B2). For both ISIs there were no differences between PC activity for the non-CR group (blue traces) and all other groups showing different CR onsets. Grouping CRs by amplitude also did not reveal a clear separation of non-eyelid PCs responses. The only difference found for grouping non-eyelid PC activity by response amplitude was for ISI 700, this difference was between the non-CR group and groups with large response amplitudes, but only during the last 200 ms of the CS.
Figure 14.

Average responses of non-eyelid PCs for training with ISI 250 and ISI 700. A, Average non-eyelid PC responses for trials where the CRs are sorted by latency to onset. A1, Average responses for the 80 non-eyelid PCs recorded during ISI 250. A2, Average responses for the 20 non-eyelid PCs recorded during ISI 700. In general, non-eyelid PCs showed small increases in activity during the CS. These increases did not significantly differ for trials with a CR versus non-CR trials (blue traces), nor did they differ significantly for trials grouped by latency to onset (green, red, and black traces). As with Figure 11, the green traces represent the one-third of the trials with the shortest latencies to onset, the black traces represent the one-third of the trials with the longest latencies to onset, and the red traces represent the middle one-third of the trials in terms of latency to onset. B, Analyses of the same non-eyelid PCs from ISIs 250 and 700 with trials sorted by CR amplitude. The color-coding of traces is as in Figure 12. There was small separation in the second half of the CS between non-eyelid PC activity from the non-CR group versus the group with the middle-third amplitude responses. In general, however, there was no clear or significant trend in non-eyelid PC activity between groups with different CR amplitudes.
In sum, there were robust differences in the responding of eyelid PCs, whose climbing fibers were activated by the US, and non-eyelid PCs during the expression of conditioned eyelid responses. Eyelid PCs tend to either decrease activity or show an initial increase followed by a decrease in activity. The decreases in activity for the eyelid PCs vary with the timing of the CRs. Non-eyelid PCs tend either to increase activity or show little to no change in activity during the CS; it is not clear whether the increases in activity are learned but the activity of the non-eyelid PCs is not related to the eyelid CRs. The average increase in activity is more robust for the training with shorter ISIs that it is for longer ISIs, especially compared with 700 ms, the longest ISI tested.
Eyelid PC responses during mixed ISI training
We also recorded eyelid and non-eyelid PCs during two variants of training paradigms that involved two ISIs. The “temporal uncertainty” paradigm involves a single CS that is paired with the US on some trials at a shorter ISI (we used 200 ms) and on other trials at a longer ISI (we used 700 ms). The short and long ISI trials were presented in a pseudorandom sequence. In other training sessions, we also used a dual CS/ISI paradigm that involves two CSs (1 kHz tone and 9.5 kHz tone), where each CS is trained using a different ISI (we again used ISIs of 200 or 250 and 700 ms). These paradigms were used to investigate the relationship between eyelid PC responses and CRs where the timing (position, velocity, acceleration) was more complex than the responses observed during fixed ISIs. Temporal uncertainty, for example, promotes CRs with two distinct amplitude peaks (Choi and Moore, 2003; Freeman et al., 2003), whereas dual CS/ISI training has been reported to promote differently timed responses to the two CSs (Mauk and Ruiz, 1992). Here, however, we found that dual CS/ISI training produced rapid, short-latency responses to the CS associated with the shorter ISI and dual peaked responses, like those seen with temporal uncertainty training, with the CS associated with the longer ISI (Fig. 15A,B). Eyelid PC data recorded during temporal uncertainty and dual CS/ISI (n = 12 and 37, respectively) were collected after rabbits had been previously trained and extinguished at ISI 500 and ISI 250. Figure 15A,B shows examples of simple-spike recordings from two eyelid PCs with the corresponding eyelid CRs during temporal uncertainty and dual CS/ISI sessions.
Figure 15.

Examples of behavioral responses (waterfall plots) and eyelid PC responses (raster plots and peristimulus histograms) during the two behavioral paradigms that used two ISIs. A, Temporal uncertainty training used pseudorandom sequences of trials that involved a tone CS paired with the US at either 200 or 700 ms. The waterfall plot at top shows example behavioral data from an animal trained with temporal uncertainty. Note that most trials involved a dual-peaked eyelid CR where the two peaks approximately correspond to the two times at which the US is presented. The responses shown are either paired trials with US presented at 700 ms or are CS-alone trials. The paired trials with the US presented at 200 ms are not shown. The averaged CR for the ISI 700 trials is shown below the waterfall plot. The raster plot and peristimulus histogram shows the activity of an eyelid PC from the ISI 700 trials recorded during this session. B, Dual CS/ISI training involved two different tone CSs (1 kHz and 9.5 kHz) that were paired with the US at a short ISI (200 or 250 ms) or a long ISI (700 ms). Data for the CS that used the short ISI are shown at left; the data for the CS that used a long ISI are shown at right. As in A, The waterfall plots at the top show individual eyelid responses, the average CR is shown in the middle, and at bottom are the raster plots and peristimulus histograms for an eyelid PC recorded during this session.
The same analyses used with the fixed ISI data were implemented on PC activity recorded during these two ISI paradigms. These comparisons are shown separately for temporal uncertainty and for dual CS/ISI in Figure 16A and B, respectively. As in Figures 4–7, the middle shows the proportion of cells for each time bin that showed a significant increase (gray) or decrease (black) from pre-CS baseline in their instantaneous firing rate (Z-score with p < 0.01). The bottom shows the cross-correlations between average instantaneous firing rate of eyelid PCs with kinematic properties of the conditioned eyelid responses (average position, velocity and acceleration) for the long ISI trials. The shaded region of each sweep represents the 95% confidence interval.
Figure 16.

Average CR and PC data for the sessions that used temporal uncertainty (A; n = 12, two rabbits) training or dual CS/ISI (B; n = 37, one rabbit) training. Formatting for this figure parallels that for Figures 4–7. The gray rectangle depicts the time at which the tone CS was present. Green traces represent average eyelid position, black traces are average eyelid velocity, red traces are average eyelid acceleration, and the blue traces are averaged normalized eyelid PC activity. Middle, The proportion of eyelid PCs that showed a significant Z-score (p < 0.01) deviation from baseline at each time bin. Gray traces indicate the proportion of PCs with a significant increase in activity and black traces indicate the proportion of cells with a significant decrease in activity. Bottom, Results from cross-correlation analysis comparing eyelid PC responding with either eyelid position (green), eyelid velocity (black), or eyelid acceleration (red). The circle on each trace shows time of the maximum negative correlation.
Conditioned-response measures and eyelid PC activity observed during the long ISI trials for both two-ISI paradigms showed similar patterns. Onset of the average CRs in temporal uncertainty and dual CS/ISI training started at 115 ± 1.4 and 118 ± 1.6 ms, respectively, after CS onset, which was similar to the fixed ISIs of 200 and 250 ms. Response amplitude at the end of the CS was similar in both groups (temporal uncertainty = 4.6 ± 0.1 mm, dual CS/ISI = 4.9 ± 0.1 mm), however, temporal uncertainty training leads to a larger (4.8 ± 0.1 mm) and earlier peak than dual CS/ISI training (4.0 ± 0.1 mm). CR velocity and acceleration profiles were similar with respect to timing between the two mixed paradigms. However, the magnitude of each measure was larger for the initial peak for the average responses observed during temporal uncertainty relative to the average dual CS/ISI responses. Average eyelid PC activity showed the same dual decrease pattern, which occurred before CR onset for both two-ISI paradigms. Decreases in activity associated with the short and long ISIs were more pronounced during temporal uncertainty. In addition, a greater proportion of cells showed a significant Z-score (p < 0.01) increase from 100 to 150 ms after CS onset during temporal uncertainty. PC activity tightly modeled the behavioral responses observed during both two-ISI paradigms, and in both cases PC activity was a better predictor of eyelid position than velocity or acceleration.
Cross-correlations for the ISI 700 trials during temporal uncertainty training between average eyelid position and average eyelid PC activity showed the highest negative correlations between 0 and 100 ms before CR onset, with the highest correlation (rpos = −0.66 ± 0.07) at 46 ms before CR onset. The highest negative cross-correlations (rvel= −0.42 ± 0.06) between average eyelid velocity and PC activity occurred at response onset (time lag = 0), the value of correlations then increased and became positive throughout the window tested. Acceleration cross-correlations with eyelid PC activity were positive or near 0 throughout the 200 ms window tested. Cross-correlations for the ISI 700 trials during dual CS/ISI training showed similar results to temporal uncertainty training with respect to each of the CR measures with the exception of position showing the highest correlation (r = −0.43 ± 0.05) 122 ms before response onset.
Sorting two ISI responses by onset and by amplitude
The relationship between kinematics of the CRs during two ISI training with eyelid PC activity was investigated further by dividing the responses into groups with respect to onset or amplitude within each training paradigm. Conditioned responses were divided into three groups with respect to onset, the earliest-third (green), middle-third (red), and latest-third (black) for both two ISI paradigms (Fig. 17A). There were an insufficient number of non-CR trials during each paradigm for a separate group. Because response onset during both paradigms resembled training with ISI 200 and 250 the range of onsets between the groups did not show much variation, which was then reflected in the corresponding average PC activity for each group. A consistent difference between group data observed in both paradigms was that the latest onset group was associated with a smaller decrease in eyelid PC activity than the other two groups during the initial peak of the CRs. During temporal uncertainty, the group showing the largest second peak also showed a larger average PC decrease during the end of the ISI. The lack of additional differences between the PC activity related to the onset groups for both mixed paradigms was more of a reflection of the high degree to which PC activity closely modeled the responses, which did not show a high degree of variability in timing.
Figure 17.

Average eyelid position and average eyelid PC responses for temporal uncertainty training (A1, B1) and dual CS/ISI training (A2, B2) where the trials were either grouped by latency to CR onset (A) as in Figure 11, or grouped by CR amplitude (B) as in Figure 12.
The same analysis was done to further investigate the relationship between CR amplitude and average PC activity within each two-ISI paradigm. Data were divided into three groups with respect to amplitude of the response at the end of the ISI for each paradigm, the one-third with the smallest amplitude (green), middle amplitude (red), and largest amplitude (black; Fig. 17B). In each group, the amplitude of the response at the end of the ISI also corresponded to the amplitude of the first peak so that the largest amplitude responses at the end of the ISI also had the largest amplitude initial peak. During temporal uncertainty, the group with the largest amplitude responses showed an earlier decrease at the beginning of the CS and a larger magnitude decrease during the first peak than the group with the lowest amplitude responses. In addition, the largest two amplitude groups showed a larger decrease in average PC activity during the second peak than the group with the smallest responses. The only difference in PC activity between amplitude groups during dual CS/ISI training was a larger increase in activity at the time between the behavioral response peaks for the largest amplitude group (Fig. 17B). This result provides additional evidence that the cerebellum can produce larger responses by actively inhibiting IPN, and then suddenly releasing that inhibition.
Discussion
We report results from 424 PCs recorded during the expression of differently timed eyelid CRs. Eyelid PCs, as defined by the presence of short-latency complex spikes elicited by the US, show reliable decreases in activity that precede the expression of the conditioned eyelid responses. Across the range of differently timed responses, the decreases in eyelid PC activity preceded the onset of the eyelid CRs by a consistent interval, and thus there were significant differences in the average eyelid PC responses for the four ISIs tested. For paradigms promoting expression of dual-peaked CRs, eyelid PCs showed a biphasic decrease-increase-decrease pattern. Finally, eyelid PCs sometimes show an initial increase in activity before the decease that precedes CR onset, particularly for longer ISIs. Non-eyelid PCs in contrast either showed increases in activity just after CS onset or showed little to no change in activity. These observations support the hypothesis that PCs whose climbing fibers are activated by the US undergo learning-dependent plasticity, which alters PC activity in ways that contribute to the well timed expression of eyelid CRs.
We used several analyses to explore relationships between eyelid PC activity and the kinematic properties of eyelid CRs. First, for each training paradigm we grouped trials and the corresponding eyelid PC activity by CR onset time (shortest-third, longest-third, middle-third, and non-CRs). There were small but statistically reliable within-ISI differences in the average eyelid PC activity for these groups, particularly for the longer ISIs. Averaging eyelid PC activity aligned by CR onset (rather than CS onset) showed that the relationship between eyelid PC activity and CR onset was similar across ISIs even though the timing of the decreases in eyelid PC activity were quite different for the differently timed CRs. Finally, for each ISI we also grouped trials and the corresponding eyelid PC activity by CR amplitude. There were systematic differences between these groups in the average eyelid PC responses, again particularly for the longer ISIs. In general, within each ISI non-CRs and the smallest amplitude CRs were associated with a modest decrease in PC activity, whereas the largest amplitude responses were accompanied by the largest magnitude decreases. Along with a recent study showing that optogenetic inhibition of PC activity controls the onset time, size, and movement kinematics of eyelid responses (Heiney et al., 2014), our data indicate that PC activity is related to CR amplitude, but in a way more complex than simple linear encoding.
Finally, for each behavioral paradigm we used the traditional analysis of calculating the cross-correlation between eyelid PC responses and behavioral responses over a range of time lags. These analyses showed that there is no relationship between eyelid PC responses and conditioned eyelid acceleration, and that eyelid position and velocity were better—and approximately equally well—related to eyelid PC activity. For both velocity and position, the correlations were negative and the highest negative correlations involved PC activity preceding behavior. This is consistent with previous recordings of IPN eyelid cells showing that IPN activity precedes CR onset by 10–30 ms (McCormick and Thompson, 1984; Green et al., 2002; Halverson et al., 2010). The combined observations that PC activity relates about equally well to position and velocity and that almost none of the cross-correlations have sharp peaks indicates that the kinematics of eyelid closure are encoded not just by PC activity at a single time lag. Rather, downstream transformations make the conditioned eyelid movement depend on patterns of recent PC activity. Identifying and quantifying this complex relationship could aid analysis of cerebellar mechanisms in two practical ways: PC activity could be inferred from the kinematics of the eyelid responses and it would be possible to predict eyelid CRs that would occur given the activity of PCs in a computer simulation of the cerebellum. This could help connect results of simulations to empirically testable predictions.
Predictions of cerebellar theories based on climbing fiber-mediated plasticity at cerebellar synapses (Marr, 1969) are only accountable, in present context, to eyelid PCs. This is why it is essential to analyze separately the activity of eyelid PCs, these are the recordings that inform and constrain cerebellar theory. Although learning-oriented theories of cerebellum have been a source of controversy since Marr's (1969) paper first appeared, the present data demonstrate that when analysis is limited to eyelid PCs the results are clearly consistent with the main assertions of those theories.
The location of eyelid PCs and the effects of their removal or inactivation have also been controversial. Early studies reporting spared CRs after large lesions of cerebellar cortex (McCormick and Thompson, 1984, 1985) are contradicted by a host of subsequent findings, suggesting that these lesions did not extend far enough anterior. Following the example in Figure 10 of McCormick and Thompson, 1985, a subsequent series of studies showed that: (1) lesions or reversible inactivation of more anterior regions, largely overlapping with the regions where eyelid PCs were encountered in the present study (Fig. 2A), cause response timing to shift to a relatively short and fixed value (Perrett et al., 1993; Perrett and Mauk, 1995; Garcia and Mauk, 1998; Medina et al., 2000, 2002; Bao et al., 2002; Kalmbach et al., 2010), (2) these short-latency responses reflect learning-dependent plasticity in the cerebellar deep nuclei (Ohyama et al., 2006), and (3) acquisition of eyelid CRs is prevented by lesions in this same region even when short-latency responses to a previously trained CS were present (Garcia et al., 1999).
Throughout this era Yeo et al. (1986) presented studies showing that cerebellar cortex lesions abolish CRs and prevent their acquisition (Yeo and Hardiman, 1992). Histologies from the earlier of these studies place the effective site in HVI, with damage caudal and well dorsal of the regions where we have encountered eyelid PCs (compare Fig. 2A with Yeo et al., 1986, and Fig. 4 and with Yeo et al., 1984, their Fig. 1). In later studies effective sites of lesions or infusions have shifted more ventral and rostral, overlapping reasonably well with the most dorsal regions where we encountered eyelid PCs. Indeed, efforts to map the location of eyelid PCs (Mostofi et al., 2010) show this same overlap, (although more anterior regions were not investigated).
Thus, there has been a convergence, with reasonable agreement, on a region of cerebellar cortex that is involved with eyelid conditioning. Although this site is reasonably well reflected by the distribution of eyelid PCs shown in Figure 2A, it is possible that the parasagittal stripe of PCs that mediate eyelid responses does not parallel the rostro-caudal axis. If so, then combining the Yeo studies with the present Figure 2A suggests that we might encounter more eyelid PCs in the rostro-lateral direction and in the caudal-medial direction. This would represent an even greater degree of overlap among the various studies. Nonetheless, our data show that eyelid PCs are richly present in regions where lesions or inactivation unmask short-latency responses in already trained animals and prevent learning of new responses after the lesion.
Our results also diminish the controversy as to whether inactivation of cerebellar cortex abolishes CRs or unmasks short-latency responses mediated by plasticity in the cerebellar nucleus. Neither of these views is contradicted by the present results showing that PCs in this region control the expression of CRs. Indeed, these lesion-effect discrepancies relate more to what the deep cerebellar nucleus can do when the PCs are silent than to the role of eyelid PCs in CR expression. Moreover, the discrepancies may arise from experimental details anyway. Infusions of lidocaine should silence PCs, presumably allowing CS-driven excitatory inputs to deep nucleus neurons to drive short-latency responses, as has been observed (Kalmbach et al., 2010). In contrast, the effects of AMPA antagonist infusions of PCs are unclear because: (1) PCs are active in the absence of synaptic input, and (2) AMPA antagonists would block excitation of PCs, and excitation of neurons that both excite and inhibit PCs. Thus, it seems likely that these antagonists would not silence PCs; rather, they would likely abolish modulation in activity during the CS, such as those that we report here. Thus, infused into the correct location, lidocaine should unmask short-latency responses by silencing PCs, and AMPA antagonist should abolish responses by preventing modulation of PC activity.
We observed that eyelid PCs can show increases in activity that precede the appropriately timed decreases, especially for the longer ISIs. This pattern has been reported previously during learning in preparations where it is not possible to measure the learned behavior while recording PCs (Jirenhed et al., 2007; Rasmussen et al., 2008; Svensson et al., 2010; Jirenhed and Hesslow, 2011a,b). This increase/decrease is consistent with previous studies showing that PCs can contribute to adaptive CR timing by initially increasing activity to suppress IPN early during the CS, then pause to control the timing of CR expression later in the CS period (Medina and Mauk 1999; Medina et al., 2000). Indeed, at longer ISIs the initial increase may be necessary to counteract the learned increase in excitatory drive to the deep nucleus neurons (Ohyama et al., 2006). Regardless, our results add to a large corpus of data supporting the idea that learned changes in PC activity control the well timed expression of conditioned eyelid responses.
Footnotes
This work was supported by MH46904 and MH74006.
The authors declare no competing financial interests.
References
- Albus JS. A theory of cerebellar function. Math Biosci. 1971;10:25–61. doi: 10.1016/0025-5564(71)90051-4. [DOI] [Google Scholar]
- Attwell PJ, Rahman S, Ivarsson M, Yeo CH. Cerebellar cortical AMPA-kainate receptor blockade prevents performance of classically conditioned nictitating membrane responses. J Neurosci. 1999;19:RC45. doi: 10.1523/JNEUROSCI.19-24-j0003.1999. [DOI] [PMC free article] [PubMed] [Google Scholar]
- Attwell PJ, Rahman S, Yeo CH. Acquisition of eyeblink conditioning is critically dependent on normal function in cerebellar cortical lobule HVI. J Neurosci. 2001;21:5715–5722. doi: 10.1523/JNEUROSCI.21-15-05715.2001. [DOI] [PMC free article] [PubMed] [Google Scholar]
- Bao S, Chen L, Kim JJ, Thompson RF. Cerebellar cortical inhibition and classical eyeblink conditioning. Proc Natl Acad Sci U S A. 2002;99:1592–1597. doi: 10.1073/pnas.032655399. [DOI] [PMC free article] [PubMed] [Google Scholar]
- Berthier NE, Moore JW. Cerebellar Purkinje cell activity related to the classically conditioned nictitating membrane response. Exp Brain Res. 1986;63:341–350. doi: 10.1007/BF00236851. [DOI] [PubMed] [Google Scholar]
- Choi JS, Moore JW. Cerebellar neuronal activity expresses the complex topography of conditioned eyeblink responses. Behav Neurosci. 2003;117:1211–1219. doi: 10.1037/0735-7044.117.6.1211. [DOI] [PubMed] [Google Scholar]
- Eccles JC, Ito M, Szentagothai J. The cerebellum as a neuronal machine. New York: Springer; 1967. [Google Scholar]
- Freeman JH, Steinmetz AB. Neural circuitry and plasticity mechanisms underlying delay eyeblink conditioning. Learn Mem. 2011;18:666–677. doi: 10.1101/lm.2023011. [DOI] [PMC free article] [PubMed] [Google Scholar]
- Freeman JH, Jr, Nicholson DA, Muckler AS, Rabinak CA, DiPietro NT. Ontogeny of eyeblink conditioned response timing in rats. Behav Neurosci. 2003;117:283–291. doi: 10.1037/0735-7044.117.2.283. [DOI] [PubMed] [Google Scholar]
- Fushiki H, Sato Y, Miura A, Kawasaki T. Climbing fiber responses of Purkinje cells to retinal image movement in cat cerebellar flocculus. J Neurophysiol. 1994;71:1336–1350. doi: 10.1152/jn.1994.71.4.1336. [DOI] [PubMed] [Google Scholar]
- Garcia KS, Mauk MD. Pharmacological analysis of cerebellar contributions to the timing and expression of conditioned eyelid responses. Neuropharmacology. 1998;37:471–480. doi: 10.1016/S0028-3908(98)00055-0. [DOI] [PubMed] [Google Scholar]
- Garcia KS, Steele PM, Mauk MD. Cerebellar cortex lesions prevent acquisition of conditioned eyelid responses. J Neurosci. 1999;19:10940–10947. doi: 10.1523/JNEUROSCI.19-24-10940.1999. [DOI] [PMC free article] [PubMed] [Google Scholar]
- Gould TJ, Steinmetz JE. Changes in rabbit cerebellar cortical and interpositus nucleus activity during acquisition, extinction, and backward classical eyelid conditioning. Neurobiol Learn Mem. 1996;65:17–34. doi: 10.1006/nlme.1996.0003. [DOI] [PubMed] [Google Scholar]
- Graf W, Simpson JI, Leonard CS. Spatial organization of visual messages of the rabbit's cerebellar flocculus: II. Complex and simple spike responses of Purkinje cells. J Neurophysiol. 1988;60:2091–2121. doi: 10.1152/jn.1988.60.6.2091. [DOI] [PubMed] [Google Scholar]
- Green JT, Steinmetz JE. Purkinje cell activity in the cerebellar anterior lobe after rabbit eyeblink conditioning. Learn Mem. 2005;12:260–269. doi: 10.1101/lm.89505. [DOI] [PMC free article] [PubMed] [Google Scholar]
- Green JT, Johnson TB, Goodlett CR, Steinmetz JE. Eyeblink classical conditioning and interpositus nucleus activity are disrupted in adult rats exposed to ethanol neonates. Learn Mem. 2002;9:304–320. doi: 10.1101/lm.47602. [DOI] [PMC free article] [PubMed] [Google Scholar]
- Halverson HE, Lee I, Freeman JH. Associative plasticity in the medial auditory thalamus and cerebellar interpositus nucleus during eyeblink conditioning. J Neurosci. 2010;30:8787–8796. doi: 10.1523/JNEUROSCI.0208-10.2010. [DOI] [PMC free article] [PubMed] [Google Scholar]
- Heiney SA, Kim J, Augustine GJ, Medina JF. Precise control of movement kinematics by optogenetic inhibition of Purkinje cell activity. J Neurosci. 2014;34:2321–2330. doi: 10.1523/JNEUROSCI.4547-13.2014. [DOI] [PMC free article] [PubMed] [Google Scholar]
- Hesslow G, Ivarsson M. Suppression of cerebellar Purkinje cells during conditioned responses in ferrets. Neuroreport. 1994;5:649–652. doi: 10.1097/00001756-199401000-00030. [DOI] [PubMed] [Google Scholar]
- Ito M. Neural design of the cerebellar control system. Brain Res. 1972;40:81–84. doi: 10.1016/0006-8993(72)90110-2. [DOI] [PubMed] [Google Scholar]
- Jirenhed DA, Hesslow G. Time course of classically conditioned Purkinje cell response is determined by initial part of conditioned stimulus. J Neurosci. 2011a;31:9070–9074. doi: 10.1523/JNEUROSCI.1653-11.2011. [DOI] [PMC free article] [PubMed] [Google Scholar]
- Jirenhed DA, Hesslow G. Learning stimulus intervals: adaptive timing of conditioned Purkinje cell responses. Cerebellum. 2011b;10:523–535. doi: 10.1007/s12311-011-0264-3. [DOI] [PubMed] [Google Scholar]
- Jirenhed DA, Bengtsson F, Hesslow G. Acquisition, extinction, and reacquisition of a cerebellar cortical memory trace. J Neurosci. 2007;27:2493–2502. doi: 10.1523/JNEUROSCI.4202-06.2007. [DOI] [PMC free article] [PubMed] [Google Scholar]
- Kalmbach BE, Davis T, Ohyama T, Riusech F, Nores WL, Mauk MD. Cerebellar cortex contributions to the expression and timing of conditioned eyelid responses. J Neurophysiol. 2010;103:2039–2049. doi: 10.1152/jn.00033.2010. [DOI] [PMC free article] [PubMed] [Google Scholar]
- Kotani S, Kawahara S, Kirino Y. Purkinje cell activity during learning a new timing in classical eyeblink conditioning. Brain Res. 2003;994:193–202. doi: 10.1016/j.brainres.2003.09.036. [DOI] [PubMed] [Google Scholar]
- Marr D. A theory of cerebellar cortex. J Physiol. 1969;202:437–470. doi: 10.1113/jphysiol.1969.sp008820. [DOI] [PMC free article] [PubMed] [Google Scholar]
- Mauk MD, Donegan NH. A model of Pavlovian eyelid conditioning based on the synaptic organization of the cerebellum. Learn Mem. 1997;4:130–158. doi: 10.1101/lm.4.1.130. [DOI] [PubMed] [Google Scholar]
- Mauk MD, Ruiz BP. Learning-dependent timing of Pavlovian eyelid responses: differential conditioning using multiple interstimulus intervals. Behav Neurosci. 1992;106:666–681. doi: 10.1037/0735-7044.106.4.666. [DOI] [PubMed] [Google Scholar]
- Mauk MD, Steinmetz JE, Thompson RF. Classical conditioning using stimulation of the inferior olive as the unconditioned stimulus. Proc Natl Acad Sci U S A. 1986;83:5349–5353. doi: 10.1073/pnas.83.14.5349. [DOI] [PMC free article] [PubMed] [Google Scholar]
- McCormick DA, Thompson RF. Neuronal responses of the rabbit cerebellum during acquisition and performance of a classically conditioned nictitating membrane-eyelid response. J Neurosci. 1984;4:2811–2822. doi: 10.1523/JNEUROSCI.04-11-02811.1984. [DOI] [PMC free article] [PubMed] [Google Scholar]
- McCormick DA, Steinmetz JE, Thompson RF. Lesions of the inferior olivary complex cause extinction of the classically conditioned eyeblink response. Brain Res. 1985;359:120–130. doi: 10.1016/0006-8993(85)91419-2. [DOI] [PubMed] [Google Scholar]
- Medina JF, Lisberger SG. Links from complex spikes to local plasticity and motor learning in the cerebellum of awake-behaving monkeys. Nat Neurosci. 2008;11:1185–1192. doi: 10.1038/nn.2197. [DOI] [PMC free article] [PubMed] [Google Scholar]
- Medina JF, Mauk MD. Simulations of cerebellar motor learning: computational analysis of plasticity at the mossy fiber to deep nucleus synapse. J Neurosci. 1999;19:7140–7151. doi: 10.1523/JNEUROSCI.19-16-07140.1999. [DOI] [PMC free article] [PubMed] [Google Scholar]
- Medina JF, Mauk MD. Computer simulation of cerebellar information processing. Nat Neurosci. 2000;3:1205–1211. doi: 10.1038/81486. [DOI] [PubMed] [Google Scholar]
- Medina JF, Nores WL, Ohyama T, Mauk MD. Mechanisms of cerebellar learning suggested by eyelid conditioning. Curr Opin Neurobiol. 2000;10:717–724. doi: 10.1016/S0959-4388(00)00154-9. [DOI] [PubMed] [Google Scholar]
- Medina JF, Nores WL, Mauk MD. Inhibition of climbing fibres is a signal for the extinction of conditioned eyelid responses. Nature. 2002;416:330–333. doi: 10.1038/416330a. [DOI] [PubMed] [Google Scholar]
- Millenson JR, Kehoe EJ, Gormezano I. Classical conditioning of the rabbit's nictitating membrane response under fixed and mixed CS-US intervals. Learn Motiv. 1977;8:351–366. doi: 10.1016/0023-9690(77)90057-1. [DOI] [Google Scholar]
- Mostofi A, Holtzman T, Grout AS, Yeo CH, Edgley SA. Electrophysiological localization of eyeblink-related microzones in rabbit cerebellar cortex. J Neurosci. 2010;30:8920–8934. doi: 10.1523/JNEUROSCI.6117-09.2010. [DOI] [PMC free article] [PubMed] [Google Scholar]
- Ohyama T, Nores WL, Medina JF, Riusech FA, Mauk MD. Learing-induced plasticity in deep cerebellar nucleus. J Neurosci. 2006;26:12656–12663. doi: 10.1523/JNEUROSCI.4023-06.2006. [DOI] [PMC free article] [PubMed] [Google Scholar]
- Perrett SP, Mauk MD. Extinction of conditioned eyelid responses requires the anterior lobe of cerebellar cortex. J Neurosci. 1995;15:2074–2080. doi: 10.1523/JNEUROSCI.15-03-02074.1995. [DOI] [PMC free article] [PubMed] [Google Scholar]
- Perrett SP, Ruiz BP, Mauk MD. Cerebellar cortex lesions disrupt learning-dependent timing of conditioned eyelid responses. J Neurosci. 1993;13:1708–1718. doi: 10.1523/JNEUROSCI.13-04-01708.1993. [DOI] [PMC free article] [PubMed] [Google Scholar]
- Rasmussen A, Jirenhed DA, Hesslow G. Simple and complex spike firing patterns in Purkinje cells during classical conditioning. Cerebellum. 2008;7:563–566. doi: 10.1007/s12311-008-0068-2. [DOI] [PubMed] [Google Scholar]
- Raymond JL, Lisberger SG. Behavioral analysis of signals that guide learned changes in the amplitude and dynamics of the vestibulo-ocular reflex. J Neurosci. 1996;16:7791–7802. doi: 10.1523/JNEUROSCI.16-23-07791.1996. [DOI] [PMC free article] [PubMed] [Google Scholar]
- Raymond JL, Lisberger SG. Multiple subclasses of Purkinje cells in the primate floccular complex provide similar signals to guide learning in the vistibulo-ocular reflex. Learn Mem. 1997;3:503–518. doi: 10.1101/lm.3.6.503. [DOI] [PubMed] [Google Scholar]
- Raymond JL, Lisberger SG. Neural learning rules for the vistibulo-ocular reflex. J Neurosci. 1998;18:9112–9129. doi: 10.1523/JNEUROSCI.18-21-09112.1998. [DOI] [PMC free article] [PubMed] [Google Scholar]
- Raymond JL, Lisberger SG, Mauk MD. The cerebellum: a neuronal learning machine? Science. 1996;272:1126–1131. doi: 10.1126/science.272.5265.1126. [DOI] [PubMed] [Google Scholar]
- Ryan SB, Detweiler KL, Holland KH, Hord MA, Bracha V. A long-range, wide field-of-view infrared eyeblink detector. J Neurosci Methods. 2006;152:74–82. doi: 10.1016/j.jneumeth.2005.08.011. [DOI] [PubMed] [Google Scholar]
- Schneiderman N, Gormezano I. Conditioning of the nictitating membrane of the rabbit as a function of CS-US interval. J Comp Physiol Psychol. 1964;57:188–195. doi: 10.1037/h0043419. [DOI] [PubMed] [Google Scholar]
- Sears LL, Steinmetz JE. Dorsal accessory inferior olive activity diminishes during acquisition of the rabbit classically conditioned eyelid response. Brain Res. 1991;545:114–122. doi: 10.1016/0006-8993(91)91276-7. [DOI] [PubMed] [Google Scholar]
- Simpson JI, Alley KE. Visual climbing fiber input to rabbit vestibulo-cerebellum: a source of direction-specific information. Brain Res. 1974;82:302–308. doi: 10.1016/0006-8993(74)90610-6. [DOI] [PubMed] [Google Scholar]
- Stone LS, Lisberger SG. Visual responses of Purkinje cells in the flocculus during smooth-pursuit eye movements in monkeys: II. Complex spikes. J Neurophysiol. 1990;63:1262–1275. doi: 10.1152/jn.1990.63.5.1262. [DOI] [PubMed] [Google Scholar]
- Svensson P, Jirenhed DA, Bengtsson F, Hesslow G. Effect of conditioned stimulus parameters on timing of conditioned Purkinje cell responses. J Neurophysiol. 2010;103:1329–1336. doi: 10.1152/jn.00524.2009. [DOI] [PubMed] [Google Scholar]
- Yeo CH, Hardiman MJ. Cerebellar cortex and eyeblink conditioning: a reexamination. Exp Brain Res. 1992;88:623–638. doi: 10.1007/BF00228191. [DOI] [PubMed] [Google Scholar]
- Yeo CH, Hardiman MJ, Glickstein M. Discrete lesions of the cerebellar cortex abolish the classically conditioned nictitating membrane response of the rabbit. Behav Brain Res. 1984;13:261–266. doi: 10.1016/0166-4328(84)90168-2. [DOI] [PubMed] [Google Scholar]
- Yeo CH, Hardiman MJ, Glickstein M. Classical conditioning of the nictitating membrane response of the rabbit: IV. Lesions of the inferior olive. Exp Brain Res. 1986;63:81–92. doi: 10.1007/BF00235649. [DOI] [PubMed] [Google Scholar]