

Abstract
In rodents, food-predictive cues elicit eating in the absence of hunger (Weingarten, 1983). This behavior is disrupted by the disconnection of amygdala pathways to the lateral hypothalamus (Petrovich et al., 2002). Whether this circuit contributes to long-term weight gain is unknown. Using fMRI in 32 healthy individuals, we demonstrate here that the amygdala response to the taste of a milkshake when sated but not hungry positively predicts weight change. This effect is independent of sex, initial BMI, and total circulating ghrelin levels, but it is only present in individuals who do not carry a copy of the A1 allele of the Taq1A polymorphism. In contrast, A1 allele carriers, who have decreased D2 receptor density (Blum et al., 1996), show a positive association between caudate response and weight change. Regardless of genotype, however, dynamic causal modeling supports unidirectional gustatory input from basolateral amygdala (BLA) to hypothalamus in sated subjects. This finding suggests that, as in rodents, external cues gain access to the homeostatic control circuits of the human hypothalamus via the amygdala. In contrast, during hunger, gustatory inputs enter the hypothalamus and drive bidirectional connectivity with the amygdala. These findings implicate the BLA–hypothalamic circuit in long-term weight change related to nonhomeostatic eating and provide compelling evidence that distinct brain mechanisms confer susceptibility to weight gain depending upon individual differences in dopamine signaling.
Keywords: feeding, fMRI, metabolism, obesity, satiety, TaqIA
Introduction
Initiating food intake in response to an energy deficit is essential for survival. Homeostasis results when equilibrium between energy intake and expenditure is maintained. One factor potentially driving positive energy balance is externalized eating, in which sensory cues predicting nutrient availability such as the sight, smell, and taste of palatable food cause overeating by overriding homeostatic mechanisms (Schachter, 1968). Indeed, in animals, environmental cues predicting food availability can elicit eating behavior in the absence of homeostatic need (Weingarten, 1983). This “cue-potentiated feeding” is disrupted when the basolateral amygdala (BLA) and the lateral hypothalamus are disconnected (Petrovich et al., 2002), suggesting that external cues gain access to hypothalamic feeding centers through the BLA.
The human amygdala responds to food cues (O'Doherty et al., 2002; Small et al., 2008). Notably, these responses are heightened in obesity (Holsen et al., 2006; Stoeckel et al., 2008), predict subsequent high-fat food consumption (Mehta et al., 2012), and are inhibited by the appetite suppressants sibutramine and GSK1521498, a μ-opioid receptor antagonist (Fletcher et al., 2010; Rabiner et al., 2011). These findings suggest that individual differences in amygdala response to food cues might be associated with a vulnerability to overeating in an environment laden with food cues. Surprisingly, human imaging studies measuring body weight prospectively have not found associations between weight change and amygdala response to food images (Yokum et al., 2011; Murdaugh et al., 2012) or milkshake, a food taste (Stice et al., 2008a, 2010a, 2010b; Geha et al., 2013). However, because animal work demonstrates that the BLA is specifically engaged in nonhomeostatic feeding, perhaps associations between amygdala response and weight gain can only be detected if BLA activity is measured during satiety. Indeed, a recent study found that obese children show greater amygdala activation to the sweet taste of sucrose when sated (Boutelle et al., 2014) and most published studies of weight change measure responses in individuals who are fasted or neither hungry nor full (Stice et al., 2008a, 2010a, 2010b; Yokum et al., 2011; Geha et al., 2013; Murdaugh et al., 2012).
Another possibility is variability related to genetic influences on neural circuits conferring risk for weight gain. Carriers of the at-risk allele (A1+) of the TaqIA polymorphism show a negative relationship between weight gain and caudate response to milkshake when fasted, whereas noncarriers (A1−) do not (Stice et al., 2008a, 2010b). The TaqIA polymorphism lies on the ANKK1 gene downstream of the dopamine receptor D2 (DRD2) gene (Fossella et al., 2006). A1+ individuals have reduced central DRD2 availability (Thompson et al., 1997; Pohjalainen et al., 1998) and an increased incidence of addictive behaviors such as substance use, overeating, and obesity (Comings et al., 1993; Noble et al., 1994; Blum et al., 1996; Jenkinson et al., 2000; Klein et al., 2007; Esposito-Smythers et al., 2009). TaqIA also moderates the relationship between the reinforcing value of food and energy intake (Epstein et al., 2004, 2007), and A1+ individuals show abnormal reward processing and formation of stimulus–cue associations during learning (Cohen et al., 2005; Klein et al., 2007; Jocham et al., 2009; Felsted et al., 2010). Because dopamine signaling in the amygdalo-hypothalamic circuit influences feeding (Lénárd et al., 1982), A1 allele status might moderate the predicted relationship between amygdala response to food cues and weight gain.
To test our hypotheses, we conducted a repeated-measures fMRI study on healthy adult nondieters in which we measured blood oxygen level-dependent (BOLD) responses in amygdala subregions to the taste and smell of milkshake, a highly palatable and familiar calorie-predictive food cue, when hungry and when sated. Subjects were genotyped for the TaqIA polymorphism and returned to the laboratory to assess weight change 1 year later. As predicted, we identified a genotype-dependent positive association between weight gain and amygdala response to food tastes in the sated, but not hungry state, consistent with a role for the amygdala in nonhomeostatic feeding and weight gain susceptibility in humans.
Materials and Methods
Subjects.
A total of 32 right-handed subjects (15 male; M = 25.3 years, SD = 5.6, range 18–40) were recruited from the greater New Haven area through the Yale University Interdisciplinary Research Consortium on Stress, Self-Control and Addiction (IRCSSA) P30 Subject's core and via flyer advertisement. Subjects were enrolled in the study based upon their body mass index (BMI) and genotype so that we would have equal numbers of A1+ and A1− that were matched for BMI, age, and sex. Fifteen were A1+ and 17 were A1−. Of the 15 A1+, only three were homozygotes, so we collapsed across heterozygotes and homozygotes. One additional female subject underwent all sessions but was excluded from analysis due to starting psychiatric medication in the interim between initial testing and follow-up. All subjects were screened over the phone to be 40 years or less of age, free of psychiatric disorders, eating disorders, current dieting behavior, alcoholism, use of tobacco or drugs other than alcohol, history of head injury with loss of consciousness, use of daily medication other than monophasic birth control, chemosensory impairments, lactose intolerance, or food allergies. As our aim was to sample across a representative healthy Western population, the BMI of subjects ranged from normal to obese (BMI M = 25.3 kg/m2, SD = 4.5, range 19.5–37.0) and no upper limit on BMI was imposed on recruitment as long as subjects were able to fit comfortably in the MRI scanner with our stimulus delivery equipment and be free of self-reported obesity-related health issues such as diabetes. All subjects provided written informed consent at their first laboratory visit and the study was approved by the Yale Human Investigations Committee.
Genotyping.
Saliva samples were obtained from the subjects using Oragene Discover collection kits and DNA extraction was performed as directed by the manufacturer (DNA Genotek). TaqIA A1 allele status was determined by amplifying a 304 bp region with PCR using forward (5′-CCCTTCCTGAGTGTCATCA-3′) and reverse (5′-CGGCTGGCCAAGTTGTCT-3′) primers as described by Epstein et al. (2007). The products of the amplification were digested overnight with the restriction enzyme TaqαI. The resulting DNA fragments were tagged with ethidium bromide and separated via gel electrophoresis. The appearance of a 304 bp band indicated the presence of the TaqIA A1 allele.
Stimuli.
To minimize potential sensory adaptations to repeated presentations of milkshake stimuli, two different flavors of milkshake (chocolate and strawberry) were presented in an interleaved order during scanning. The chocolate milkshake was prepared by combining 12 fl oz each of whole milk, Garelick Farms brand Chug Chocolate Milkshake, and Garelick Farms brand Chug Cookies and Cream Milkshake. The strawberry milkshake was prepared by combining 32 fl oz of whole milk with 6 fl oz of Hershey's brand strawberry syrup. One subject disliked the chocolate milkshake, so a vanilla milkshake consisting of 24 fl oz of Garelick Farms brand Chug Vanilla Milkshake and 12 fl oz of whole milk was presented instead to this subject only. The tasteless solution consisted of each subject's choice of whichever solution tasted “the most like nothing” of 25 mm KCl/2.5 mm NaHCO3, 18.75 mm KCl/1.875 mm NaHCO3, 12.5 mm KCl/1.25 mm NaHCO3, 6.25 mm KCl/0.625 mm NaHCO3, or 3.13 mm KCl/0.313 mm NaHCO3 in distilled water. The food odors were chocolate cookie and strawberry and cream (6002335, 6106524; Bell Labs Flavors and Fragrances) and the floral odors were honeysuckle and lilac (039831 Chey N-3; Firmenich; 31731066 Lilac 71; International Flavors and Fragrances).
The standardized breakfast consisted of Nature's Valley brand Crunchy variety granola bars. For lunch, subjects received apple slices (∼25 kcal of apple per serving) and their choice of sandwich from the options of tuna, ham, turkey, or avocado served on white bread with Kraft American cheese, tomato, and mayonnaise. Each sandwich was designed to contain ∼400 kcal and was cut into quarters before serving. Sandwich type was kept consistent within subjects. For the postscan intake meal, subjects received the milkshakes described above in large opaque cups with translucent lids and a large tub of prepared Annie's brand Shells and White Cheddar (cheese pasta) totaling ∼1750 kcal.
Stimulus delivery.
Liquid tastes were delivered to the subjects via a portable gustometer system. Detailed description of the gustometer system can be found in a previous publication (Veldhuizen et al., 2007). In brief, 60 ml syringes containing liquids are loaded into BS-8000 syringe pumps (Braintree Scientific). Each syringe dispenses its liquid into 25 feet of Tygon beverage tubing (Saint-Gobain Performance Plastics) that is connected to a custom-designed Teflon manifold mounted on the MRI head coil. Individually machined channels in the manifold funnel into a silicon tube resting in the mouth and allows the liquids to drip from the mouthpiece onto the tongue. Subjects receive 0.5 ml of solution over 4 s during each taste delivery event.
Odors were presented by a custom-built olfactometer programmed in Labview (National Instruments). A detailed description of the olfactory stimulation system, based upon the design by Johnson and Sobel (2007), can be found in a previous publication (Small et al., 2008). In brief, mass flow controllers (MKS Instruments) adjust the flow of humidified and temperature-controlled air over odorant-containing wells so that the air picks up vaporized odor molecules. The odor channels then converge into a mixing manifold and exit through one of two 25 foot Teflon tubes, the first of which is dedicated to odors and the second to nonodorized clean air. The trunk terminates in a custom-built Teflon manifold (Teqcom) that rests on the subject's torso. The manifold is connected to a vacuum line that creates a closed loop to evacuate odorless and odorized air and prevent contamination of the headspace. The subjects receive the olfactory stimuli through a nasal mask (Philips Respironics) attached to the manifold. Air exits the nasal manifold and is drawn out through a final Teflon tube by another vacuum line.
Experimental procedures.
Subjects took part in one fMRI training session, three fMRI scanning sessions (hungry, sated, and ad libitum conditions), and one behavioral test session at which BMI was calculated as weight (in kilograms) divided by the squared height (in meters) of the subject (BMI = kg/m2). All sessions were conducted on separate days within 3 months and scan order was counterbalanced. Here, we focus on data from the hungry and sated scan conditions (elapsed days between sessions M = 22.8, SD = 14.6, range = 7–70) because there was extreme variability in caloric intake in the ad libitum session lunch (range = 113–1395 kcal). Because this variability could confound the present analysis, the ad libitum condition was excluded.
fMRI training session.
Subjects were instructed to refrain from eating or drinking anything other than water for at least 1 h before the session. Upon arrival, subjects were trained to make computerized ratings of their internal state as well as the perceptual qualities of various stimuli on computerized scales. Internal state ratings were made up of a series of adapted cross-modal general labeled magnitude scales (gLMS) consisting of a 100 mm vertical line scale with the labels “barely detectable” at the lower anchor point and “strongest imaginable sensation” at the upper anchor point (Green et al., 1993, 1996; Bartoshuk et al., 2004). Subjects were instructed to rate the intensity of their feelings of hunger, fullness, thirst, anxiety, and need to urinate. The perceptual qualities of the stimuli consisted of ratings of their intensity, liking, familiarity, edibility, and wanting to eat. Intensity was measured using the gLMS. Liking was measured using a labeled hedonic scale consisting of a 100 mm vertical line scale with the labels “most disliked sensation imaginable” at the lower anchor point, “most liked sensation imaginable” at the upper anchor point, and “neutral” in the middle (Lim et al., 2009). Edibility, familiarity, and wanting to eat were rated on 200 mm crossmodal visual analog scales labeled at the left (−10), center (0), and right (+10) anchor points. Edibility labels were “not edible at all” at (−10), neutral at (0), and “very edible” at (+10). Familiarity labels were “not familiar at all” (−10), “neutral” (0), and “very familiar” (+10). Wanting to eat labels were “I would never want to consume this” (−10), “neutral” (0), and “I would want to consume this more than anything” (+10).
Subjects were then brought to a mock fMRI scanner and outfitted with the taste and odor delivery systems. First, each odor was delivered one at a time and subjects verbally rated the intensity of each presentation on the gLMS. An experimenter then manually adjusted the odorant concentration settings on the olfactometer so that each odor was rated as moderate in intensity. Next, subjects practiced making internal state ratings as well as perceptual ratings of each of the odors and tastes using a mouse on a computer monitor viewed via back projection on a head-coil-mounted mirror.
After completing the ratings, subjects were inserted into the bore of the mock scanner and underwent simulations of one taste run and one odor run, the details of which are specified in Figure 1, A and B. After the simulated scanner runs, subjects were removed from the bore and asked to make a second round of internal state and stimulus perception ratings. They were then provided with breakfast bars and instructed to eat them for breakfast on the morning of their next session.
Figure 1.

fMRI stimulus presentation and session design. A, The taste run was 6 m 32 s long and consisted of the uncued delivery of 2 different types of stimuli: 1, a 4 s delivery of either chocolate or strawberry milkshake, followed by a 6–13 s rest period, a 4 s tasteless rinse, and another 6–13 s rest period; or 2, a 4 s delivery of tasteless solution, followed by a 6–13 s rest period. The subjects were instructed to swallow and exhale through their nose after receiving each liquid. There were 10 repetitions of each of the two events of interest (milkshake and tasteless), resulting in 20 presentations per run. B, The odor run was 5 m 54 s long and subjects were instructed to breathe in through their nose after receiving the prerecorded verbal instructions “3, 2, 1, sniff” through headphones. Odor or odorless delivery occurred immediately after the auditory cue so that delivery was time locked to sniff onset. Olfactory stimulation lasted for 3 s, followed by a 9–19 s rest period before the next trial. There were six repetitions of each of the three events of interest (food odor, nonfood odor, odorless), resulting in 18 presentations per run. C, During fMRI scan sessions, subjects made internal state ratings at each time point (1–9). At time point 1, a Teflon catheter was inserted into an antecubital vein for blood sampling. Subsequent asterisks (*) indicate IV blood draws that occurred concomitant to internal state ratings. After time point 3, subjects ate either a fixed-portion meal (at the sated scan, consisting of 1 sandwich and 1 serving of apple slices for women, 1.5 sandwiches and 1 serving of apple slices for men) or nothing (at the hungry scan). T (time) = 0 indicates time of meal onset. Subjects made postmanipulation internal state ratings at time point 4 and then were taken to the scanner, outfitted with the stimulus delivery devices, and inserted into the bore. Internal state ratings and further blood samples were collected at T = 30, 60, and 90 min from meal onset. Perceptual ratings of the stimuli were collected as in the training session inside the scanner before and after scanning. After subjects were removed from the scanner, they were taken to a behavioral testing room, where they were presented with both flavors of milkshake followed by the tub of cheese pasta and instructed to eat ad libitum from both. Milkshake and pasta intake were recorded without the subjects' knowledge by weighing before and after consumption.
fMRI scanning sessions.
On the morning of the scan, subjects ate the breakfast bars (1 package for women, 1.5 packages for men) and were instructed to refrain from eating or drinking, with the exception of water, until their session began at 12:15 pm. A description of scan day procedures, including blood draw protocol, is detailed in Figure 1C.
Imaging data were acquired on a Siemens 3.0 tesla TIM Trio Scanner at the Yale University Magnetic Resonance Research Center. High-resolution T1-weighted structural scans were acquired for each subject with TR = 2230 ms, TE = 1.73 ms, flip angle = 9°, matrix = 256 × 256, 1 mm thick slices, FOV = 250 × 250, 176 slices. The subjects underwent separate odor and taste fMRI runs as described in the training session. Two taste runs and four odor runs were collected at each scan. Three subjects were determined at training or first scan to poorly tolerate the nasal mask and were therefore scanned with tastes only. For these subjects, additional anatomical and resting state scans were performed to make the session duration as similar to that of the other subjects as possible. A susceptibility-weighted single-shot echoplanar sequence was used to image regional distribution of the BOLD signal. At the beginning of each functional run, the MR signal was allowed to equilibrate over six scans for a total of 12 s, which were subsequently excluded from the analyses. Acquisition parameters were as follows: TR = 2000 ms, TE = 20 ms, flip angle = 80°, FOV = 220, matrix = 64 × 64, slice thickness = 3 mm. Forty contiguous slices were acquired in an interleaved method to reduce the cross talk of the slice selection pulse.
One-year follow-up.
Subjects returned to the laboratory as close as possible to 1 year from the exact date that their initial anthropometric measurements were taken (elapsed weeks M = 53.0 SD = 3.0, range = 49.1–61.3). Two subjects who had moved away from New Haven and were unable to return were instructed to weigh themselves on a digital scale with minimal clothing and self-report their new weight via E-mail. Follow-up BMI was obtained and change in BMI (ΔBMI) was calculated by subtracting initial BMI from follow-up BMI values.
Data analysis.
Blood samples obtained at each scan were centrifuged immediately and kept on ice until after the session, whereupon they were frozen at −80°C. Total ghrelin levels were measured with a commercially available radioimmunoassay (catalog #GHRT-89HK; EMD Millipore) that uses 125I-labeled ghrelin and a ghrelin antiserum to determine the level of total ghrelin by the double antibody technique.
Planned comparisons of behavioral data were analyzed in PASW Statistics 18 (SPSS) using repeated-measures ANOVA, independent-samples t tests, and Pearson correlation. Perceptual ratings of stimulus intensity on the gLMS were log10 transformed and standardized within each subject (Green et al., 1996). Postscan ad libitum milkshake and pasta intake was converted from grams to kilocalories using information provided on the nutritional facts labels by the manufacturers of the ingredients. One subject's internal state ratings were discarded due to technical malfunction. To correct for multiple comparisons, an α level of 0.05 ÷ 9 (.0055) was used as the threshold for significance for internal state analyses (9 time points) and an α level of 0.05 ÷ 10 (.005) was used as the threshold for significance for perceptual ratings data (5 perceptual qualities per stimulus, 2 types of stimuli).
Neuroimaging data were preprocessed using the SPM8 software (Statistical Parametric Mapping, Wellcome Department of Imaging Neuroscience, London, UK) in MATLAB R2010b version 7.11.0 (The MathWorks). Functional images were time-acquisition corrected to the slice obtained at 50% of the TR and realigned to the mean image. Anatomical and functional images were normalized to the standard MNI template brain implemented in SPM8, resulting in voxel sizes of 1 and 3 mm3, respectively. Functional time-series data were detrended and then smoothed using a 6 mm FWHM isotropic Gaussian kernel. The Artifact Detection Tools (ART) toolbox for MATLAB was used to detect global mean and motion outliers in the functional data (Gabrieli Laboratory, McGovern Institute for Brain Research, Cambridge, MA). Motion parameters were included as regressors in the design matrix at the single-subject level. In addition, image volumes in which the z-normalized global brain activation exceeded 3 SDs from the mean of the run or showed > 1 mm of composite (linear plus rotational) movement were flagged as outliers and deweighted during SPM estimation.
Two separate design matrices were created for each subject: one for the odor runs across all scan days and one for the taste runs across all scan days. Each design matrix specified the onset and duration of each of the events of interest. The odor runs produced three events of interest: (1) the food odors, (2) the nonfood floral odors, and (3) odorless. Event onsets were defined as the beginning of odor onset and event durations were defined as the 3 s of odor delivery. The auditory cue to sniff was modeled as an event of no interest. The taste run produced two events of interest: milkshake and tasteless control. Event onsets were defined as the beginning of liquid delivery and event durations were defined as the 4 s of taste delivery. The rinse was modeled as an event of no interest. A 270 s high-pass filter was applied to the time-series data with the aim of removing low-frequency noise and slow signal drifts. The general linear model was used to estimate condition-specific effects at each voxel. A canonical hemodynamic response function, including a temporal derivative, was used to model neural response to events of interest.
Second-level SPM analyses are restricted to the prospective data because we have previously reported the findings pertaining to the main effects of stimulus and internal state (Sun et al., 2014). To test the association between BOLD response to the taste (Milkshake > Tasteless; M > T) and smell (Food Odors > Odorless; F > Ol) of milkshake with weight change, one-sample t test random effects analyses were performed in which the M > T and F > Ol contrasts at hungry and sated scans were regressed separately against ΔBMI. To examine sex- or genotype-specific relationships between brain response to food cues and weight change, full factorial ANOVAs for the contrasts of M > T and F > Ol were performed in which sex or TaqIA allele status (A1+ or A1−) was entered as a group variable that interacted with the regression against ΔBMI. To investigate whether ghrelin signaling influenced relationships between brain response and weight change, for the sated scan, we regressed peak postmeal plasma ghrelin change against brain response to food cues. For the hungry scan, because no lunch was eaten, average ghrelin response across all time points was used. For all SPM analyses, the t-map threshold was set at puncorrected < 0.005 and a 5-voxel cluster size. Unpredicted responses were considered significant at a peak-level p < 0.05 familywise error (FWE) corrected across the entire brain for multiple comparisons; none were identified. For predicted responses, a region of interest (ROI) approach was used. Because animal work shows that amygdala subregions have dissociable roles in the regulation of feeding-related behavior (Hatfield et al., 1996; Holland et al., 2002; Petrovich et al., 2009; Root et al., 2014), for the amygdala, binarized anatomical masks of bilateral BLA, superficial amygdala (SFA), and centromedial amygdala (CMA) were adapted from the SPM Anatomy toolbox (Eickhoff et al., 2005; Fig. 2). Because the hypothalamus mask from Wake Forest University (WFU) PickAtlas version 2.3 is only 6 voxels (Lancaster et al., 1997, 2000; Maldjian et al., 2003, 2004), and therefore at the limit of our spatial resolution, we selected 2 5-mm-radius spheres, taking care to avoid the third ventricle. Automated Anatomical Labeling from WFU PickAtlas version 2.3 was used to create a mask of the caudate (Tzourio-Mazoyer et al., 2002). Peaks in ROI analyses were considered significant at a peak level of p < 0.05 FWE corrected across the total number of voxels across the ROI.
Figure 2.
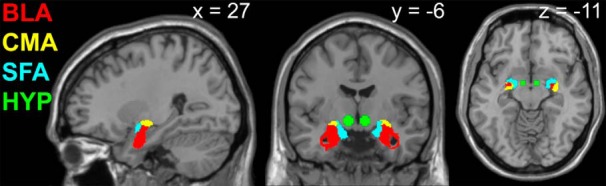
Anatomical masks of amygdala subregions and spheres encompassing the hypothalamus used in ROI analyses of fMRI data. Red, BLA; yellow, CMA; blue, SFA; green, hypothalamus (HYP).
To assess effect sizes unbiased from the peak location within a ROI and to conduct regression analyses, we extracted the first eigenvariate time courses from the amygdala subregion ROIs and subjected these values to a number of analyses. First, we extracted the predictions for the hemodynamic responses of the modeled design (“SPM design matrices”) and concatenated runs within conditions so that we could compute ordinary least squares contrast estimates for every subject and condition using HLM 7 (Scientific Software). We then bootstrapped correlation coefficients of contrast estimates with ΔBMI for A1+ and A1− individuals, respectively. The resulting empirical bootstrap distribution of the correlation coefficients were plotted to visualize interactions of brain activation with genotype. These confidence intervals can be used as expectations (or “priors”) for future studies and the overlap corresponds to p-values of the difference (Cumming and Finch, 2005). Finally, we predicted ΔBMI using stepwise regression analysis (step 1: TaqIA; step 2: brain activation; step 3: interaction terms, TaqIA × brain activation; step 4: ghrelin changes).
We used dynamic causal modeling (DCM) with version 10 in SPM8 (Friston et al., 2003) to evaluate network dynamics between the BLA and hypothalamus under the different internal states. Seven models of event-related information flow between predefined anatomical source regions, or nodes, were constructed and estimated for each subject. The nodes in this case were the BLA and the hypothalamus, which were defined using the same masks as described above and, as informed by the BOLD results, restricted to the right hemisphere only. Only ipsilateral connections were investigated because crossed connections between the amygdala and hypothalamus are rare (Ottersen and Ben-Ari, 1979; McDonald and Culberson, 1986). The first eigenvariate of the time series was extracted at the single-subject level for right BLA and hypothalamus ROIs. Milkshake and tasteless events at the sated scan were specified as driving inputs, or external stimuli that perturb the system to generate network activity along intrinsic connections between nodes. The models differed in the site of action of the driving inputs (at BLA only, at hypothalamus only, or both) and the direction of information flow between nodes (from BLA to hypothalamus only, from hypothalamus to BLA only, or bidirectional). No modulatory variables were included in the models. Random effects Bayesian model selection was then run on the Hungry and Sated sessions separately, comparing all models using the free energy approximation to the log evidence for each model (Stephan et al., 2009). This procedure compares each theoretical model against the actual observed data and selects the model among the candidates that has the best fit under each condition.
Results
Demographics
By design, A1+ and A1− groups did not significantly differ in age (A1−: M = 24.6, SD = 4.9; A1+: M = 26.1, SD = 6.3; t = −0.74, p = 0.46), sex distribution (A1−: M = 0.47, SD = 0.51; A1+: M = 0.60, SD = 0.51; t = −0.72, p = 0.48), or BMI (A1−: M = 24.0, SD = 4.11; A1+: M = 26.8, SD = 4.49; t = −1.84, p = 0.08) as assessed by independent-samples t test.
Ratings and intake
Subjective feelings of satiation at nine time points during each session were assessed by subtracting hunger from fullness ratings. Condition effects at each time point were assessed with repeated-measures ANOVA (Fig. 3). There was a main effect of condition (F(1,29) = 164.2, p < 0.001) in which subjects felt more satiated at the sated versus hungry session, as well as a main effect of time point (F(8,232) = 66.15, p < 0.001) that was qualified by a significant condition by time point interaction (F(8,232) = 46.81, p < 0.001). Pairwise comparisons revealed that baseline satiation did not differ between hungry and sated sessions (time point 1, p = 0.78; time point 2, p = 0.13; time point 3, p = 0.63), but at the sated session increased after consumption of a lunch (time point 4, p < 0.001). This difference in satiation between hungry and sated sessions persisted throughout fMRI scanning (time point 5, p < 0.001; time point 6, p < 0.001; time point 7, p < 0.001). Objective satiation was also assessed by covertly measuring ad libitum intake of milkshake and pasta after the scan. As expected, subjects ingested more kilocalories during the ad libitum meal at the hungry session than the sated session (F(1,31) = 27.53, p < 0.001). Subjects also reported higher levels of satiation at the sated session than at the hungry session after drinking the milkshake at the postscan ad libitum meal (time point 8, p < 0.001; Fig. 3), but this difference disappeared after eating the pasta (time point 9, p = 0.06). No significant interactions with or main effects of genotype were found for postscan caloric intake (main effect of genotype F(1,30) = 0.21, p = 0.65; genotype × condition interaction F(1,30) = 1.58, p = 0.22) or subjective satiation (main effect of genotype F(1,29) = 2.05, p = 0.16, genotype × condition interaction F(1,29) = 0.54, genotype × time interaction F(8,232) = 0.97, genotype × time × condition interaction F(8,232) = 0.68).
Figure 3.
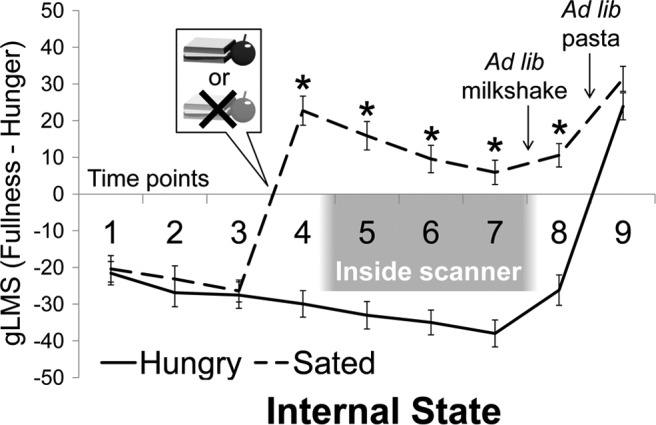
Experimental manipulation of internal state. Subjective ratings of satiation under hungry and sated scan conditions significantly differed after the lunch manipulation. *p < 0.001.
Weight change
As a group, the subjects remained relatively weight stable at the 1 year follow-up (ΔBMI M = 0.2, SD = 1.2). However, there was a considerable range in ΔBMI spanning from −2.0 to 2.3, equivalent to changes in weight of −13 lb/5.89 kg to +16 lb/7.26 kg. ΔBMI in the whole group was not significantly correlated with stimulus liking (food odor r = −0.02, p = 0.93, milkshake r = 0.26, p = 0.16), intensity (food odor r = −0.25, p = 0.19, milkshake r = 0.18, p = 0.32), edibility (food odor r = −0.17, p = 0.37, milkshake r = 0.32, p = 0.07), familiarity (food odor r = 0.01, p = 0.97, milkshake r = 0.28, p = 0.12) or wanting (food odor r = −0.29, p = 0.13, milkshake r = 0.06, p = 0.75), or with caloric intake at the postscan ad libitum meal (hungry r = 0.08, p = 0.67; sated r = −0.10, p = 0.59); nor was it related to age (r = −0.24, p = 0.19), sex (t = 0.51, p = 0.78), initial BMI (r = −0.18, p = 0.33) or elapsed time between initial and follow-up weight measurements (r = −0.03, p = 0.88). There was no effect of genotype on ΔBMI (A1−: M = 0.09, SD = 1.21; A1+: M = 0.31, SD = 1.32; t = −0.48, p = 0.64) or time elapsed between initial and follow-up weight measurements (A1−: M = 53.91, SD = 3.16; A1+: M = 53.13, SD = 2.94; t = 0.72, p = 0.48), nor were there significant genotype-specific relationships between ΔBMI and sex (A1−: t = −0.53, p = 0.60, A1+: t = 1.03, p = 0.32), initial BMI (A1−: r = −0.04, p = 0.88, A1+: r = −0.39, p = 0.15), age (A1−: r = 0.04, p = 0.87, A1+: r = −0.49, p = 0.06), elapsed time between initial and follow-up weight measurements (A1−: r = −0.26, p = 0.31, A1+: r = 0.26, p = 0.35); stimulus intensity (A1−: food odors r = −0.29, p = 0.30, milkshake r = 0.26, p = 0.32; A1+: food odors r = −0.38, p = 0.18, milkshake r = 0.11, p = 0.70), wanting (A1−: food odors r = −0.02, p = 0.94, milkshake r = 0.29, p = 0.27; A1+: food odors r = −0.43, p = 0.12, milkshake r = −0.10, p = 0.73); or caloric intake at the postscan ad libitum meals (A1−: hungry r = −0.03, p = 0.89, sated r = −0.06, p = 0.82; A1+: hungry r = 0.17, p = 0.54, sated r = −0.12, p = 0.66). Statistically significant genotype-specific relationships were also not found between ΔBMI and food odor liking (A1−: r = 0.48, p = 0.07, A1+: r = −0.40, p = 0.16), edibility (A1−: r = −0.03, p = 0.91, A1+: r = −0.32, p = 0.26), and familiarity (A1−: r = 0.26, p = 0.35, A1+: r = 0.53, p = 0.53). ΔBMI was positively correlated in A1−, but not A1+, individuals with milkshake liking (A1−: r = 0.73, p = 0.001, A1+: r = −0.10, p = 0.73), edibility (A1−: r = 0.50, p = 0.043, A1+: r = 0.13, p = 0.65), and familiarity (A1−: r = 0.49, p = 0.046, A1+: r = −0.06, p = 0.84), although only liking survived correction for multiple comparisons.
Weight change and amygdala response
To determine whether BLA reactivity to food cues could predict future weight change, we correlated ΔBMI with BOLD response to the smell (F > Ol) and taste (M > T) of food at sated and hungry sessions using an ROI approach with bilateral masks anatomically defining BLA, CMA, and SFA subregions. The decision was made to use the contrast of F > Ol rather than Food Odors > Nonfood Odors for the odor analyses because, although subjects reliably rated the food odors as edible, they did not reliably rate the nonfood odors as inedible. A summary of fMRI correlations with weight change can be found in Table 1. In the sample as a whole, we found no relationship between ΔBMI and amygdala responses to either the taste or smell of milkshake. We then tested whether correlations would emerge if we took interactions with individual factors into account. No statistically significant sex interactions were observed with ΔBMI and food taste or smell reactivity in the whole brain or within our amygdala ROIs. However, we found that when A1 allele carrier status was considered, right BLA reactivity to milkshake at the sated scan, but not at the hungry scan, was positively associated with ΔBMI in A1−, but not in A1+ (ROI analysis of M > T Sated, A1− > A1+; pFWE-peak = 0.007; Fig. 4). This interaction remained significant after adding milkshake liking, edibility, and familiarity as covariates of no interest (because they also correlated with ΔBMI in A1−).
Table 1.
Brain areas showing correlations between BOLD response to food cues and ΔBMI when interactions between genotypes are considered
| Stimulus | Condition | A1 | Correlation with ΔBMI | ROI | Size | pFWE-peak | MNI coordinates |
L/R | Z | ||
|---|---|---|---|---|---|---|---|---|---|---|---|
| x | y | z | |||||||||
| M > T | Sated | − | + | BLA | 21 | 0.007 | 39 | −1 | −23 | R | 3.82 |
| 0.043 | 30 | −7 | −20 | R | 3.24 | ||||||
| F > Ol | Hungry | − | − | BLA | 18 | 0.027 | 27 | −1 | −20 | R | 3.44 |
| SFA | 7 | 0.028 | 30 | −1 | −17 | R | 3.26 | ||||
| M > T | Hungry | + | + | Caudate | 31 | 0.044 | 18 | 20 | −5 | R | 3.54 |
Italicized text indicates statistically significant subpeaks within the cluster.
Figure 4.

Relationship between ΔBMI and amygdala response to the taste of palatable food. Predicted correlations (ROI analysis) between ΔBMI and BLA response to M > T at the sated scan that interact with genotype, with peaks at x, y, z = 39, −1, −23 (A) and x, y, z = 30, −7, −20 (B). Scatterplots show the relationship between ΔBMI and parameter estimates at the peak voxel in that region for A1+ and A1−. Note that, whereas there appears to be a negative correlation between BLA response and ΔBMI in A1+, this relationship does not meet criteria for statistical significance outside of the peak voxel. Color bars depict t-values. C, Histogram shows group differences in the relationship between ΔBMI and BLA response to M > T Sated. Bootstrapping was used to depict the observed sample distribution of the correlation coefficient separately for A1+ and A1−. Density on the y-axis reflects the likelihood of observing a particular correlation coefficient value (x-axis) and is higher if estimated correlations within groups are more homogenous. Lesser distribution overlap corresponds to stronger group differences.
Conversely, reactivity to food odors in the hungry, but not sated, scan was negatively correlated with weight change in the right BLA (ROI analysis of F > Ol Hungry, again in A1− but not A1+ (pFWE-peak = 0.027; Fig. 5A,B). A similar effect was observed in the right SFA (ROI analysis of F > Ol Hungry, A1− < A1+; pFWE-peak = 0.028; Fig. 5C,D). No interactions among genotype, weight change, and brain response to either tastes or smells were observed in CMA. To ensure that A1+ individuals trending toward slightly higher BMIs were not driving this effect, we included initial BMI as a covariate of no interest in these genotype interaction analyses and obtained similar results.
Figure 5.

Relationship between ΔBMI and amygdala response to the smell of palatable food. Predicted correlations (ROI analysis) between ΔBMI and BLA response to F > Ol at the hungry scan that interact with genotype in BLA with peak at x, y, z = 27, −1, −20 (A) and SFA with peak at x, y, z = 30, −1, −17 (C). Scatterplots show the relationship between ΔBMI and parameter estimates at the peak voxel. Color bars depict t-values. Histograms show group differences in the relationship between ΔBMI and brain response to F > Ol Hungry in BLA (B) and SFA (D). Bootstrapping was used to depict the observed sample distribution of the correlation coefficient separately for A1+ and A1−. Density on the y-axis reflects the likelihood of observing a particular correlation coefficient (x-axis) and is higher if estimated correlations within groups are more homogenous. Lesser distribution overlap corresponds to stronger group differences.
We also wished to quantify the relative contributions of our variables of interest (e.g., brain response, genotype, and the interaction thereof) to the prediction of ΔBMI in a manner unbiased by the peak voxel. Because this is not possible in SPM, we extracted parameter estimates to use in stepwise regression analyses within SPSS. First, TaqIA (step 1) and parameter estimates from the right BLA for M > T Sated and F > Ol Hungry (step 2) were regressed together against ΔBMI and, consistent with the SPM results, did not predict weight change (R2 = 0.06; p > 0.4 for both steps). However, the addition of the genotype × BLA response interaction term as a third step in the regression significantly improved model fit (R2 = 0.44; ΔR2 = 0.38, F(2,23) = 7.82, p = 0.003). Moreover, the interaction terms for both tastes and odors had significant univariate contributions to the prediction of weight change (taste: β = −0.40, p = 0.036; odors: β = 0.40, p = 0.026).
Reliability of amygdala response
Next, to determine the reliability of the amygdala response, we correlated the extracted ROI data across internal state, subregion, and stimulus (Fig. 6). Responses in BLA, CMA, and SFA to M > T were strongly correlated with each other within, but not across internal state. For the food odors, the BLA correlated with CMA and SFA within the internal state condition, but CMA and SFA response to odors were not correlated with each other in any state. Most importantly, response in the BLA to the tastes and odors correlated with each other in the sated but not the hungry state. This suggests that, even though the association between food odors and ΔBMI did not reach significance, there was nevertheless a similar response pattern for the smell and taste of milkshake in the sated state. Indeed, when the SPM t-map threshold was lowered to puncorrected < 0.05, we observed a weak interaction with genotype in the relationship between ΔBMI and BLA response to food odors when sated (ROI analysis of F > Ol Sated, A1− > A+; pFWE-peak = 0.327). These patterns of correlation across the matrix support the reliability of the responses.
Figure 6.

Correlation matrix of extracted amygdala parameter estimates. Values are correlation coefficients and are color coded (see color bar). Bolded values denote statistically significant (p < 0.05) correlations.
Dynamic causal modeling
We did not observe associations between ΔBMI and BOLD response to food cues in the hypothalamus. Because the animal literature predicts that, in satiety, food cues gain access to the hypothalamus through the BLA, we tested seven models of information flow between the BLA and hypothalamus in the right hemisphere: Model 1: input into BLA, bidirectional connection between BLA and hypothalamus; Model 2: input into BLA, unidirectional connection from BLA to hypothalamus; Model 3: input into hypothalamus, bidirectional connection between BLA and hypothalamus; Model 4: input into hypothalamus, unidirectional connection from hypothalamus to BLA; Model 5: input into BLA and hypothalamus, bidirectional connection between BLA and hypothalamus; Model 6: input into BLA and hypothalamus, unidirectional connection from BLA to hypothalamus; and Model 7: input into BLA and hypothalamus, unidirectional connection from hypothalamus to BLA (Fig. 7A). Because DCM stipulates that driving inputs (in this case, milkshake and tasteless) act on at least one node to generate network activity along intrinsic connections between them, these seven models represent all possible models of taste information flow along ipsilateral connections between BLA and hypothalamus. After all seven models were estimated for each subject, we used random-effects Bayesian model selection under each condition separately to select which model best explained the observed data. At the sated scan, Bayesian model selection strongly supported Model 2, in which driving inputs enter the BLA, which in turn signals unidirectionally to the hypothalamus (i.e., exceedance probability; the probability that a particular model is the most likely in the set of models tested to have generated the observed data = 0.861; Fig. 7B). In contrast, at the hungry scan, Model 3, in which driving inputs enter the hypothalamus and undergoes steady-state connectivity with the BLA is the winning model (exceedance probability = 0.740; Fig. 7C).
Figure 7.

Dynamic causal modeling. A, Schematic of the seven dynamic causal models tested. A, BLA; H, hypothalamus. White text on black circles indicates input of Milkshake and Tasteless into that node. Arrows indicate directionality of intrinsic connections between nodes. B, Results of Bayesian model selection at Sated scan selecting Model 2 as the “winning” model. C, Results of Bayesian model selection at Hungry scan selects Model 3 as the “winning” model.
Associations with circulating ghrelin levels
Because amygdala response to visual food cues has been associated with circulating levels of the orexigenic hormone ghrelin (Malik et al., 2008; Kroemer et al., 2013), we next tested for relationships between levels of circulating total ghrelin and amygdala response to food cues in a subset of subjects who were able to tolerate intravenous blood sampling (n = 25). At the hungry scan, average total ghrelin was not correlated with amygdala response to either the taste or smell of milkshake, nor were there interactions with TaqIA allele status. Average total ghrelin when hungry was also not correlated with ΔBMI in the whole group (r = −0.30, p = 0.15), or as a function of genotype (A1−: r = −0.02, p = 0.94, p = 0.64; A1+: r = −0.46, p = 0.13). At the sated scan, maximal total ghrelin change occurred 90 min after the meal (M = −170.0 pg/ml, SD = 167.7; Fig. 8A). A summary of fMRI correlations with ghrelin change at this time point can be found in Table 2. The extent of the ghrelin response was positively associated with BOLD reactivity to milkshake in left BLA (ROI analysis of M > T Sated, pFWE-peak = 0.028; Fig. 8B) and bilateral CMA (ROI analysis of M > T Sated, pFWE-peak = 0.014; Fig. 8C), replicating prior work. No correlations with ghrelin change were observed with the response to the taste of milkshake in SFA or with brain response to odors in any amygdala subregion. Genotype did not interact with the relationship between ghrelin change and brain response. Including postprandial ghrelin response as a covariate in the analysis of the interaction among genotype, ΔBMI, and brain response to milkshake at the sated scan resulted in the significance of correlation in BLA being reduced to trend level (ROI analysis of M > T Sated, A1− > A1+; pFWE-peak = 0.058). However, postprandial change in total ghrelin did not itself correlate with ΔBMI in either the whole sample (r = −0.04, p = 0.86) or as a function of genotype (A1− r = 0.14, p = 0.64; A1+ r = −0.15, p = 0.64), suggesting that the relationship between BLA response and weight change is not mediated by postprandial ghrelin response. Consistent with these results, the stepwise regression analyses using extracted BLA parameter estimates showed that the interactions of TaqIA × BLA were still significant if ghrelin change was added to the model (step 4). Change in ghrelin levels also did not increase the fit of the model (ΔR2 = 0.00, F(1,16) = 0.49, p = 0.83).
Figure 8.

Ghrelin analyses. A, Mean decrease in plasma concentrations of total ghrelin at t = 30, t = 60, and t = 90 min after lunch onset at sated scan. Predicted correlations (ROI analysis) between extent of postprandial ghrelin suppression at t = 90 min after lunch onset at sated session and brain response to M > T at sated scan in BLA cluster with peak at x, y, z = −24, −7, −11 (B; R BLA cluster NS), and CMA clusters with peaks at x, y, z = −27, −10, −11 and x, y, z = 27, −10, −11 (C). Scatterplots show the relationship between postprandial ghrelin change at t = 90 min after lunch and parameter estimates at the peak voxel in that region. Color bars depict t-values.
Table 2.
Amygdala subregions showing non-genotype-specific correlations between BOLD response to food cues and postprandial ghrelin response
| Stimulus | Condition | Correlation with ghrelin | ROI | Size | pFWE-peak | MNI coordinates |
L/R | Z | ||
|---|---|---|---|---|---|---|---|---|---|---|
| x | y | z | ||||||||
| M > T | Sated | + | BLA | 6 | 0.028 | −24 | −7 | −11 | L | 3.39 |
| CMA | 8 | 0.014 | −27 | −10 | −11 | L | 3.31 | |||
| CMA | 8 | 0.018 | 27 | −10 | −11 | R | 3.05 | |||
Weight change and caudate response
Finally, because prior work has shown significant negative correlations between response to milkshake in the caudate nucleus and weight gain in A1+ but not A1− subjects (Stice et al., 2008a), we investigated the effect of genotype on the relationship between caudate response to milkshake and weight gain. For this analysis, we used the data collected in the hungry scan because prior studies were conducted in a fasted state. Surprisingly, we found a positive correlation with right caudate response and ΔBMI in A1 carriers, but not noncarriers (ROI analysis of M > T Hungry, A1+ > A1−; pFWE-peak = 0.044; Fig. 9A,B). That is, the relationship between caudate response to milkshake and weight change was again dependent upon A1 allele status, but the direction was the opposite of what has been observed previously. One important difference between the two studies is that in the initial experiment milkshake delivery was cued and therefore predicted. Here, milkshake delivery was not cued and occurred at randomized intervals; hence receipt was unpredicted.
Figure 9.

Relationship between ΔBMI and caudate response to the taste of palatable food. A, Predicted correlation (ROI analysis) between ΔBMI and caudate response to M > T at hungry scan that interacts by genotype, with statistically significant cluster in caudate with peak at x, y, z = 18, 20, −5. Scatterplot shows the relationship between ΔBMI and parameter estimates at the peak voxel in that region. Color bars depict t-values. B, Histogram shows group differences in the relationship between ΔBMI and caudate response to M > T Hungry. Bootstrapping was used to depict the observed sample distribution of the correlation coefficient separately for A1+ and A1−. Density on the y-axis reflects the likelihood of observing a particular correlation coefficient value (x-axis) and is higher if estimated correlations within groups are more homogenous. Lesser distribution overlap corresponds to stronger group differences.
Discussion
In times of plenty, organisms eat beyond homeostatic need to store energy for times of famine. Circuits thus evolved to support this “nonhomeostatic” feeding. In rodents, the BLA plays a key role in this specialized circuit by promoting feeding in the absence of homeostatic need (Holland et al., 2002; Petrovich et al., 2002). Here, we provide evidence for a similar role for the BLA in humans. First, we demonstrate that BLA response to milkshake when sated but not hungry is associated with ΔBMI in TaqIA A1 allele noncarriers (∼2/3 of the population; Noble, 2003). Second, consistent with the idea that external cues gain access to the hypothalamus via the amygdala to override homeostatic monitoring, our DCM analyses suggest that, when sated, signals from the amygdala unidirectionally influence hypothalamic activity. In contrast, during hunger, hypothalamic activity drives a bidirectional association with the amygdala, possibly reflecting an increased influence of the hypothalamus on this circuit during hunger. Third, we observed a negative association between weight gain and amygdala response to food odors while hungry but not sated. In other words, future weight gain is associated with weaker amygdala response to food odors when hungry, suggesting that amygdala insensitivity to hunger signals promotes weight gain. Collectively, these findings support a role for the BLA–hypothalamic circuit in nonhomeostatic eating and weight gain susceptibility.
Amygdalo-hypothalamic circuit and nonhomeostatic feeding
The amygdala is involved in stimulus–reward learning by mediating the formation and updating of conditioned associations between stimuli and their reward value (Baxter and Murray, 2002). This is critical for feeding because it allows organisms to associate food cues with the positive effects of their ingestion, promoting further consumption. Animal work shows that the BLA is required for food-predictive external cues to promote eating in the absence of homeostatic need because crossed unilateral lesions of the BLA and lateral hypothalamus disrupt cue-potentiated feeding (Petrovich et al., 2002, 2005). Therefore, projections from the BLA to the hypothalamus are necessary for learned cues to trigger nonhomeostatic feeding behavior in animals.
Our paradigm capitalized on the familiar smell and taste of milkshake as learned calorie-predictive cues. The amygdala responds to food cues in neuroimaging studies (O'Doherty et al., 2002; Small et al., 2008), and amygdala lesions impair the formation of conditioned preferences for food-predictive images (Johnsrude et al., 2000). Heightened amygdala response to food cues and altered amygdala connectivity with the ventral striatum have also been associated with obesity and obesity-promoting traits such as externalized eating (Beaver et al., 2006; Holsen et al., 2006; Stoeckel et al., 2008, 2009; Passamonti et al., 2009; Boutelle et al., 2014). Our results extend this literature by showing that, in the amygdala, heightened food cue reactivity in the absence of hunger and decreased food cue reactivity during hunger convey weight gain susceptibility. Furthermore, our DCM analyses suggest that the BLA exerts influence on the hypothalamus in the absence of hunger, whereas the influence appears bidirectional during hunger. These findings indicate that the human BLA–hypothalamic circuit plays a key role in nonhomeostatic feeding and weight gain susceptibility.
Notably, the association between nonhomeostatic BLA response to milkshake and weight gain was specific for individuals who did not possess a copy of the TaqIA A1 allele. Because A1+ is associated with a 30% decrease in DRD2 density (Pohjalainen et al., 1998; Jönsson et al., 1999; Ritchie and Noble, 2003), the weight gain susceptibility conferred by amygdala hyperactivity is specific to individuals without the at-risk allele for deficient DRD2 signaling. This finding is unsurprising because the BLA is densely innervated by dopaminergic terminals (Brinley-Reed and McDonald, 1999) and expresses DRD2 (Scibilia et al., 1992). BLA infusions of the DRD2 antagonist raclopride during conditioning also disrupt the formation of stimulus–cue associations (Berglind et al., 2006), indicating that DRD2s are involved in the BLA dependent conditioning. In A1+ individuals with DRD2 deficiencies, non-BLA-mediated neural mechanisms may underlie weight gain susceptibility: A proposition supported by our finding of a A1+-specific relationship between caudate response and weight change.
Whether the association between BLA response and ΔBMI is related to ghrelin signaling is uncertain. Including change in ghrelin as a covariate reduced the association between response to milkshake and ΔBMI, indicating shared variance. However, although we observed positive associations between amygdala response to milkshake and changes in circulating ghrelin, ghrelin change was unrelated to ΔBMI. In addition, adding ghrelin change as a predictor of ΔBMI in a stepwise regression with genotype and brain response did not change the magnitude of the effect size compared with genotype and brain response alone. Animal work supports a role for ghrelin in cue-potentiated feeding in rodents (Walker et al., 2012) and, in humans, ghrelin levels are associated with amygdala response to food cues (Malik et al., 2008; Kroemer et al., 2013) and the ability of a meal to decrease brain response to milkshake (Sun et al., 2014). Therefore, ghrelin signaling is clearly involved in food cue reactivity, but it remains uncertain whether it contributes to the relationship between BLA response and ΔBMI.
One outstanding question raised by our results is why different effects occur in response to tastes versus smells. Evidence is accumulating that the rewarding effects of carbohydrates are determined by their utilization as a fuel (Tellez et al., 2013; de Araujo et al., 2013). Taste and smell both signal the arrival of nutrients to the gut, and hence fuel availability. As taste is a more proximal and reliable signal because it depends upon the nutrient already being in the mouth, sensitivity may explain the failure to observe a positive relationship between BLA response to the odors and ΔBMI. This possibility is supported by significant correlations between BLA response to the tastes and odors when sated but not when hungry and the fact that, when the significance threshold is lowered, the odors produce a similar response as the tastes. Why a negative correlation with ΔBMI exists in response to the smell but not the taste of milkshake during the hungry scan is more puzzling. One possibility is that the response reflects active monitoring of the olfactory environment for energy sources when hungry. Consistent with this possibility, the negative correlations with amygdala response to odors and ΔBMI were not BLA specific like the milkshake responses; rather, they included the SFA or cortical amygdala (Amunts et al., 2005), a subregion required for generating innate behavioral responses to odors in rodents (Sosulski et al., 2011; Root et al., 2014). Here, the decreased response would reflect a decreased ability of internal cues to guide feeding behavior rather than a conditioned response to a calorie-predictive cue. That the association did not generalize to the taste of milkshake suggests that this is specific to food seeking rather than consuming. Indeed, the externality theory proposes that weight gain results from enhanced ability of environmental cues and decreased ability of internal cues to guide ingestive behavior. The opposing amygdala associations with ΔBMI in hungry and sated conditions are consistent with this general tenant of externality theory.
Caudate nucleus and weight gain susceptibility
A revealing finding was the positive association between caudate response to milkshake when hungry and ΔBMI in A1+ only. A1+-specific associations between caudate response to milkshake and weight gain have been previously identified in the opposite direction, with lower responses predicting greater weight gain (Stice et al., 2008a). An important distinction between the two protocols was that, here, the milkshake receipt was uncued and unpredictable, whereas in the previous study it was cued and predicted. A parsimonious interpretation is that weight gain susceptibility is associated with caudate response to milkshake reward that is decreased when predicted and enhanced when unpredicted. Consistent with this possibility, a recent study by Burger and Stice (2014) found that learning to associate a cue with food receipt produces increased response to the cue but decreased response to the receipt in striatum. Moreover, the slopes of increases and decreases in striatal response observed over learning both predicted future weight gain, but were uncorrelated with each other, suggesting independent mechanisms. In addition, BMI is consistently associated with decreased caudate response to predicted milkshake receipt (Stice et al., 2008a, 2008b; Babbs et al., 2013) and increased caudate response to food pictures (Rothemund et al., 2007; Stoeckel et al., 2008; Nummenmaa et al., 2012). Future work examining the association between BMI and response to predicted and unpredicted milkshake receipt are needed to test this prediction.
Summary
Heightened sensitivity to external cues and diminished sensitivity to internal cues has been long proposed as a risk factor for weight gain (Schachter, 1968). Animal work has established that connections between the BLA and hypothalamus are critical for externalized eating. Here, we provide evidence that a similar circuit exists in humans and is associated with long-term weight gain. We also show that distinct neural mechanisms are associated with weight gain as a function of genotype, with the BLA–hypothalamic circuit associated with weight change in individuals who do not carry an at-risk allele and caudate response associated with weight change in individuals who do carry the at-risk allele.
Footnotes
This work was supported by the National Institutes of Health (Grants R01 DK85579 and PL1 DA024859) and the Deutsche Forschungsgemeinschaft (Grant KR-4555/1-1).
The authors declare no competing financial interests.
References
- Amunts K, Kedo O, Kindler M, Pieperhoff P, Mohlberg H, Shah NJ, Habel U, Schneider F, Zilles K. Cytoarchitectonic mapping of the human amygdala, hippocampal region and entorhinal cortex: intersubject variability and probability maps. Anat Embryol (Berl) 2005;210:343–352. doi: 10.1007/s00429-005-0025-5. [DOI] [PubMed] [Google Scholar]
- Babbs RK, Sun X, Felsted J, Chouinard-Decorte F, Veldhuizen MG, Small DM. Decreased caudate response to milkshake is associated with higher body mass index and greater impulsivity. Physiol Behav. 2013;121:103–111. doi: 10.1016/j.physbeh.2013.03.025. [DOI] [PMC free article] [PubMed] [Google Scholar]
- Bartoshuk LM, Duffy VB, Green BG, Hoffman HJ, Ko CW, Lucchina LA, Marks LE, Snyder DJ, Weiffenbach JM. Valid across-group comparisons with labeled scales: the gLMS versus magnitude matching. Physiol Behav. 2004;82:109–114. doi: 10.1016/j.physbeh.2004.02.033. [DOI] [PubMed] [Google Scholar]
- Baxter MG, Murray EA. The amygdala and reward. Nat Rev Neurosci. 2002;3:563–573. doi: 10.1038/nrn875. [DOI] [PubMed] [Google Scholar]
- Beaver JD, Lawrence AD, van Ditzhuijzen J, Davis MH, Woods A, Calder AJ. Individual differences in reward drive predict neural responses to images of food. J Neurosci. 2006;26:5160–5166. doi: 10.1523/JNEUROSCI.0350-06.2006. [DOI] [PMC free article] [PubMed] [Google Scholar]
- Berglind WJ, Case JM, Parker MP, Fuchs RA, See RE. Dopamine D1 or D2 receptor antagonism within the basolateral amygdala differentially alters the acquisition of cocaine-cue associations necessary for cue-induced reinstatement of cocaine-seeking. Neuroscience. 2006;137:699–706. doi: 10.1016/j.neuroscience.2005.08.064. [DOI] [PubMed] [Google Scholar]
- Blum K, Braverman ER, Wood RC, Gill J, Li C, Chen TJ, Taub M, Montgomery AR, Sheridan PJ, Cull JG. Increased prevalence of the Taq I A1 allele of the dopamine receptor gene (DRD2) in obesity with comorbid substance use disorder: a preliminary report. Pharmacogenetics. 1996;6:297–305. doi: 10.1097/00008571-199608000-00003. [DOI] [PubMed] [Google Scholar]
- Boutelle KN, Wierenga CE, Bischoff-Grethe A, Melrose AJ, Grenesko-Stevens E, Paulus MP, Kaye WH. Increased brain response to appetitive tastes in the insula and amygdala in obese compared with healthy weight children when sated. Int J Obes (Lond) 2014;39:620–628. doi: 10.1038/ijo.2014.206. [DOI] [PMC free article] [PubMed] [Google Scholar]
- Brinley-Reed M, McDonald AJ. Evidence that dopaminergic axons provide a dense innervation of specific neuronal subpopulations in the rat basolateral amygdala. Brain Res. 1999;850:127–135. doi: 10.1016/S0006-8993(99)02112-5. [DOI] [PubMed] [Google Scholar]
- Burger KS, Stice E. Greater striatopallidal adaptive coding during cue-reward learning and food reward habituation predict future weight gain. Neuroimage. 2014;99:122–128. doi: 10.1016/j.neuroimage.2014.05.066. [DOI] [PMC free article] [PubMed] [Google Scholar]
- Cohen MX, Young J, Baek JM, Kessler C, Ranganath C. Individual differences in extraversion and dopamine genetics predict neural reward responses. Brain Res Cogn Brain Res. 2005;25:851–861. doi: 10.1016/j.cogbrainres.2005.09.018. [DOI] [PubMed] [Google Scholar]
- Comings DE, Flanagan SD, Dietz G, Muhleman D, Knell E, Gysin R. The dopamine D2 receptor (DRD2) as a major gene in obesity and height. Biochem Med Metab Biol. 1993;50:176–185. doi: 10.1006/bmmb.1993.1059. [DOI] [PubMed] [Google Scholar]
- Cumming G, Finch S. Inference by eye: confidence intervals and how to read pictures of data. Am Psychol. 2005;60:170–180. doi: 10.1037/0003-066X.60.2.170. [DOI] [PubMed] [Google Scholar]
- de Araujo IE, Lin T, Veldhuizen MG, Small DM. Metabolic regulation of brain response to food cues. Curr Biol. 2013;23:878–883. doi: 10.1016/j.cub.2013.04.001. [DOI] [PMC free article] [PubMed] [Google Scholar]
- Eickhoff SB, Stephan KE, Mohlberg H, Grefkes C, Fink GR, Amunts K, Zilles K. A new SPM toolbox for combining probabilistic cytoarchitectonic maps and functional imaging data. Neuroimage. 2005;25:1325–1335. doi: 10.1016/j.neuroimage.2004.12.034. [DOI] [PubMed] [Google Scholar]
- Epstein LH, Wright SM, Paluch RA, Leddy JJ, Hawk LW, Jr, Jaroni JL, Saad FG, Crystal-Mansour S, Shields PG, Lerman C. Relation between food reinforcement and dopamine genotypes and its effect on food intake in smokers. Am J Clin Nutr. 2004;80:82–88. doi: 10.1093/ajcn/80.1.82. [DOI] [PubMed] [Google Scholar]
- Epstein LH, Temple JL, Neaderhiser BJ, Salis RJ, Erbe RW, Leddy JJ. Food reinforcement, the dopamine D2 receptor genotype, and energy intake in obese and nonobese humans. Behav Neurosci. 2007;121:877–886. doi: 10.1037/0735-7044.121.5.877. [DOI] [PMC free article] [PubMed] [Google Scholar]
- Esposito-Smythers C, Spirito A, Rizzo C, McGeary JE, Knopik VS. Associations of the DRD2 TaqIA polymorphism with impulsivity and substance use: preliminary results from a clinical sample of adolescents. Pharmacol Biochem Behav. 2009;93:306–312. doi: 10.1016/j.pbb.2009.03.012. [DOI] [PMC free article] [PubMed] [Google Scholar]
- Felsted JA, Ren X, Chouinard-Decorte F, Small DM. Genetically determined differences in brain response to a primary food reward. J Neurosci. 2010;30:2428–2432. doi: 10.1523/JNEUROSCI.5483-09.2010. [DOI] [PMC free article] [PubMed] [Google Scholar]
- Fletcher PC, Napolitano A, Skeggs A, Miller SR, Delafont B, Cambridge VC, de Wit S, Nathan PJ, Brooke A, O'Rahilly S, Farooqi IS, Bullmore ET. Distinct modulatory effects of satiety and sibutramine on brain responses to food images in humans: a double dissociation across hypothalamus, amygdala, and ventral striatum. J Neurosci. 2010;30:14346–14355. doi: 10.1523/JNEUROSCI.3323-10.2010. [DOI] [PMC free article] [PubMed] [Google Scholar]
- Fossella J, Green AE, Fan J. Evaluation of a structural polymorphism in the ankyrin repeat and kinase domain containing 1 (ANKK1) gene and the activation of executive attention networks. Cogn Affect Behav Neurosci. 2006;6:71–78. doi: 10.3758/CABN.6.1.71. [DOI] [PubMed] [Google Scholar]
- Friston KJ, Harrison L, Penny W. Dynamic causal modelling. Neuroimage. 2003;19:1273–1302. doi: 10.1016/S1053-8119(03)00202-7. [DOI] [PubMed] [Google Scholar]
- Geha PY, Aschenbrenner K, Felsted J, O'Malley SS, Small DM. Altered hypothalamic response to food in smokers. Am J Clin Nutr. 2013;97:15–22. doi: 10.3945/ajcn.112.043307. [DOI] [PMC free article] [PubMed] [Google Scholar]
- Green BG, Shaffer GS, Gilmore MM. Derivation and evaluation of a semantic scale of oral sensation magnitude with apparent ratio properties. Chemical Senses. 1993;18:683–702. doi: 10.1093/chemse/18.6.683. [DOI] [Google Scholar]
- Green BG, Dalton P, Cowart B, Shaffer G, Rankin K, Higgins J. Evaluating the “Labeled Magnitude Scale” for measuring sensations of taste and smell. Chem Senses. 1996;21:323–334. doi: 10.1093/chemse/21.3.323. [DOI] [PubMed] [Google Scholar]
- Hatfield T, Han JS, Conley M, Gallagher M, Holland P. Neurotoxic lesions of basolateral, but not central, amygdala interfere with Pavlovian second-order conditioning and reinforcer devaluation effects. J Neurosci. 1996;16:5256–5265. doi: 10.1523/JNEUROSCI.16-16-05256.1996. [DOI] [PMC free article] [PubMed] [Google Scholar]
- Holland PC, Petrovich GD, Gallagher M. The effects of amygdala lesions on conditioned stimulus-potentiated eating in rats. Physiol Behav. 2002;76:117–129. doi: 10.1016/S0031-9384(02)00688-1. [DOI] [PubMed] [Google Scholar]
- Holsen LM, Zarcone JR, Brooks WM, Butler MG, Thompson TI, Ahluwalia JS, Nollen NL, Savage CR. Neural mechanisms underlying hyperphagia in Prader-Willi syndrome. Obesity. 2006;14:1028–1037. doi: 10.1038/oby.2006.118. [DOI] [PMC free article] [PubMed] [Google Scholar]
- Jenkinson CP, Hanson R, Cray K, Wiedrich C, Knowler WC, Bogardus C, Baier L. Association of dopamine D2 receptor polymorphisms Ser311Cys and TaqIA with obesity or type 2 diabetes mellitus in Pima Indians. Int J Obes Relat Metab Disord. 2000;24:1233–1238. doi: 10.1038/sj.ijo.0801381. [DOI] [PubMed] [Google Scholar]
- Jocham G, Klein TA, Neumann J, von Cramon DY, Reuter M, Ullsperger M. Dopamine DRD2 polymorphism alters reversal learning and associated neural activity. J Neurosci. 2009;29:3695–3704. doi: 10.1523/JNEUROSCI.5195-08.2009. [DOI] [PMC free article] [PubMed] [Google Scholar]
- Johnson BN, Sobel N. Methods for building an olfactometer with known concentration outcomes. J Neurosci Methods. 2007;160:231–245. doi: 10.1016/j.jneumeth.2006.09.008. [DOI] [PubMed] [Google Scholar]
- Johnsrude IS, Owen AM, White NM, Zhao WV, Bohbot V. Impaired preference conditioning after anterior temporal lobe resection in humans. J Neurosci. 2000;20:2649–2656. doi: 10.1523/JNEUROSCI.20-07-02649.2000. [DOI] [PMC free article] [PubMed] [Google Scholar]
- Jönsson EG, Nöthen MM, Grünhage F, Farde L, Nakashima Y, Propping P, Sedvall GC. Polymorphisms in the dopamine D2 receptor gene and their relationships to striatal dopamine receptor density of healthy volunteers. Mol Psychiatry. 1999;4:290–296. doi: 10.1038/sj.mp.4000532. [DOI] [PubMed] [Google Scholar]
- Klein TA, Neumann J, Reuter M, Hennig J, von Cramon DY, Ullsperger M. Genetically determined differences in learning from errors. Science. 2007;318:1642–1645. doi: 10.1126/science.1145044. [DOI] [PubMed] [Google Scholar]
- Kroemer NB, Krebs L, Kobiella A, Grimm O, Pilhatsch M, Bidlingmaier M, Zimmermann US, Smolka MN. Fasting levels of ghrelin covary with the brain response to food pictures. Addict Biol. 2013;18:855–862. doi: 10.1111/j.1369-1600.2012.00489.x. [DOI] [PubMed] [Google Scholar]
- Lancaster JL, Rainey LH, Summerlin JL, Freitas CS, Fox PT, Evans AC, Toga AW, Mazziotta JC. Automated labeling of the human brain: a preliminary report on the development and evaluation of a forward-transform method. Hum Brain Mapp. 1997;5:238–242. doi: 10.1002/(SICI)1097-0193(1997)5:4<238::AID-HBM6>3.0.CO;2-4. [DOI] [PMC free article] [PubMed] [Google Scholar]
- Lancaster JL, Woldorff MG, Parsons LM, Liotti M, Freitas CS, Rainey L, Kochunov PV, Nickerson D, Mikiten SA, Fox PT. Automated Talairach Atlas labels for functional brain mapping. Hum Brain Mapp. 2000;10:120–131. doi: 10.1002/1097-0193(200007)10:3<120::AID-HBM30>3.0.CO;2-8. [DOI] [PMC free article] [PubMed] [Google Scholar]
- Lénárd L, Hahn Z. Amygdalar noradrenergic and dopaminergic mechanisms in the regulation of hunger and thirst-motivated behavior. Brain Res. 1982;233:115–132. doi: 10.1016/0006-8993(82)90934-9. [DOI] [PubMed] [Google Scholar]
- Lim J, Wood A, Green BG. Derivation and evaluation of a labeled hedonic scale. Chem Senses. 2009;34:739–751. doi: 10.1093/chemse/bjp054. [DOI] [PMC free article] [PubMed] [Google Scholar]
- Maldjian JA, Laurienti PJ, Kraft RA, Burdette JH. An automated method for neuroanatomic and cytoarchitectonic atlas-based interrogation of fMRI data sets. Neuroimage. 2003;19:1233–1239. doi: 10.1016/S1053-8119(03)00169-1. [DOI] [PubMed] [Google Scholar]
- Maldjian JA, Laurienti PJ, Burdette JH. Precentral gyrus discrepancy in electronic versions of the Talairach atlas. Neuroimage. 2004;21:450–455. doi: 10.1016/j.neuroimage.2003.09.032. [DOI] [PubMed] [Google Scholar]
- Malik S, McGlone F, Bedrossian D, Dagher A. Ghrelin modulates brain activity in areas that control appetitive behavior. Cell Metab. 2008;7:400–409. doi: 10.1016/j.cmet.2008.03.007. [DOI] [PubMed] [Google Scholar]
- McDonald AJ, Culberson JL. Efferent projections of the basolateral amygdala in the opossum, Didelphis virginiana. Brain Res Bull. 1986;17:335–350. doi: 10.1016/0361-9230(86)90238-8. [DOI] [PubMed] [Google Scholar]
- Mehta S, Melhorn SJ, Smeraglio A, Tyagi V, Grabowski T, Schwartz MW, Schur EA. Regional brain response to visual food cues is a marker of satiety that predicts food choice. Am J Clin Nutr. 2012;96:989–999. doi: 10.3945/ajcn.112.042341. [DOI] [PMC free article] [PubMed] [Google Scholar]
- Murdaugh DL, Cox JE, Cook EW, 3rd, Weller RE. fMRI reactivity to high-calorie food pictures predicts short- and long-term outcome in a weight-loss program. Neuroimage. 2012;59:2709–2721. doi: 10.1016/j.neuroimage.2011.10.071. [DOI] [PMC free article] [PubMed] [Google Scholar]
- Noble EP. D2 dopamine receptor gene in psychiatric and neurologic disorders and its phenotypes. Am J Med Genet Part B. 2003;116B:103–125. doi: 10.1002/ajmg.b.10005. [DOI] [PubMed] [Google Scholar]
- Noble EP, Noble RE, Ritchie T, Syndulko K, Bohlman MC, Noble LA, Zhang Y, Sparkes RS, Grandy DK. D2 dopamine receptor gene and obesity. Int J Eat Disord. 1994;15:205–217. doi: 10.1002/1098-108X(199404)15:3<205::AID-EAT2260150303>3.0.CO;2-P. [DOI] [PubMed] [Google Scholar]
- Nummenmaa L, Hirvonen J, Hannukainen JC, Immonen H, Lindroos MM, Salminen P, Nuutila P. Dorsal striatum and its limbic connectivity mediate abnormal anticipatory reward processing in obesity. PLoS One. 2012;7:e31089. doi: 10.1371/journal.pone.0031089. [DOI] [PMC free article] [PubMed] [Google Scholar]
- O'Doherty JP, Deichmann R, Critchley HD, Dolan RJ. Neural responses during anticipation of a primary taste reward. Neuron. 2002;33:815–826. doi: 10.1016/S0896-6273(02)00603-7. [DOI] [PubMed] [Google Scholar]
- Ottersen OP, Ben-Ari Y. Afferent connections to the amygdaloid complex of the rat and cat. I. Projections from the thalamus. J Comp Neurol. 1979;187:401–424. doi: 10.1002/cne.901870209. [DOI] [PubMed] [Google Scholar]
- Passamonti L, Rowe JB, Schwarzbauer C, Ewbank MP, von dem Hagen E, Calder AJ. Personality predicts the brain's response to viewing appetizing foods: the neural basis of a risk factor for overeating. J Neurosci. 2009;29:43–51. doi: 10.1523/JNEUROSCI.4966-08.2009. [DOI] [PMC free article] [PubMed] [Google Scholar]
- Petrovich GD, Setlow B, Holland PC, Gallagher M. Amygdalo-hypothalamic circuit allows learned cues to override satiety and promote eating. J Neurosci. 2002;22:8748–8753. doi: 10.1523/JNEUROSCI.22-19-08748.2002. [DOI] [PMC free article] [PubMed] [Google Scholar]
- Petrovich GD, Holland PC, Gallagher M. Amygdalar and prefrontal pathways to the lateral hypothalamus are activated by a learned cue that stimulates eating. J Neurosci. 2005;25:8295–8302. doi: 10.1523/JNEUROSCI.2480-05.2005. [DOI] [PMC free article] [PubMed] [Google Scholar]
- Petrovich GD, Ross CA, Mody P, Holland PC, Gallagher M. Central, but not basolateral, amygdala is critical for control of feeding by aversive learned cues. J Neurosci. 2009;29:15205–15212. doi: 10.1523/JNEUROSCI.3656-09.2009. [DOI] [PMC free article] [PubMed] [Google Scholar]
- Pohjalainen T, Rinne JO, Någren K, Lehikoinen P, Anttila K, Syvälahti EK, Hietala J. The A1 allele of the human D2 dopamine receptor gene predicts low D2 receptor availability in healthy volunteers. Mol Psychiatry. 1998;3:256–260. doi: 10.1038/sj.mp.4000350. [DOI] [PubMed] [Google Scholar]
- Rabiner EA, Beaver J, Makwana A, Searle G, Long C, Nathan PJ, Newbould RD, Howard J, Miller SR, Bush MA, Hill S, Reiley R, Passchier J, Gunn RN, Matthews PM, Bullmore ET. Pharmacological differentiation of opioid receptor antagonists by molecular and functional imaging of target occupancy and food reward-related brain activation in humans. Mol Psychiatry. 2011;16:826–835. 785. doi: 10.1038/mp.2011.29. [DOI] [PMC free article] [PubMed] [Google Scholar]
- Ritchie T, Noble EP. Association of seven polymorphisms of the D2 dopamine receptor gene with brain receptor-binding characteristics. Neurochem Res. 2003;28:73–82. doi: 10.1023/A:1021648128758. [DOI] [PubMed] [Google Scholar]
- Root CM, Denny CA, Hen R, Axel R. The participation of cortical amygdala in innate, odour-driven behaviour. Nature. 2014;515:269–273. doi: 10.1038/nature13897. [DOI] [PMC free article] [PubMed] [Google Scholar]
- Rothemund Y, Preuschhof C, Bohner G, Bauknecht HC, Klingebiel R, Flor H, Klapp BF. Differential activation of the dorsal striatum by high-calorie visual food stimuli in obese individuals. Neuroimage. 2007;37:410–421. doi: 10.1016/j.neuroimage.2007.05.008. [DOI] [PubMed] [Google Scholar]
- Schachter S. Obesity and eating. Science. 1968;161:751–756. doi: 10.1126/science.161.3843.751. [DOI] [PubMed] [Google Scholar]
- Scibilia RJ, Lachowicz JE, Kilts CD. Topographic nonoverlapping distribution of D1 and D2 dopamine receptors in the amygdaloid nuclear complex of the rat brain. Synapse. 1992;11:146–154. doi: 10.1002/syn.890110208. [DOI] [PubMed] [Google Scholar]
- Small DM, Veldhuizen MG, Felsted J, Mak YE, McGlone F. Separable substrates for anticipatory and consummatory food chemosensation. Neuron. 2008;57:786–797. doi: 10.1016/j.neuron.2008.01.021. [DOI] [PMC free article] [PubMed] [Google Scholar]
- Sosulski DL, Bloom ML, Cutforth T, Axel R, Datta SR. Distinct representations of olfactory information in different cortical centres. Nature. 2011;472:213–216. doi: 10.1038/nature09868. [DOI] [PMC free article] [PubMed] [Google Scholar]
- Stephan KE, Penny WD, Daunizeau J, Moran RJ, Friston KJ. Bayesian model selection for group studies. Neuroimage. 2009;46:1004–1017. doi: 10.1016/j.neuroimage.2009.03.025. [DOI] [PMC free article] [PubMed] [Google Scholar]
- Stice E, Spoor S, Bohon C, Small DM. Relation between obesity and blunted striatal response to food is moderated by TaqIA A1 allele. Science. 2008a;322:449–452. doi: 10.1126/science.1161550. [DOI] [PMC free article] [PubMed] [Google Scholar]
- Stice E, Spoor S, Bohon C, Veldhuizen MG, Small DM. Relation of reward from food intake and anticipated food intake to obesity: a functional magnetic resonance imaging study. J Abnorm Psychol. 2008b;117:924–935. doi: 10.1037/a0013600. [DOI] [PMC free article] [PubMed] [Google Scholar]
- Stice E, Yokum S, Blum K, Bohon C. Weight gain is associated with reduced striatal response to palatable food. J Neurosci. 2010a;30:13105–13109. doi: 10.1523/JNEUROSCI.2105-10.2010. [DOI] [PMC free article] [PubMed] [Google Scholar]
- Stice E, Yokum S, Bohon C, Marti N, Smolen A. Reward circuitry responsivity to food predicts future increases in body mass: moderating effects of DRD2 and DRD4. Neuroimage. 2010b;50:1618–1625. doi: 10.1016/j.neuroimage.2010.01.081. [DOI] [PMC free article] [PubMed] [Google Scholar]
- Stoeckel LE, Weller RE, Cook EW, 3rd, Twieg DB, Knowlton RC, Cox JE. Widespread reward-system activation in obese women in response to pictures of high-calorie foods. Neuroimage. 2008;41:636–647. doi: 10.1016/j.neuroimage.2008.02.031. [DOI] [PubMed] [Google Scholar]
- Stoeckel LE, Kim J, Weller RE, Cox JE, Cook EW, 3rd, Horwitz B. Effective connectivity of a reward network in obese women. Brain Res Bull. 2009;79:388–395. doi: 10.1016/j.brainresbull.2009.05.016. [DOI] [PMC free article] [PubMed] [Google Scholar]
- Sun X, Veldhuizen MG, Wray AE, de Araujo IE, Sherwin RS, Sinha R, Small DM. The neural signature of satiation is associated with ghrelin response and triglyceride metabolism. Physiol Behav. 2014;136:63–73. doi: 10.1016/j.physbeh.2014.04.017. [DOI] [PMC free article] [PubMed] [Google Scholar]
- Tellez LA, Ren X, Han W, Medina S, Ferreira JG, Yeckel CW, de Araujo IE. Glucose utilization rates regulate intake levels of artificial sweeteners. J Physiol. 2013;591:5727–5744. doi: 10.1113/jphysiol.2013.263103. [DOI] [PMC free article] [PubMed] [Google Scholar]
- Thompson J, Thomas N, Singleton A, Piggott M, Lloyd S, Perry EK, Morris CM, Perry RH, Ferrier IN, Court JA. D2 dopamine receptor gene (DRD2) Taq1 A polymorphism: reduced dopamine D2 receptor binding in the human striatum associated with the A1 allele. Pharmacogenetics. 1997;7:479–484. doi: 10.1097/00008571-199712000-00006. [DOI] [PubMed] [Google Scholar]
- Tzourio-Mazoyer N, Landeau B, Papathanassiou D, Crivello F, Etard O, Delcroix N, Mazoyer B, Joliot M. Automated anatomical labeling of activations in SPM using a macroscopic anatomical parcellation of the MNI MRI single-subject brain. Neuroimage. 2002;15:273–289. doi: 10.1006/nimg.2001.0978. [DOI] [PubMed] [Google Scholar]
- Veldhuizen MG, Bender G, Constable RT, Small DM. Trying to detect taste in a tasteless solution: Modulation of early gustatory cortex by attention to taste. Chem Senses. 2007;32:569–581. doi: 10.1093/chemse/bjm025. [DOI] [PubMed] [Google Scholar]
- Walker AK, Ibia IE, Zigman JM. Disruption of cue-potentiated feeding in mice with blocked ghrelin signaling. Physiol Behav. 2012;108:34–43. doi: 10.1016/j.physbeh.2012.10.003. [DOI] [PMC free article] [PubMed] [Google Scholar]
- Weingarten HP. Conditioned cues elicit feeding in sated rats: A role for learning in meal initiation. Science. 1983;220:431–433. doi: 10.1126/science.6836286. [DOI] [PubMed] [Google Scholar]
- Yokum S, Ng J, Stice E. Attentional bias to food images associated with elevated weight and future weight gain: an fMRI study. Obesity. 2011;19:1775–1783. doi: 10.1038/oby.2011.168. [DOI] [PMC free article] [PubMed] [Google Scholar]