Abstract
Quantification of 31P NMR spectra is commonly performed using line-fitting techniques with prior knowledge. Currently available time- and frequency- domain analysis software includes AMARES (in jMRUI) and CFIT respectively. Another popular frequency domain approach is LCModel, which has been successfully used to fit both 1H and 13C in vivo NMR spectra. To the best of our knowledge LCModel has not been used to fit 31P spectra. This study demonstrates the feasibility of using LCModel to quantify in vivo 31P MR spectra, provided that adequate prior knowledge and LCModel CONTROL parameters are used. Both single-voxel and MRSI data are presented and similar results are obtained with LCModel and with AMARES. This provides a new method for automated, operator-independent analysis of 31P NMR spectra.
Keywords: 31P, animal, AMARES, brain, human, jMRUI, LCModel, MRSI
Graphical abstract
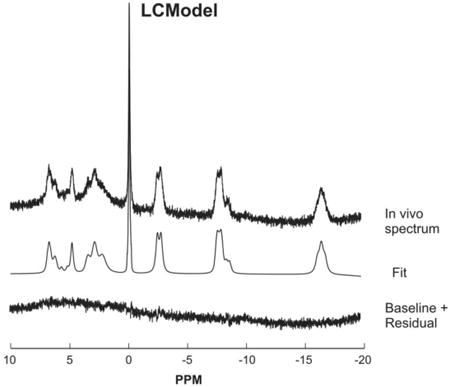
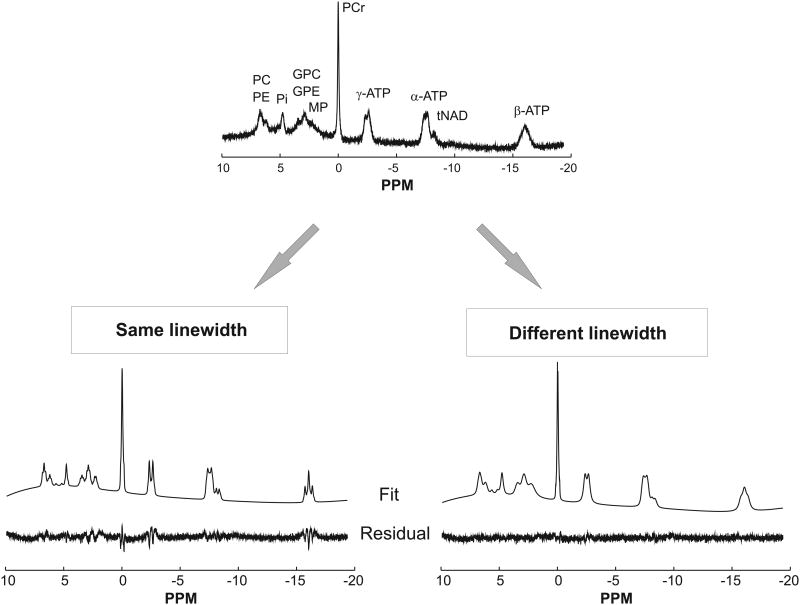
LCModel can successfully fit in vivo 31P spectra (both single-voxel and MRSI data) when the appropriate basis set and the differences in the apparent linewidths for each metabolite are taken into account. Example of an LCModel fitted 31P spectrum (acquired from the human brain at 3 Tesla) is shown here.
Introduction
In vivo NMR spectroscopy (MRS) allows noninvasive measurements of the concentration of brain metabolites in humans and animals. In particular, phosphorus MRS (31P MRS) is commonly used to detect key energy metabolites such as adenosine triphosphate (ATP), phosphocreatine (PCr) and inorganic phosphate (Pi). It also allows determination of intracellular pH (based on the difference between the chemical shifts of PCr and Pi (1)) and measurement of metabolic reaction fluxes using magnetization transfer technique (2).
To extract all of the relevant information provided by 31P MRS, the NMR spectra need to be accurately quantified. For 31P spectral analysis, several techniques have been reported which can be performed in either the time or frequency domain.
A popular time-domain line-fitting method is AMARES (Advanced Method for Accurate, Robust and Efficient Spectral fitting) (3), in which prior knowledge (e.g. chemical shift, linewidth, amplitude and phase information) for each resonance is included in order to obtain a reliable fit (4). AMARES is part of the jMRUI package, which is free for academic use. Another available method uses a Marquardt-Levenberg algorithm after obtaining prior knowledge with a Hankel singular value decomposition (HSVD) algorithm (5,6). In both of these techniques, the prior knowledge was derived from high signal-to-noise 31P NMR spectra generally obtained by summing data from several subjects. This prior knowledge was then used to quantify lower signal-to-noise spectra.
A variant of HSVD (known as IRIS-HSVD (7)) was recently shown to be useful when analyzing 31P spectra with distorted baseline. This algorithm iteratively fits all resonances along with the baseline until the residual is minimized. In this case, the prior knowledge was also estimated using HSVD. IRIS-HSVD was reported to have significantly smaller mean and standard deviation for resolving the peaks of interest around the true chemical shift values compared to AMARES (7).
Analysis of 31P data in the frequency domain has been reported using CFIT (8). This technique fits the circular trajectories of the peaks (when projected onto the complex plane) with active circle models where prior knowledge is incorporated as constraint energy terms. A comparison between CFIT and AMARES on in vivo 31P spectra reported a higher fitting failure rate and lower fitting accuracy with AMARES than with CFIT due to presence of baseline artifacts (8). TDFDFIT is another frequency domain technique which uses time-domain models (9) derived from high signal-to-noise 31P NMR spectra (10).
Another frequency domain approach is LCModel (11), a commercial software in which the in vivo spectrum is approximated as a linear combination of model spectra of different metabolites present in the measured spectrum. These spectra can be acquired in vitro using the same pulse sequence as used for the in vivo measurement, or they can be simulated based on known chemical shifts and J-coupling values. Over the last decade, LCModel has been widely used to fit in vivo 1H NMR spectra in both human and rodent brains (12,13). It was further extended to quantify in vivo 13C spectra (14,15), but to the best of our knowledge this technique has not been used to fit 31P NMR spectra. Therefore, the aim of this study was to evaluate the suitability of LCModel to quantify in vivo 31P NMR spectra. The method is demonstrated by fitting 31P MR spectra from human brain at 3 Tesla, and validated by comparing quantification results with those obtained with AMARES. Quantification of magnetic resonance spectroscopic imaging (MRSI) data from human brain at 7 Tesla and localized single-voxel data from mouse brain at 9.4 Tesla are also shown.
Methods
In vivo 31P MR Spectroscopy at 3 Tesla
Healthy volunteers (N = 10) were studied on a 3 Tesla whole-body Siemens Trio (Siemens Medical Solutions, Erlangen, Germany). Informed consent was obtained from all participants prior to the study. The standard Siemens body 1H RF coil was used for 1H imaging and B0 shimming, and a small transceiver 31P surface coil (6 cm diameter, Rapid biomedical GmbH, Germany) was used for 31P MRS. The subjects lay in a supine position with their head placed above the 31P RF coil. A small sphere filled with water was placed at the center of the 31P RF coil to verify the precise positioning of the 31P coil on 1H images.
T1-weighted 1H images were first acquired from the brain followed by adjustment of the position of the 31P coil such that the water sphere was aligned with the center of the visual cortex. Localized automatic B0 shimming was then performed on a 3×3×3 cm3 voxel placed in the primary visual cortex area resulting in water line width between 14 Hz and 18 Hz.
In vivo unlocalized 31P NMR spectra (without 1H decoupling) were acquired from the occipital cortex using a pulse-acquire sequence (square excitation RF pulse) and a repetition time (TR) of 2 s. For each subject, the excitation flip angle in the region-of-interest was adjusted to approximately 60° (close the Ernst angle for PCr and Pi with TR = 2 s). 31P signals were then acquired (600 scans) using a spectral width of 2 kHz and 2048 complex data points. To achieve steady-state magnetization, four dummy scans were acquired at the beginning.
Spectral Processing
All 31P spectra were processed using Matlab (The MathWorks Inc., Natick, MA, USA). Spectra from each subject were manually phased (zero- and first-order correction). Single-shot frequency correction was performed automatically using a cross-correlation algorithm. The summed spectrum was referenced by placing the PCr peak at 0 ppm.
LCModel Analysis
All spectra were analyzed using LCModel version 6.3-0G (Stephen Provencher Inc., Oakville, ON, Canada) (11). Basis spectra were simulated using home-written programs in Matlab using published (5,6,14,16,17) and measured 31P chemical shifts and 31P-31P J-coupling (JPP) and long-range 31P–1H J-coupling (JPH) constants (Table 1). For the basis set generation, LCModel requires that each basis spectrum has a singlet peak for referencing and by default LCModel uses the 0.0 ppm chemical shift. However, in 31P NMR, this chemical shift (i.e. 0.0 ppm) is generally assigned to the PCr singlet peak. Therefore, when generating LCModel basis spectra for 31P in this study, the reference peak was set at -25.0 ppm (i.e. PPMPK = - 25, the chemical shift (in ppm) of the reference peak used in LCModel when generating the basis set).
Table 1.
Chemical shift and J-coupling constants used to simulate the 31P basis model spectra.
| Metabolites | Chemical shift (ppm) | JPP coupling (Hz) | JPH coupling (Hz) | References |
|---|---|---|---|---|
|
| ||||
| PCr | 0 | |||
|
| ||||
| α-ATP | -7.56‡ | JPα−Pβ = 16.30 | JPα−H4 = 1.90 | (16,17,27) |
| β-ATP | -16.18 | JPα−Pγ = 15.40 | JPα−H5 = 6.50 | |
| γ-ATP | -2.53 | JPα−H′5 = 4.90 | ||
|
| ||||
| Pi | 4.84 | (16) | ||
|
| ||||
| PC | 6.23† | Jp−H1 = 6.30 | (17) | |
| Jp−H′1 = 6.25 | ||||
|
| ||||
| PE | 6.77 | Jp−H1 = Jp−H′1 = 6.89 | † | |
|
| ||||
| GPC | 2.94 | Jp−H3 = Jp−H′3 = 6.08 | † | |
| Jp−H7 = Jp−H′7 = 6.08 | ||||
|
| ||||
| GPE | 3.49 | Jp−H3 = Jp−H′3 = 6.23 | † | |
| Jp−H7 = Jp−H′7 = 6.23 | ||||
|
| ||||
| DPG | 5.71 | (5) | ||
| 5.23 | ||||
|
| ||||
| MP | 2.30 | |||
|
| ||||
| NADH | -8.13 | (27) | ||
| NAD+ | -8.31 | JP−P′ = 16.30 | ||
measured from 31P MRS acquired in human brain at 7 T.
measured from brain extract.
The model basis set consisted of 13 basis spectra: PCr, α-ATP, β-ATP, γ-ATP, Pi, nicotinamide adenine dinucleotide (reduced form, NADH and oxidized form, NAD+), phosphorylethanolamine (PE), phosphorylcholine (PC), glycerol-3-phosphorylethanolamine (GPE), glycerol-3-phosphorylcholine (GPC), membrane phospholipids (MP) and 2,3-diphosphoglycerate (DPG). Phase evolution due to JPP coupling was neglected as the data was acquired with a pulse-acquire sequence. With a POCE type sequence, dephasing due to JPP coupling could be incorporated as prior knowledge into the basis set as demonstrated earlier for 13C POCE spectra (14). Two different basis sets were generated: 1) a “fixed linewidth” basis set in which all metabolite basis spectra were simulated with a fixed linewidth of 2 Hz and 2) an “adjusted linewidth” basis set in which each metabolite spectrum was simulated with a linewidth equal to the average measured in vivo linewidth (Table 2) minus 3 Hz for all metabolites. The average in vivo linewidth was estimated by fitting multiple in vivo spectra using the “fixed linewidth” basis set. The linewidth of each metabolite in the in vivo spectrum was then available in the LCModel.PRINT output file.
Table 2.
Spectral linewidth and concentration of metabolites used in Monte-Carlo simulation.
| Metabolites | Concentration (μmol/g) | Linewidth (Hz) |
|---|---|---|
|
| ||
| PCr | 3 | 3 |
|
| ||
| α-ATP | 3 | 9 |
| β-ATP | 3 | 18 |
| α-ATP | 3 | 13 |
|
| ||
| Pi | 1 | 10 |
|
| ||
| PC | 1.5 | 11 |
|
| ||
| PE | 1 | 10 |
|
| ||
| GPC | 1.5 | 12 |
|
| ||
| GPE | 1 | 11 |
|
| ||
| DPG | 0.5 | 10 |
|
| ||
| MP | 2 | 33 |
|
| ||
| NADH | 0.5 | 4 |
| NAD+ | 0.1 | 12 |
Three methods were utilized during the fitting procedure: LCModel approach #1 uses the “fixed linewidth” basis set together with default LCModel broadening parameters DEEXT2 = 2 Hz and DESDT2 = 0.4 Hz. These parameters specify the expected mean and standard deviation of line broadening from the basis set spectra to the in vivo spectrum. LCModel approach #2 uses the same “fixed linewidth” basis set, but with DEEXT2 = 10 Hz and DESDT2 = 10 Hz, giving more flexibility to LCModel for line broadening. LCModel approach #3 uses the “adjusted linewidth” basis set with DEEXT2 = 2 Hz and DESDT2 = 0.4 Hz.
For the preliminary LCModel analysis, the following three resonances were chosen: PCr, Pi and α-ATP. As previously reported for 13C fitting using LCModel (14), the following input parameters were used: DKNTMN = 2*99; XSTEP = 5; RFWHM = 3; FWHMBA = 0.049; NREFPK(2) = 1; PPMREF(1,2) = 0; DESDSH = 0.01. The default values which define the spline baseline function were also adjusted in order to take account of the larger ppm range of 31P compared to 1H: ALPBMN = 7.8e-10, ALPBMX = 3.9e-7, ALPBPN = 9.8e-10, ALPBST = 1.2e-9 (11). In addition, the standard deviations on the zero- and first- order phases were set to SDDEGZ = 3 and SDDEGP = 0.4 respectively in order to allow small phase flexibility. No baseline correction, zero-filling or apodization functions were applied to the in vivo data prior to the analysis. LCModel fitting was performed over the spectral range from -19.5 to 10 ppm. At 3 Tesla, NAD+ and NADH cannot be fitted separately and only their sum (tNAD = NAD+ + NADH) is reported.
AMARES Analysis
31P spectra were also analyzed using the AMARES algorithm available in jMRUI (18) with prior knowledge. All peaks were fitted using a Lorentzian line shape. α-ATP, γ-ATP, DPG and NAD+ were each modeled as doublets with identical amplitude while β-ATP consisted of three singlets with an amplitude ratio of 1:2:1. The rest of the metabolites were considered as singlets. The frequencies of all metabolites were constrained to ±0.05 ppm based on their chemical shift reported in Table 1, except for the two resonances of the NAD+ doublet which had a fixed frequency shift of -19 Hz and 1.0 Hz respectively relative to NADH. Furthermore, the linewidth of all metabolites were constrained to be between 5 and 15 Hz except for MP which was between 25 and 40 Hz. The zero-order phase was constrained between -20° to 20° while the first-order phase was constrained between -0.5 ms to 0.5 ms in the time domain. To reduce the effect of the baseline, frequency-selective weighting (quarter-sine wave) was applied to the first 20 points in the time domain. In addition, the first 2 points were truncated during the fit.
Statistical Analysis
Differences in metabolite concentrations between LCModel and AMARES were analyzed using a two-tailed equal variance Student's t-test. Differences were considered statistically significant if P < 0.05, with Bonferroni correction for multiple comparisons. In addition, the Spearman's rank correlation coefficient was used to estimate the correlation of metabolite concentrations between the two methods.
31P MRSI
One healthy volunteer was scanned in a 7 Tesla/90 cm bore scanner (Siemens Medical Solutions, Erlangen, Germany) after providing informed consent. A home-built RF coil used consisted of a large 1H coil for anatomic imaging and B0 shimming and a small transceiver 31P surface loop (∼5cm diameter) was used for 31P MRS. The subject lay in a supine position with the head (visual cortex) placed above the 31P RF coil. After acquiring T1 images and performing localized B0 shimming as described above, 3D Fourier series window 31P MRSI spectra were acquired using the following parameters: FOV = 12×12×9 cm3, matrix size = 7×7×5, TR = 1.2 s, 300 μs hard pulse (average flip angle ∼70° in the visual cortex), total scan = 2240 and nominal voxel size of 5.3 cm3.
MRSI data were processed in Matlab; automatic zero- and first- order phase corrections were performed in each voxel only if the peak SNR of PCr was > 5 in that voxel. Then 31P spectra from each voxel were analyzed with LCModel as described above.
31P Mouse MRS
Localized 31P spectra were acquired using a 3D ISIS localization sequence at 9.4 T in 4 wild-type mouse brain (volume-of-interest (VOI) of 5×3×5 mm3 positioned in the dorsal region) as reported previously (19). After frequency and phase corrections, the summed spectrum from the 4 animals was analyzed using LCModel.
Measurement of JPH Coupling Constants
31P - 1H J-coupling values in PE, GPE and GPC were measured in vitro. Brain extract from one rat was prepared as previously described in Henry (14). Briefly, after suspending in 10% D2O and pH adjusted (range 7.10–7.20), 31P NMR spectra were recorded from the extract at 37°C on a 14.1 Tesla INOVA spectrometer (Agilent Technologies, CA) using a pulse-acquire sequence (repetition time of 3 s and 24,960 averages). Based on the measured T1 of PCr of about 3.5 s, a 65° flip angle was used for optimal SNR. Line broadening of 0.5 Hz and Gaussian broadening of 5 Hz were applied before Fourier transformation and line fittings were performed using the Varian built-in software. JPH couplings values in PE, GPE and GPC were measured after deconvolution.
Monte-Carlo Simulations
The accuracy of AMARES and LCModel quantification was evaluated using Monte-Carlo simulations. 31P brain-like unlocalized spectra were simulated at 3 Tesla using the spectral linewidth measured for each metabolite in the in vivo spectrum and concentration reported in Table 2. The distorted baseline arising from short T2 signals (bone) was generated by summing the in vivo 31P spectra from all subjects and line-broadening with a large exponential filter of 1000 Hz and Gaussian filter of 0.01 Hz.
For Monte-Carlo simulations, Gaussian noise was added to the simulated 31P NMR spectra. The resulting spectra were fitted with AMARES and LCModel using the two basis sets as described above. Five different noise levels were chosen such that the peak signal-to-noise ratio (SNR) of PCr, in the frequency domain, ranged from 13 to 120. This procedure was repeated 100 times for each noise level.
Results and Discussion
31P spectral pattern at 3 T
In vivo 31P NMR spectra from the human occipital cortex (Figure 1) measured with the 6 cm surface coil had excellent SNR and spectral resolution and showed resonances from PCr, ATP, Pi, phosphomonoesters (PME = PE + PC), phosphodiesters (PDE = GPC + GPE). The fine multiplet structure in α-ATP and γ-ATP was not well resolved due to their shorter T2 and to the presence of long-range 31P - 1H J-couplings (ranging between ∼2 and 8 Hz). These long-range couplings can be suppressed by using 1H decoupling during acquisition (5,20) at the expense of experimental simplicity.
Figure 1.
LCModel fits of a 31P spectrum (TR = 2 s, 600 averages, peak SNR of PCr = 81, no apodization) obtained by constraining the linewidth to be similar for all metabolites using LCModel approach #1 (left) or allowing the linewidth to vary using LCModel approach #2 (right). The root mean square of fit residuals was almost 65% higher in the first case.
Spectral fitting
Initial attempts to fit 31P spectra with LCModel approach #1 using the fixed linewidth basis set and default LCModel line broadening parameters resulted in large residuals for almost all resonances (Figure 1, bottom left). These residuals were caused by incorrect estimation of the spectral linewidth. By default, LCModel assumes that the line broadening applied to the basis set spectra in order to match the in vivo spectra is similar for all resonances in the spectrum. However, in the case of 31P spectra, metabolites have very different linewidths due to different T2 relaxation times. For example, the T2 of PCr is known to be much longer than the T2 for the different moieties of ATP in the human brain (16,21,22) resulting in a narrower linewidth for PCr than for ATP.
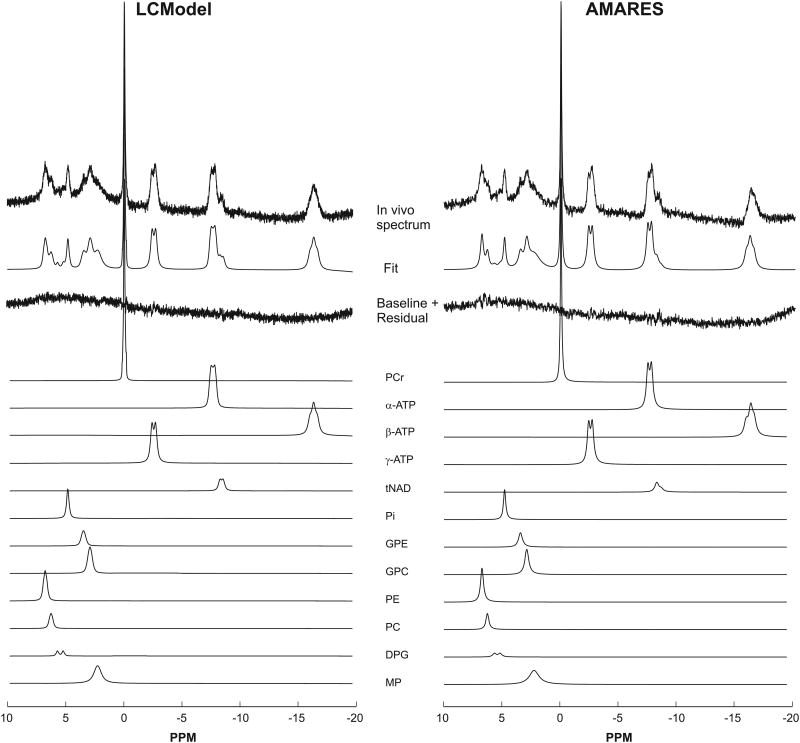
Giving LCModel more flexibility to estimate the line broadening for each metabolite (LCModel approach #2), resulted in a much-improved fit with minimal residuals (Figure 1, bottom right). Previous studies using HSVD (5,6) have also shown that having flexible linewidth for each peak in the fitting algorithm helped to efficiently quantify the 31P brain data. Based on the quality of the fit and residual, the basis set generated using values given in Table 1 appear suitable for analyzing 31P MRS data. In addition, the fit shows that LCModel can successfully account for the distorted baseline arising from short T2 signals (especially bone). Fitting the same spectrum with AMARES resulted in similar fit quality as with LCModel (Figure 2).
Figure 2.
Comparison of 31P spectra fitted using LCModel (left) and AMARES (right). No baseline correction was applied before fitting. The fits were very similar.
Another possible approach with LCModel (LCModel approach #3) is to incorporate information about the different linewidth for each metabolite directly into the basis set, and give less flexibility to LCModel in estimating the increase in linewidth from the basis set to the in vivo data. Indeed, the quality of the fit with the “adjusted linewidth” basis set and DESDT2 = 0.4 Hz (default value) was similar to that obtained with the “fixed linewidth” basis set and DESDT2 = 10 Hz (LCModel approach #2).
Monte-Carlo simulations
Although LCModel approaches #2 and #3 gave similar fit quality, the two different LCModel approaches resulted in very different quantification accuracy.
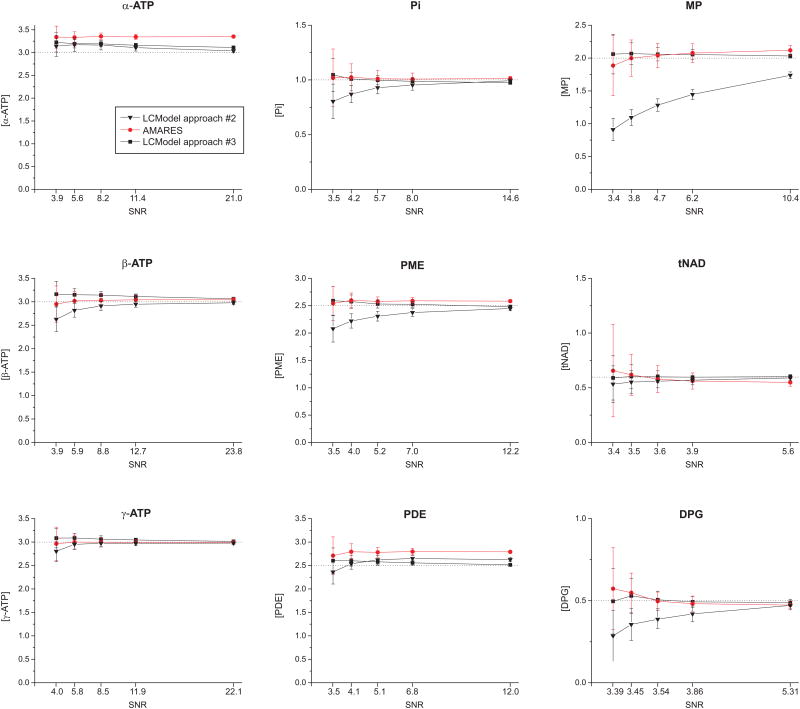
Giving LCModel too much flexibility to estimate the linewidth of each metabolite (LCModel approach #2) resulted in significant quantification bias, especially at low SNR (Figure 3) and for broad resonances such as MP and DPG. In contrast, incorporating prior knowledge of the linewidth into the basis set and setting tighter constraints (LCModel approach #3) resulted in much improved accuracy, with actual concentration values close to expected values (Figure 3).
Figure 3.
Accuracy of quantification of 31P metabolite concentrations (in μmol/g) at various SNR levels determined using Monte-Carlo simulations. For each metabolite, five data points are shown, corresponding to the five SNR conditions used in Monte-Carlo-simulations. The corresponding peak SNR of PCr for the five data points were: 13 (a), 24 (b), 40 (c), 61 (d) and 120 (e). All concentrations are relative to [PCr] of 3 μmol/g. Dotted lines represent the expected concentrations (values used to simulate 31P spectra). LCModel approach #2 uses the “fixed linewidth” basis set with DEEXT2 = 10 Hz and DESDT2 = 10 Hz, and LCModel approach #3 uses the “adjusted linewidth” basis set with default values of DEEXT2 = 2 Hz and DESDT2 = 0.4 Hz.
The performance of LCModel approach #3 was similar to that of AMARES, suggesting that both algorithms are able to estimate concentrations with good accuracy, even under relatively low SNR conditions, provided that adequate prior knowledge and constraints are used. The quantification precision obtained with Monte-Carlo simulations was somewhat better with LCModel compared to AMARES (lower error bars in Figure 3). This difference in precision can be attributed to the fact that the constraints on metabolite linewidth that we used in AMARES were less tight than with LCModel. This should not be interpreted as AMARES being “less precise” than LCModel. Rather, it is a reflection that tighter constraints lead to improved precision.
In vivo metabolite concentrations
Relative metabolite concentrations obtained after LCModel and AMARES analysis are given in Figure 4 assuming a PCr concentration of 2.7 μmol/g in the healthy human brain (6,10). PCr was used as an internal concentration reference since this peak does not overlap with other resonances (other resonances could be used, such as αATP or βATP).
Figure 4.
Comparison of mean relative 31P concentrations (in μmol/g) obtained with LCModel and AMARES (left) using PCr as a concentration reference of 2.7 μmol/g. * represents P < 0.05 after Bonferroni correction and error bars represent SD. Excellent correlation was observed between the two methods for almost all metabolite concentrations (right).
Comparable relative concentrations (within SD, Figure 4A) were also observed with both methods (LCModel and AMARES) for almost all metabolites. There was an excellent correlation between the two quantification methods (rs = 0.99, P < 0.001) as shown in Figure 4B. The absolute difference in concentrations estimated by the two methods was less than 0.2 μmol/g for all metabolites, with the exception of PDE, which was 0.26 μmol/g lower on average with AMARES than with LCModel. The highest relative difference was observed for tNAD (26.5% lower with AMARES than with LCModel, 0.56 μmol/g vs. 0.75 μmol/g), consistent with tNAD being very difficult to quantify reliably at 3 Tesla. GPE was 13% lower on average with AMARES than with LCModel. All other metabolites showed less than 12% difference between the two methods. The three above-mentioned metabolites (PDE, tNAD, GPE), were the only metabolites that showed significant differences between the two methods on our population of 10 subjects. The small differences that we observed could be due in part to small differences in baseline estimation between the two methods.
The measured Pi concentration of 1.0 μmol/g in this study is consistent with previous studies in humans (6,23). The concentration of ATP was similar to that of PCr, consistent with previously published values in human cortex (6).
Based on LCModel's output, it was also possible to measure the pH, as determined by the difference in chemical shifts between PCr and Pi (23) in this study. The measured intracellular pH in healthy brain was 7.03 ± 0.01 consistent with previously reported values (23,24). To test the reliability to measure the chemical shifts of the Pi peak at various pH, one of the in vivo spectra was manipulated such that Pi was shifted by ± 0.3 ppm (in step of 0.1 ppm) from its original chemical shift of 4.84 ppm and the resulting spectra were fitted with LCModel as described above and setting ALSDSH (i.e. standard deviation of the chemical shift) to 1.0 ppm for Pi (default value is 0.004 ppm). These shifts correspond to tissue pH values of 6.78 to 7.31, associated with pathological conditions (25,26). Results demonstrate that these shifts in Pi can be accurately picked up by LCModel (within ±0.02 ppm) thereby offering the possibility to measure changes in tissue pH. An excellent correlation was observed between the expected pH value and the pH value determined using the chemical-shift of Pi returned by LCModel (slope of 1.02, goodness-of-fit R2 = 0.99, not shown).
In addition to fitting single voxel spectroscopy data, LCModel was also successfully employed to quantify 31P MRSI data at 7 Tesla (Figure 5). Good fits were obtained even for voxels with lower SNR. The estimated concentrations from the voxel with the highest SNR (peak SNR of PCr = 56, defined as peak height divided by root mean square noise) were consistent to that measured at 3 T where Cramer-Rao Lower Bound (CRLB) < 10% for all major metabolites like PCr, Pi, ATP, PME and PDE. In the voxel with the lowest SNR (peak SNR of PCr = 16), it was possible to accurately measure PCr and ATP concentrations with CRLB < 12%. The certainty to estimate Pi was still reasonable (CRLB < 25%) while other metabolites could not be reliably determined.
Figure 5.
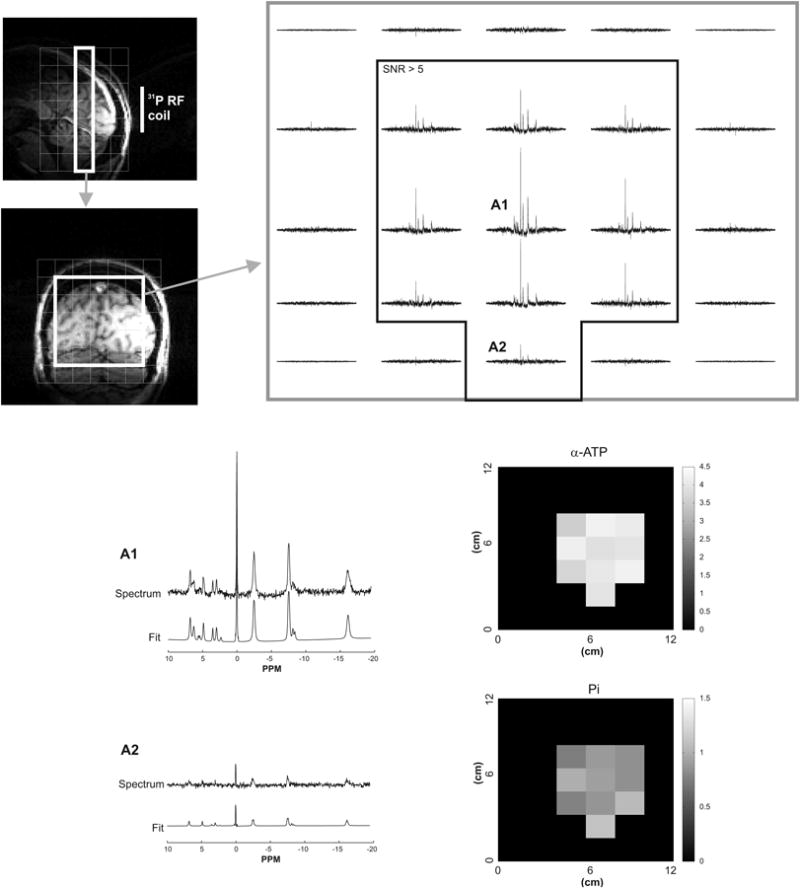
Example of LCModel analysis of 31P MRSI data acquired in one human subject at 7 T. The 5×5 spectral grid shows spectra from the central part of a coronal slice (white box on T1-weighted sagittal and coronal images). LCModel fits are shown for two different voxel locations (denoted as A1 and A2). Voxels where the SNR of PCr was greater than 5 (shown by the black box on the 5×5 spectral grid) were used to generate the concentration maps (in μmol/g) for α-ATP and Pi as determined by LCModel.
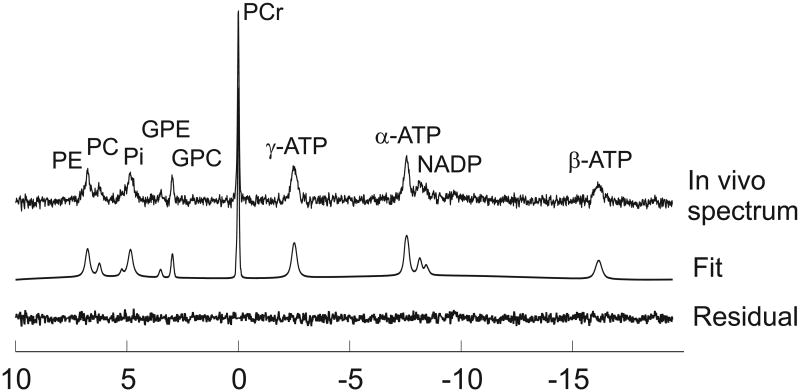
Finally, to show that the described method is easily translatable to animal data, localized 31P spectra acquired from mouse brain at 9.4 Tesla (19) were fitted using LCModel. The results indeed show that a good spectral fit can be obtained (Figure 6) and the measured concentrations (relative to PCr concentration of 4 μmol/g) were consistent with previously reported values (19); i.e. 2.3 μmol/g for Pi, 2.8 μmol/g for α-ATP, 1.9 μmol/g for β-ATP and 2.9 μmol/g for γ-ATP.
Figure 6.
LCModel fit of localized in vivo 31P spectra from mice brain at 9.4 T; summed data from 4 animals, ISIS localization technique, VOI = 75 μl, TR = 5.3 sec; 2496 averages, line broadening of 2 Hz and Gaussian filtering of 1.25 Hz.
Conclusion
This study showed that LCModel can be used for robust fitting of in vivo 31P NMR spectra (both single voxel and MRSI). This requires using adequate prior knowledge for the simulated model basis spectra as well as giving LCModel enough flexibility to account for differences in apparent metabolite linewidths (due to different T2 relaxation times and long-range 31P - 1H couplings). The performance of LCModel to quantify 31P MR spectra is very similar to that of AMARES. In conclusion, this study provides a new method for automated, operator-independent analysis of 31P NMR spectra in the frequency domain.
Acknowledgments
This work was supported by funding from NIH grants P41EB015894, P30NS076408, R01NS38672 and R01NS070839. We would like to thank Dr. Stephen Provencher for his help on the input parameters in LCModel version 6.3 and Dr. Ivan Tkáč for providing the 31P mouse spectra.
References
- 1.Moon RB, Richards JH. Determination of intracellular pH by 31P magnetic resonance. J Biol Chem. 1973;248(20):7276–7278. [PubMed] [Google Scholar]
- 2.Du F, Zhu XH, Qiao H, Zhang X, Chen W. Efficient in vivo 31P magnetization transfer approach for noninvasively determining multiple kinetic parameters and metabolic fluxes of ATP metabolism in the human brain. Magn Reson Med. 2007;57(1):103–114. doi: 10.1002/mrm.21107. [DOI] [PubMed] [Google Scholar]
- 3.Vanhamme L, van den Boogaart A, Van Huffel S. Improved method for accurate and efficient quantification of MRS data with use of prior knowledge. J Magn Reson. 1997;129(1):35–43. doi: 10.1006/jmre.1997.1244. [DOI] [PubMed] [Google Scholar]
- 4.Hamilton G, Patel N, Forton DM, Hajnal JV, Taylor-Robinson SD. Prior knowledge for time domain quantification of in vivo brain or liver 31P MR spectra. NMR Biomed. 2003;16(3):168–176. doi: 10.1002/nbm.821. [DOI] [PubMed] [Google Scholar]
- 5.Potwarka JJ, Drost DJ, Williamson PC. Quantifying 1H decoupled in vivo 31P brain spectra. NMR Biomed. 1999;12(1):8–14. [PubMed] [Google Scholar]
- 6.Jensen JE, Drost DJ, Menon RS, Williamson PC. In vivo brain (31)P-MRS: measuring the phospholipid resonances at 4 Tesla from small voxels. NMR in Biomedicine. 2002;15(5):338–347. doi: 10.1002/nbm.776. [DOI] [PubMed] [Google Scholar]
- 7.Wang X, Lee JH. IRIS-HSVD algorithm for automatic quantitation of in vivo 31P MRS. J Magn Reson. 2009;196(1):23–32. doi: 10.1016/j.jmr.2008.09.024. [DOI] [PubMed] [Google Scholar]
- 8.Gabr RE, Ouwerkerk R, Bottomley PA. Quantifying in vivo MR spectra with circles. J Magn Reson. 2006;179(1):152–163. doi: 10.1016/j.jmr.2005.11.004. [DOI] [PMC free article] [PubMed] [Google Scholar]
- 9.Slotboom J, Boesch C, Kreis R. Versatile frequency domain fitting using time domain models and prior knowledge. Magn Reson Med. 1998;39(6):899–911. doi: 10.1002/mrm.1910390607. [DOI] [PubMed] [Google Scholar]
- 10.Kreis R, Slotboom J, Pietz J, Jung B, Boesch C. Quantitation of Localized 31P Magnetic Resonance Spectra Based on the Reciprocity Principle. J Magn Reson. 2001;149(2):245–250. doi: 10.1006/jmre.2001.2301. [DOI] [PubMed] [Google Scholar]
- 11.Provencher SW. Estimation of metabolite concentrations from localized in vivo proton NMR spectra. Magn Reson Med. 1993;30(6):672–679. doi: 10.1002/mrm.1910300604. [DOI] [PubMed] [Google Scholar]
- 12.Frahm J, Hanefeld F. Localized proton magnetic resonance spectroscopy of cerebral metabolites. Neuropediatrics. 1996;27(2):64–69. doi: 10.1055/s-2007-973751. [DOI] [PubMed] [Google Scholar]
- 13.Pfeuffer J, Tkac I, Provencher SW, Gruetter R. Toward an in vivo neurochemical profile: quantification of 18 metabolites in short-echo-time 1H NMR spectra of the rat brain. J Magn Reson. 1999;141(1):104–120. doi: 10.1006/jmre.1999.1895. [DOI] [PubMed] [Google Scholar]
- 14.Henry PG, Oz G, Provencher S, Gruetter R. Toward dynamic isotopomer analysis in the rat brain in vivo: automatic quantitation of 13C NMR spectra using LCModel. NMR Biomed. 2003;16(6-7):400–412. doi: 10.1002/nbm.840. [DOI] [PubMed] [Google Scholar]
- 15.Lanz B, Duarte JoMN, Kunz N, Mlynárik V, Gruetter R, Cudalbu C. Which prior knowledge? Quantification of in vivo brain 13C MR spectra following 13C glucose infusion using AMARES. Magn Reson Med. 2013;69(6):1512–1522. doi: 10.1002/mrm.24406. [DOI] [PubMed] [Google Scholar]
- 16.Jung WI, Staubert A, Widmaier S, Hoess T, Bunse M, van Erckelens F, Dietze G, Lutz O. Phosphorus J-coupling constants of ATP in human brain. Magn Reson Med. 1997;37(5):802–804. doi: 10.1002/mrm.1910370525. [DOI] [PubMed] [Google Scholar]
- 17.Govindaraju V, Young K, Maudsley AA. Proton NMR chemical shifts and coupling constants for brain metabolites. NMR Biomed. 2000;13(3):129–153. doi: 10.1002/1099-1492(200005)13:3<129::aid-nbm619>3.0.co;2-v. [DOI] [PubMed] [Google Scholar]
- 18.Naressi A, Couturier C, Devos JM, Janssen M, Mangeat C, Beer Rd, Graveron-Demilly D. Java-based graphical user interface for the MRUI quantitation package. Magma. 2001;12(2-3):141–152. doi: 10.1007/BF02668096. LA - English. [DOI] [PubMed] [Google Scholar]
- 19.Tkac I, Henry PG, Zacharoff L, Wedel M, Gong W, Deelchand DK, Li T, Dubinsky JM. Homeostatic adaptations in brain energy metabolism in mouse models of Huntington disease. JCBFM. 2012;32(11):1977–1988. doi: 10.1038/jcbfm.2012.104. [DOI] [PMC free article] [PubMed] [Google Scholar]
- 20.Luyten PR, Bruntink G, Sloff FM, Vermeulen JW, van der Heijden JI, den Hollander JA, Heerschap A. Broadband proton decoupling in human 31P NMR spectroscopy. NMR Biomed. 1989;1(4):177–183. doi: 10.1002/nbm.1940010405. [DOI] [PubMed] [Google Scholar]
- 21.Merboldt KD, Chien D, Hanicke W, Gyngell ML, Bruhn H, Frahm J. Localized 31P NMR spectroscopy of the adult human brain in vivo using stimulated-echo (STEAM) sequences. J Magn Reson. 1969;89(2):343–361. [Google Scholar]
- 22.Lei H, Zhu XH, Zhang XL, Ugurbil K, Chen W. In vivo 31P magnetic resonance spectroscopy of human brain at 7 T: An initial experience. Magn Reson Med. 2003;49(2):199–205. doi: 10.1002/mrm.10379. [DOI] [PubMed] [Google Scholar]
- 23.Mason GF, Chu WJ, Vaughan JT, Ponder SL, Twieg DB, Adams D, Hetherington HP. Evaluation of 31P metabolite differences in human cerebral gray and white matter. Magn Reson Med. 1998;39(3):346–353. doi: 10.1002/mrm.1910390303. [DOI] [PubMed] [Google Scholar]
- 24.Barker PB, Butterworth EJ, Boska MD, Nelson J, Welch KMA. Magnesium and pH imaging of the human brain at 3.0 Tesla. Magn Reson Med. 1999;41(2):400–406. doi: 10.1002/(sici)1522-2594(199902)41:2<400::aid-mrm26>3.0.co;2-e. [DOI] [PubMed] [Google Scholar]
- 25.Adler S, Simplaceanu V, Ho C. Brain pH in acute isocapnic metabolic acidosis and hypoxia: a 31P-nuclear magnetic resonance study. Am J Physiol. 1990;258(1):F34–F40. doi: 10.1152/ajprenal.1990.258.1.F34. [DOI] [PubMed] [Google Scholar]
- 26.Rottenberg DA, Ginos JZ, Kearfott KG, Junck L, Dhawan V, Jarden JO. In vivo measurement of brain tumor pH using [11C]DMO and positron emission tomography. Ann Neurol. 1985;17(1):70–79. doi: 10.1002/ana.410170116. [DOI] [PubMed] [Google Scholar]
- 27.Lu M, Zhu XH, Zhang Y, Chen W. Intracellular redox state revealed by in vivo 31P MRS measurement of NAD+ and NADH contents in brains. Magn Reson Med. 2013 doi: 10.1002/mrm.24859.. [DOI] [PMC free article] [PubMed] [Google Scholar]


