Abstract
Peritoneal dialysis was first employed in patients with acute renal failure in the 1940s and since the 1960s for those with end-stage renal disease. Its popularity increased enormously after the introduction of continuous ambulatory peritoneal dialysis in the end of 1970s. This stimulated both clinical and basic research. In an ideal situation, this should lead to cross-fertilization between the two. The present review describes two examples of interactions: one where it worked out very well and another where basic science missed the link with clinical findings. Those on fluid transport are examples of how old physiological findings on absorption of saline and glucose solutions were adopted in peritoneal dialysis by the use of glucose as an osmotic agent. The mechanism behind this in patients was first solved mathematically by the assumption of ultrasmall intracellular pores allowing water transport only. At the same time, basic science discovered the water channel aquaporin-1 (AQP-1), and a few years later, studies in transgenic mice confirmed that AQP-1 was the ultrasmall pore. In clinical medicine, this led to its assessment in patients and the notion of its impairment. Drugs for treatment have been developed. Research on biocompatibility is not a success story. Basic science has focussed on dialysis solutions with a low pH and lactate, and effects of glucose degradation products, although the first is irrelevant in patients and effects of continuous exposure to high glucose concentrations were largely neglected. Industry believed the bench more than the bedside, resulting in ‘biocompatible’ dialysis solutions. These solutions have some beneficial effects, but are evidently not the final answer.
Keywords: aquaporin-1, biocompatibility, clinical/in vitro studies, free water transport, peritoneal fluid transport
Introduction
Peritoneal dialysis as treatment for patients with acute renal failure was first employed in the 1940s [1]. At that time, clinicians had very limited knowledge on the pathophysiology of this treatment and it was even suggested that a process of active urea excretion was involved in its effectiveness.
The use of peritoneal dialysis for patients with end-stage renal disease stems from the 1960s, but it was not very popular, mainly due to its relative insufficiency, peritoneal protein losses and the risk for peritonitis. This changed markedly after the introduction of continuous ambulatory peritoneal dialysis in the end of 1970s. The enormous increase in the number of patients and lack of knowledge created much interest in peritoneal dialysis (PD) research, both clinical and basic.
Cross-fertilization between basic and clinical science in medicine creates an ideal environment for the development of new treatments and necessary improvements. Regrettably, this situation hardly exists for dialysis treatment, including peritoneal dialysis. It is typically a situation where patients were already treated before any scientific investigation on its feasibility had been done. Evidently, this situation has changed. However, a recent PubMed search using ‘peritoneal dialysis' and ‘experimental studies’ as entries yielded 200 hits, of which 26 had nothing to do with PD and 15 were not traceable and had no available abstract. Of the remaining 159 papers, 61 were experimental studies in animals, 42 reviews, 37 studies in patients, 11 in vitro studies and 8 on kinetic modelling. Replacing experimental studies by ‘cell culture’ added another 144 studies. The average number of non-clinical studies on peritoneal dialysis is 10 per year. Only a very limited number of these have been translated into clinical practice.
Just three studies mention ‘from bench to bedside’ in their title [2–4]. All of these are on the biocompatibility of new dialysis solutions.
Two items are present in peritoneal dialysis, where there has been an important cross-talk between experimental and clinical studies on the mechanisms of fluid transport and on biocompatible dialysis solutions. A review is given on both of these.
Mechanisms of fluid transport and an assessment in patients
The administration of isotonic fluid in the peritoneal cavity of rabbits leads to their absorption. Already in 1921, it was shown that this effect was time dependent and especially present when NaCl 0.9% was used, compared with glucose 5% [5]. The difference was likely due to differences in the diffusion rates of these solutes.
Vasoconstriction by intraperitoneal epinephrine decreased the absorption rates. Boen [6, 7] was the first person to describe these crystalloid osmotic effects in patients with acute renal failure who were treated with peritoneal dialysis. It appeared that the addition of 2.5–4% glucose to an isotonic dialysis solution induced the removal of water from the body. In contrast, water equilibrium was present in most patients when 1.5–2% was added to the solution with electrolytes only. Water removal by crystalloid osmosis could even be increased to the development of hypernatraemia during the exclusive use of 8% glucose, applied for the treatment of patients with pulmonary oedema [8].
The clinical effects of glucose as a crystalloid osmotic agent was supported by some experimental studies, in dogs [9] and rats [10], in which Staverman's reflection coefficients were calculated as 1− sieving coefficient under the assumption of the presence of a uniform pore system for small-solute transport.
Values for glucose of 0.92 [9] and 0.32 [10] have been reported, comparing the transport of NaCl with that of glucose. In contrast, when different osmotic agents were used and compared with their effect on fluid transport, the osmotic reflection coefficient for glucose was only 0.02–0.05 in cats [11] and rats [12].
Comparison of the osmotic effects of a 1.36% glucose with a 3.86% glucose dialysis solution in patients showed similar results as in the animals [13, 14]. The obvious discrepancy between the very low reflection coefficients for glucose, found in experimental and clinical studies, led to the assumption that the vascular wall of peritoneal capillaries did not consist of small interendothelial pores and an occasional large pore only, but that there had to be an additional system of ultrasmall intracellular pores that would allow the transport of water, but not of solutes with radii exceeding 5 Ǻ [15, 16], such as glucose which has a radius of ∼3 Ǻ. The peritoneal reflection's coefficient of glucose would therefore be 1.0 for transport through these assumed ultrasmall pores. This mathematical concept of a three-pore system has gained wide acceptance in clinical practice [17]. One of the attractions of the model is that it could explain the ‘so-called' sieving of sodium, which means that crystalloid osmosis removes water at a faster rate than Na+, leading to a decrease in the dialysate Na+ concentration during a hypertonic exchange [18] and in its extreme form to hypernatraemia [8].
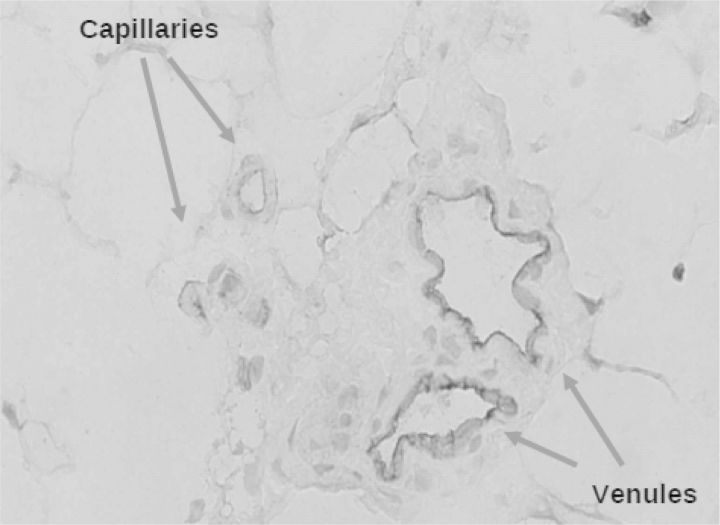
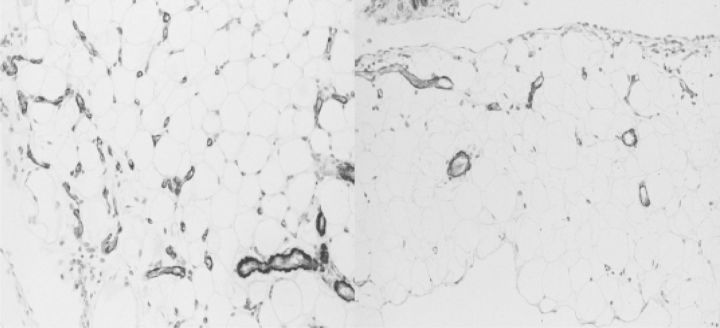
Unaware of peritoneal dialysis, the later Nobel prize winner Peter Agre found by serendipity a new 28 000 Da integral membrane protein in red blood cells and renal tubules [19]. Expression in Xenopus oocytes showed that it was a water channel [20]. The protein was renamed to aquaporin-1 (AQP-1) and appeared to be various epithelia and non-fenestrated endothelia [21]. We [22] and others [23] subsequently showed its presence in endothelial cells of peritoneal capillaries and venules, as shown in Figure 1. The final proof that AQP-1 was indeed the postulated ultrasmall pore came from experiments with AQP-1 knock-out mice. These animals had no Na+ sieving, but otherwise normal peritoneal solute transport [24].
Fig. 1.
Aquaporin-1 is present in human peritoneal endothelial cells of capillaries and venules. Stained with a human antiserum, kindly provided by P. Agre.
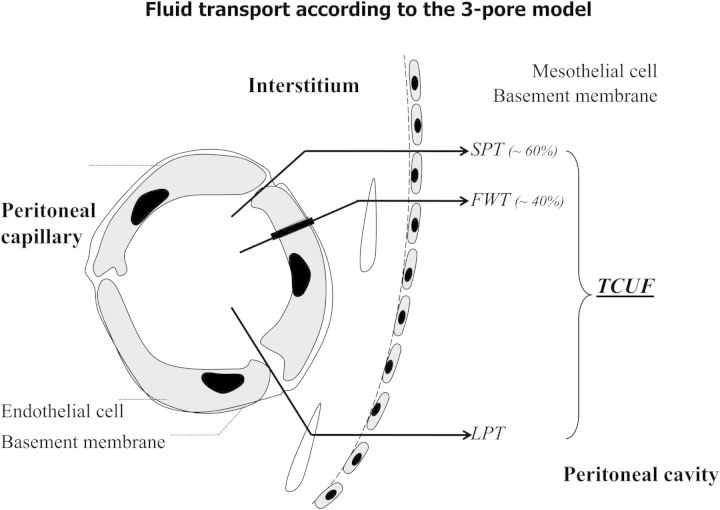
The discovery of AQP-1 markedly changed our understanding of peritoneal fluid transport, as illustrated in Figure 2. Clinicians, not only interested in physiology but also in pathophysiology, always think that the presence of a structure with a function implies that pathology is likely to occur. Clinical assessment of AQP-1 can be done by determination of free water transport (FWT), which is the transport of water, without dissolved solutes and electrolytes. The crystalloid pressure gradient is the most important driving force. Therefore, these measurements have to be done with a 3.86% glucose solution or another osmotic agent that creates a similar osmotic gradient, for instance glycerol [25]. When sodium in dialysate and plasma is measured in the beginning of the dwell, for instance after 60 min, the D/P ratio of this electrolyte gives a rough estimation of FWT, because the diffusion of sodium is so low that it can be neglected. The first observations using this principle in PD patients with severe ultrafiltration failure were published in 1995 [26]. The International Society of Peritoneal Dialysis (ISPD) subsequently decided to establish a committee on ultrafiltration failure that published an update of the current insights in peritoneal physiology [27] and made some recommendations [28]. The most important were those on the definition of ultrafiltration failure and the regular assessment of peritoneal function. Ultrafiltration failure was defined as the presence of a drained volume of <400 mL after a 4-h dwell with a 3.86/4.25% glucose dialysis solution, the ‘3 × 4 rule’. The validity of using 400 mL, instead of 300 or 500 mL, was confirmed later [29]. For regular assessment, the committee advised to modify the peritoneal equilibration test (PET) [30] by the use of a 3.86/4.25% glucose solution and by taking a dialysate and blood sample after 60 min. When the intraperitoneal volume is also determined at the time the Na+ measurements are done, FWT can be calculated from sodium kinetics assuming that isotonic fluid transport, including that of Na+, occurs through the small interendothelial pores without hindrance. FWT is then determined, as the difference between the net ultrafiltered volume at that time minus the volume transported through the small pores. The intraperitoneal volume, for instance 60 min, can be determined by the addition of an intraperitoneal volume marker [31] or by drainage, as described in the ‘fastPET’ [32].
Fig. 2.
A schematic representation of the pathways of peritoneal fluid transport. From: Coester AM et al. NDT Plus 2009;2:104–110.
A simplification of the technique in combination with the PET, allowing the simultaneous assessment of both FWT and small-solute transport, was described in 2009 [33]. It consists of a modified PET (3.86% glucose) with temporary drainage after 60 min, followed by reinfusion. The drained volume is determined by weighing; a dialysate and a plasma sample are taken for Na+ measurement. After reinfusion, the dwell is completed to 4 h, after which normal drainage is applied for the measurement of net ultrafiltration and determination of solute transport. The usefulness of this ‘two-in-one’ protocol has recently been described [34].
The assessment of FWT in chronic PD patients revealed that its impairment is a cause of ultrafiltration failure in 43% of patients with late ultrafiltration failure [35].
This can be caused by a less-effective osmotic gradient, for instance to a reduced osmotic conductance to glucose [36, 37]. A reduced peritoneal ultrafiltration coefficient and/or a decreased reflection coefficient both contribute to the osmotic conductance. It is likely that fibrotic alterations in peritoneal tissues affect the ultrafiltration coefficient, while the reflection coefficient is largely dependent on AQP-1. The expression of AQP-1 is probably not reduced in ultrafiltration failure [38], but its function may be impaired, because it is especially present in venules. This is supported by the notion that venular subendothelial hyalinosis is a phenomenon that has exclusively been described in peritoneal tissues of long-term peritoneal dialysis patients, not in any other pathological condition [39].
Possibilities for the treatment of AQP-1 failure are emerging, but still experimental. Corticosteroids in high dosages induce AQP-1 expression in the rat peritoneum [40] and increased FWT in three PD patients, who were treated with corticosteroids after kidney transplantation [41]. It is unknown if corticosteroids have an effect in patients with ultrafiltration failure, associated with impaired FWT. Very recently, an AQP-1 agonist has been developed, but data on its potential use have to be awaited [42].
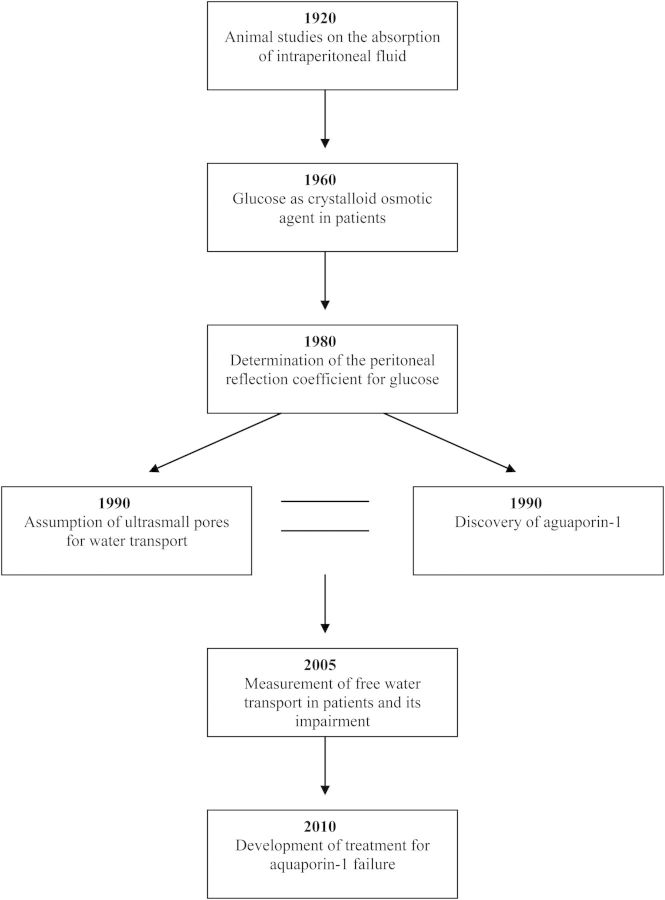
The history of mechanisms of fluid absorption and removal is a fascinating example of how developments can take place from bench to bedside by a route that starts with relatively simple experiments in animals, later followed by careful clinical observations in patients with acute renal failure. These developments are summarized schematically in Figure 3. The transfer from acute to chronic treatment and the notion that fluid removal can be problematic in some patients encourage mathematical calculations that lead to a hypothesis. The unrelated discovery of a new protein by serendipity that appears to be a water channel confirms the hypothesis in knock-out mice. Clinical assessment finally enables the problem of ultrafiltration failure to be identified in individual patients. Strategies for treatment are discussed below and those for prevention are discussed in the next section.
Fig. 3.
The development of our knowledge on fluid transport in peritoneal dialysis. The years are approximations.
Biocompatible dialysis solutions
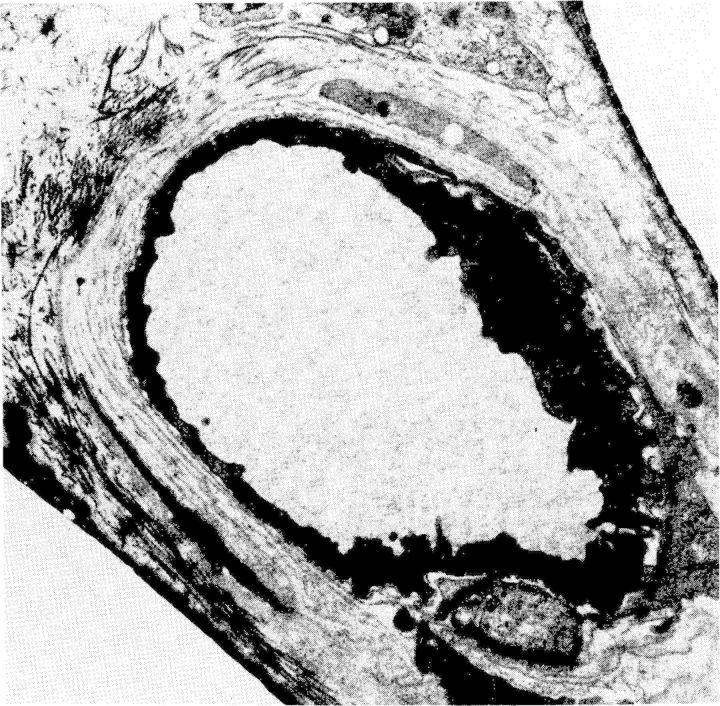
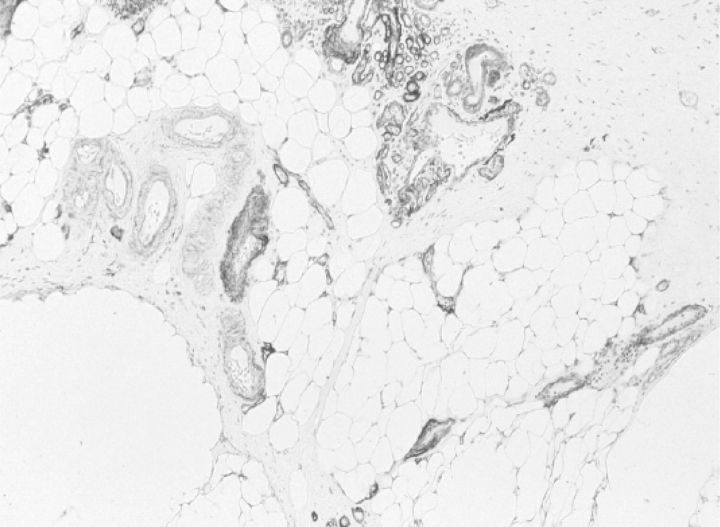
Long-term peritoneal dialysis may lead to alterations in peritoneal tissues that consist of neoangiogenesis (43, with diabetiform vascular changes, as shown in Figure 4 [44]), subendothelial hyalinosis [39], loss of mesothelial cells and fibrotic alterations, inducing thickening of the submesothelial zone of the parietal peritoneum, and also a more general increase in fibrosis [4,3]. These alterations are shown in Figure 5. The neoangiogenesis and the amount of fibrosis are related [4,3], which is uncommon, for instance, in tumours. Also, peritoneal deposition of advanced glycosylation end products is present: both submesothelial and perivascular [45, 46].
Fig. 4.
Electron microscopic picture of a peritoneal capillary of a stable peritoneal dialysis (PD) patient. Note the diabetiform lamellation of the endothelial basement membrane.
Fig. 5.
Omental tissue of a stable PD patient after 25 months of treatment. Stained for collagen IV. From: Mateijsen MAM et al. Perit Dial Int 1999: 19: 517–525.
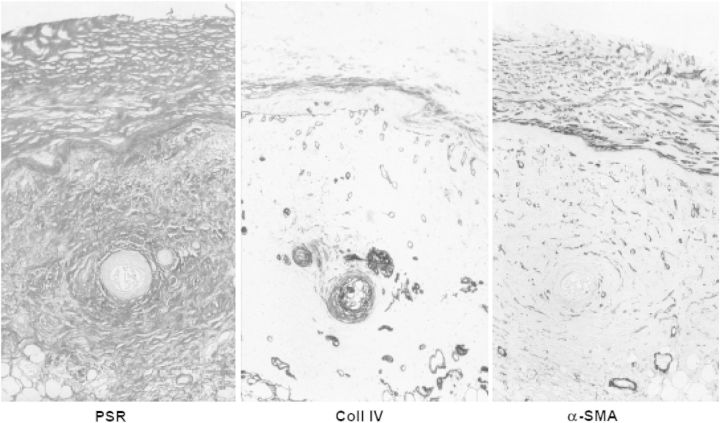
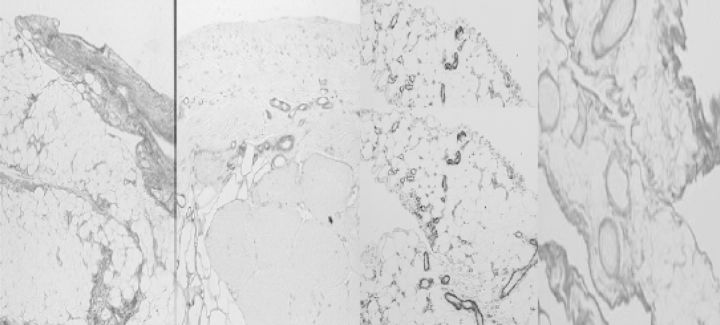
They show co-localization with vascular endothelial growth factor [46]. These abnormalities may proceed to, or be complicated by encapsulating peritoneal sclerosis [47]. Some histological features are shown in Figure 6. Encapsulating peritoneal sclerosis develops in 2–3% of an unselected population of incident PD patients [48]. Although death and renal transplantation are the main reasons for discontinuation of peritoneal dialysis [49], peritonitis and membrane problems, such as ultrafiltration failure and encapsulating peritoneal sclerosis, are also important reasons for discontinuation of peritoneal dialysis. The peritoneal alterations can be reproduced in a long-term (20 weeks) rat model of daily peritoneal exposure to the commercially available glucose-based conventional dialysis solutions, as shown in Figures 7 and 8. In principle, membrane failure can be caused by peritonitis and by the continuous exposure to dialysis solutions [50]. Only a few quantitative data are available on possible relationships between the severity of peritonitis and/or causative microorganisms and the induction of membrane failure [51]. The clinical observation that membrane failure can occur in some long-term patients who never had peritonitis, and the results of long-term exposure in our rat model, points to the importance of exposure to dialysis solutions. These are regarded as bioincompatible, because of the extremely high glucose concentrations, presence of glucose degradation products (GDPs), lactate and acidity.
Fig. 6.
The same section of parietal peritoneum of a patient with encapsulating peritoneal sclerosis, stained with picosirius red (stains fibrillary collagen), anticollagen IV (stains basement membranes) and α-smooth muscle actin (stains myofibroblasts). From: Mateijsen MAM et al. Perit Dial Int 1999;19: 517–525.
Fig. 7.
The morphology of the peritoneum of rats exposed to a conventional dialysis solution for 20 weeks. Left panel: parietal peritoneum, picosirius red. Mid-left: parietal peritoneum, antifactor VIII staining. Mid-right: omentum: α-smooth muscle actin. Right panel: omentum, picosirius red. Note the similarities with the studies in humans (Figs 5 and 6).
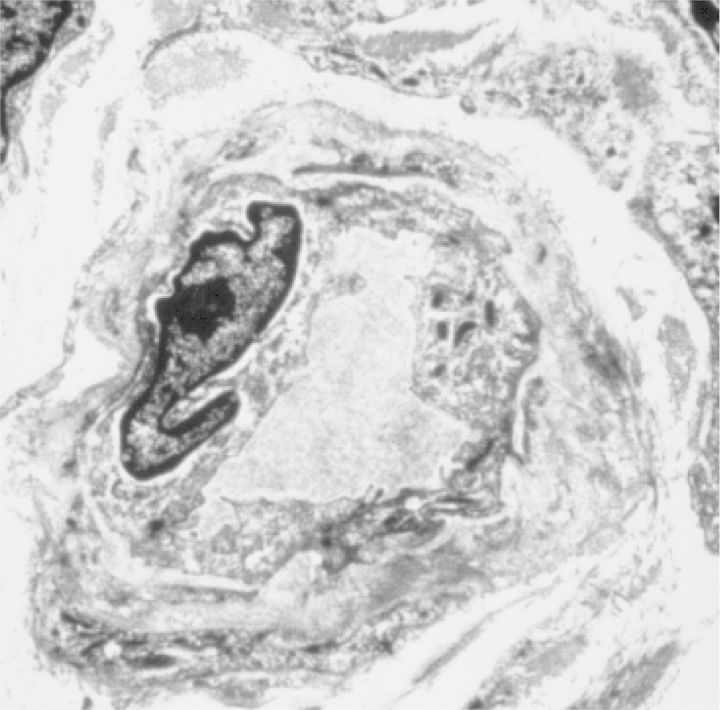
Fig. 8.
Electron microscopic picture of a peritoneal capillary of a rat after 20 weeks exposure to a conventional dialysis solution. The nucleus in the lumen is from a white blood cell. Note the diabetiform lamellation of the endothelial basement membrane and the similarities with the human material (Fig. 4). From: ref. [43].
This subject has induced a number of in vitro studies, especially in cell cultures. A large amount of various cell types have been used, such as peripheral polymorphonuclear cells, peripheral monocytes, peritoneal macrophages, cultured human mesothelial cells, mouse fibroblasts and human fibroblasts. All these studies have their limitations. First, the duration of exposure is mostly short, and secondly, the glucose concentrations are markedly lower than those used in peritoneal dialysis, because the cells would not survive otherwise. Finally, only the cells present in the peritoneum are probably relevant in peritoneal dialysis. All cultured cells appeared to be very sensitive to the combination of lactate and a low pH, because this caused a partially irreversible decrease in the intracellular pH [52, 53]. However, the importance in patients is questionable, because patients always have a residual dialysate volume in their peritoneal cavity after drainage [54]. When dwells of >1 h are used, this residual fluid will have a normal pH. Consequently, there is immediate dilution of the instilled acidic fluid to pH >6, whereby the toxicity is markedly reduced [55]. An important study is that of Wieslander et al., who showed that heat sterilization of dialysis fluids had a deleterious effect on the viability of mouse fibroblasts, due to the formation of GDPs, among which aldehydes and dicarbonyl compounds [56]. Toxicity to glucose and to GDPs is difficult to separate in vivo. All in vitro studies have been done with extremely high concentrations of GDPs, compared with their concentrations in peritoneal dialysis solutions. The above-discussed investigations are the only in vitro studies that went from bench to bedside, because the development of ‘biocompatible’ peritoneal dialysis solutions was based on their results.
Clinical investigations had shown in the meantime that the cumulative exposure to glucose was associated with the development of peritoneal membrane failure [57] and also that the duration of peritoneal dialysis was associated with an increase in effluent concentrations of the advanced GDP, pentosidine [58]. Serial peritoneal biopsies are impossible in PD patients, and peritoneal transport is often not an accurate echo of the morphological changes in the membrane. Therefore, this research has focussed on the measurement of substances in peritoneal effluent that are locally produced or released and reflect the status of one or more tissues. Cancer antigen 125, which is a measure of mesothelial cell mass in stable PD patients, was the first one used for this purpose [59]. A review on the current status of effluent biomarkers is given in ref. [60].
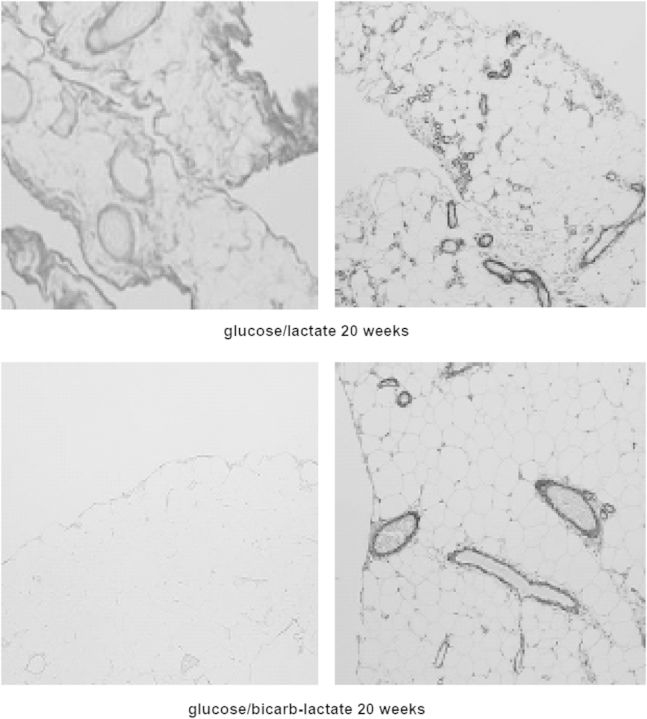
It follows from the morphological and clinical data that, reducing the exposure to glucose, perhaps in combination with avoiding exposure to very high lactate concentrations [61], is by far the most logical approach to preserving the peritoneal membrane. This can be done by using icodextrin for the long dwell and by replacing glucose in one short dwell by an amino acid-based solution. Experimental solutions, using pyruvate as a buffer, were very effective in reducing the peritoneal alterations in rats, as illustrated in Figure 9, and the use of combinations of osmotic agents, all in a low dose, together with either a bicarbonate/lactate buffer or pyruvate had all beneficial effects [62–64], as shown in Figure 10. However, despite their favourable effects on peritoneal morphology in the rat, they have never been produced for use in PD patients. In contrast, industry believed the bench more than the bedside and decided to produce dialysis solutions with a higher pH than in the conventional ones, bicarbonate, lactate or a combination of buffer substance and a reduced content of GDPs. These ‘biocompatible’ solutions caused less inflow pain than the conventional ones and generally had no effect on peritoneal transport. In all of them, a marked effect was present on effluent biomarkers: an increase of CA 125 and a decrease of hyaluronan—the ground substance of the peritoneum. The overall results have recently been reviewed [3].
Fig. 9.
Omental tissue of a rat stained with α-smooth muscle actin after 20 weeks exposure to a conventional lactate-buffered dialysis solution (left panel) and after 20 weeks exposure to a similar, but pyruvate-buffered dialysis solution (right panel). Note the differences in the number of blood vessels and the amount of fibrosis.
Fig. 10.
Omental tissue of a rat after 20 weeks exposure to a conventional lactate-buffered dialysis solution (upper panels) and also after 20 weeks exposure to a similar ‘biocompatible’ bicarbonate/lactate-buffered dialysis solution. The left panels are stained with picosirius red, the right panels with α-smooth muscle actin. Note the marked differences in fibrosis, but the number of vessels in the right-lower panel is reduced, but not normal.
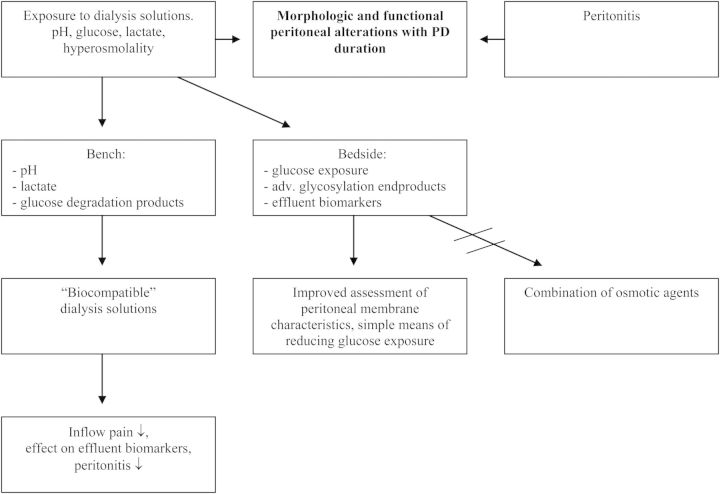
The above-discussed studies are not an example of cross-fertilization between bench and bedside, but show what can happen when results of in vitro studies are accepted without knowing the bedside. A summary of these diverging pathways is given in Figure 11. For optimal treatment, basic scientists should know more of clinical studies and patient care, whereas nephrologists should have knowledge on the achievements of the bench, but also on the weaknesses of studying artificial situations.
Fig. 11.
A scheme showing the separate pathways for bench and bedside developments with regard to dialysis solutions.
Conflict of interest statement. None declared.
References
- 1.Pyper RA. Peritoneal dialysis. Ulster Med J. 1948;17:179–187. [PMC free article] [PubMed] [Google Scholar]
- 2.Jörres A. Innovative approaches to the preservation of the peritoneal membrane: from bench to bedside. Adv Ren Replace Ther. 2001;8:164–172. doi: 10.1053/jarr.2001.26349. [DOI] [PubMed] [Google Scholar]
- 3.Jörres A. Glucose degradation products in peritoneal dialysis: from bench to bedside. Kidney Blood Press Res. 2003;26:113–117. doi: 10.1159/000070993. [DOI] [PubMed] [Google Scholar]
- 4.Perl J, Nessim SJ, Bargman JM. The biocompatibility of neutral pH, low-GDP peritoneal dialysis solutions: benefit at bench, bedside, or both? Kidney Int. 2011;79:814–824. doi: 10.1038/ki.2010.515. [DOI] [PubMed] [Google Scholar]
- 5.Clark AJ. Absorption from the peritoneal cavity. J Pharmacol Exper Therap. 1921;16:415–433. [Google Scholar]
- 6.Boen ST. Kinetics of peritoneal dialysis: a comparison with the artificial kidney. Medicine. 1961;40:243–288. [Google Scholar]
- 7.Boen ST. Peritoneal dialysis: a clinical study of factors governing its effectiveness. Kidney Int. 2008;73(Suppl 108):S5–S17. doi: 10.1038/sj.ki.5002633. [DOI] [PubMed] [Google Scholar]
- 8.Nolph KD, Hano JE, Teschan PE. Peritoneal sodium transport during hypertonic peritoneal dialysis. Physiologic mechanisms and clinical implications. Ann Int Med. 1969;70:931–941. doi: 10.7326/0003-4819-70-5-931. [DOI] [PubMed] [Google Scholar]
- 9.Knochel JP. Formation of peritoneal fluid hypertonicity during dialysis with isotonic glucose solutions. J Appl Physiol. 1969;27:233–236. doi: 10.1152/jappl.1969.27.2.233. [DOI] [PubMed] [Google Scholar]
- 10.Chen TW, Khanna R, Moore H, et al. Sieving and reflection coefficients for sodium salts and glucose during peritoneal dialysis in rats. J Am Soc Nephrol. 1991;6:1092–1100. doi: 10.1681/ASN.V261092. [DOI] [PubMed] [Google Scholar]
- 11.Rippe B, Perry MA, Granger DN. Permselectivity of the peritoneal membrane. Microvasc Res. 1985;29:129–135. doi: 10.1016/0026-2862(85)90009-3. [DOI] [PubMed] [Google Scholar]
- 12.Zakaria ER, Rippe B. Osmotic barrier properties of the rat peritoneal membrane. Acta Physiol Scand. 1993;149:355–364. doi: 10.1111/j.1748-1716.1993.tb09631.x. [DOI] [PubMed] [Google Scholar]
- 13.Stelin G, Rippe B. A phenomenological interpretation of the variation in dialysate volume with dwell time in CAPD. Kidney Int. 1990;38:465–472. doi: 10.1038/ki.1990.227. [DOI] [PubMed] [Google Scholar]
- 14.Krediet RT, Imholz ALT, Struijk DG, et al. Ultrafiltration failure in continuous ambulatory peritoneal dialysis. Perit Dial Int. 1993;13(Suppl 2):S59–S66. [PubMed] [Google Scholar]
- 15.Rippe B, Stelin G. Simulations of peritoneal solute transport during CAPD. Application of two-pore formalism. Kidney Int. 1989;35:1234–1244. doi: 10.1038/ki.1989.115. [DOI] [PubMed] [Google Scholar]
- 16.Rippe B, Stelin G, Haraldsson B. Computer simulations of peritoneal fluid transport in CAPD. Kidney Int. 1991;40:315–325. doi: 10.1038/ki.1991.216. [DOI] [PubMed] [Google Scholar]
- 17.Rippe B. A three pore model of peritoneal transport. Perit Dial Int. 1993;13(Suppl 2):S1–S4. [PubMed] [Google Scholar]
- 18.Nolph KD, Twardowski ZJ, Popovich RP, et al. Equilibration of peritoneal dialysis solutions during long-dwell exchanges. J Lab Clin Med. 1979;93:246–256. [PubMed] [Google Scholar]
- 19.Denker BM, Smith BL, Kuhajda FP, et al. Identification, purification. And characterization of a novel M,28,000 integral membrane protein from erythrocytes and renal tubules. J Biol Chem. 1988;263:15634–15642. [PubMed] [Google Scholar]
- 20.Preston GM, Carrol TP, Guggino WB, et al. Appearance of water channels in Xenopus oocytes expressing red cell CHIP28 protein. Science (Wash DC) 1992;256:385–387. doi: 10.1126/science.256.5055.385. [DOI] [PubMed] [Google Scholar]
- 21.Agre P, Preston GM, Smith BL, et al. Aquaporin CHIP: the archetypal molecular water channel. Am J Physiol. 1993;265(4 Pt 2):F463–F476. doi: 10.1152/ajprenal.1993.265.4.F463. [DOI] [PubMed] [Google Scholar]
- 22.Pannekeet MM, Mulder JB, Weening JJ, et al. Demonstration of aquaporin-chip in peritoneal tissue of uremic and CAPD patients. Perit Dial Int. 1996;16(Suppl 1):S54–S57. [PubMed] [Google Scholar]
- 23.Devuyst O, Nielsen S, Cosyns J-P, et al. Aquaporin-1 and endothelial nitric oxide synthase expression in capillary endothelia of human peritoneum. Am J Physiol. 1998;275:H234–H242. doi: 10.1152/ajpheart.1998.275.1.H234. [DOI] [PubMed] [Google Scholar]
- 24.Ni J, Verbavtz J-M, Rippe A, et al. Aquaporin-1 plays an essential role in water permeability and ultrafiltration during peritoneal dialysis. Kidney Int. 2006;69:1518–1525. doi: 10.1038/sj.ki.5000285. [DOI] [PubMed] [Google Scholar]
- 25.Smit W, de Waart DR, Struijk DG, et al. Peritoneal transport characteristics with glycerol-based dialysate in peritoneal dialysis. Perit Dial Int. 2000;20:557–565. [PubMed] [Google Scholar]
- 26.Monquil MCJ, Imholz ALT, Struijk DG, et al. The contribution of transcellular water transport in net ultrafiltration failure during CAPD. Perit Dial Int. 1995;15:42–48. [PubMed] [Google Scholar]
- 27.Krediet RT, Lindholm B, Rippe B. Pathophysiology of peritoneal membrane failure. Perit Dial Int. 2000;20(Suppl 4):S22–S42. [PubMed] [Google Scholar]
- 28.Mujais S, Gokal R, Blake P, et al. Evaluation and management of ultrafiltration problems in peritoneal dialysis. Perit Dial Int. 2000;20(Suppl 4):S5–S21. [PubMed] [Google Scholar]
- 29.Smit W, van Dijk P, Schouten N, et al. Peritoneal function and assessment of reference values using a 3.86% glucose solution. Perit Dial Int. 2003;23:440–449. [PubMed] [Google Scholar]
- 30.Twardowski ZJ, Nolph KD, Khanna R, et al. Peritoneal equilibration test. Perit Dial Bull. 1987;7:138–147. [PubMed] [Google Scholar]
- 31.Smit W, Struijk DG, Ho-dac-Pannekeet MM, et al. Quantification of free water transport in peritoneal dialysis. Kidney Int. 2004;66:849–854. doi: 10.1111/j.1523-1755.2004.00815.x. [DOI] [PubMed] [Google Scholar]
- 32.La Milia V, Di Fillipo S, Crepaldi M, et al. Mini-peritoneal equilibration test: a simple and fast method to assess free water and small solute transport across the peritoneal membrane. Kidney Int. 2005;68:840–846. doi: 10.1111/j.1523-1755.2005.00465.x. [DOI] [PubMed] [Google Scholar]
- 33.Cnossen TT, Smit W, Konings CJAM, et al. Quantification of free water transport during the peritoneal equilibration test. Perit Dial Int. 2009;29:523–527. [PubMed] [Google Scholar]
- 34.Bernardo AP, Bajo MA, Santos O, et al. Two-in-one protocol: simultaneous small pore and ultrasmall-pore peritoneal transport quantification. Perit Dial Int. 2012;32:537–544. doi: 10.3747/pdi.2011.00175. [DOI] [PMC free article] [PubMed] [Google Scholar]
- 35.Smit W, Parikova A, Struijk DG, et al. The difference in causes of early and late ultrafiltration failure in peritoneal dialysis. Perit Dial Int. 2005;25(Suppl 3):S41–S45. [PubMed] [Google Scholar]
- 36.Davies SJ. Longitudinal relationship between solute transport and ultrafiltration capacity in peritoneal dialysis patients. Kidney Int. 2004;66:2347–2445. doi: 10.1111/j.1523-1755.2004.66021.x. [DOI] [PubMed] [Google Scholar]
- 37.Parikova A, Smit W, Struijk DG, et al. Analysis of fluid transport pathways and their determinants in peritoneal dialysis patients with ultrafiltration failure. Kidney Int. 2006;70:1988–1994. doi: 10.1038/sj.ki.5001861. [DOI] [PubMed] [Google Scholar]
- 38.Goffin E, Combet S, Jamar F, et al. Expression of aquaporin-1 in a long-term peritoneal dialysis patient with impaired transcellular water transport. Am J Kidney Dis. 1999;33:383–388. doi: 10.1016/s0272-6386(99)70317-3. [DOI] [PubMed] [Google Scholar]
- 39.Williams JD, Craig KJ, Topley N, et al. Morphologic changes in the peritoneal membrane of patients with renal disease. J Am Soc Nephrol. 2002;13:470–479. doi: 10.1681/ASN.V132470. [DOI] [PubMed] [Google Scholar]
- 40.Stoenoiu MS, Ni J, Verkaeren C, et al. Corticosteroids induce expression of aquaporin-1 and increase transcellular water transport in rat peritoneum. J Am Soc Nephrol. 2003;14:555–565. doi: 10.1097/01.asn.0000053420.37216.9e. [DOI] [PubMed] [Google Scholar]
- 41.De Arteaga J, Ledesma F, Garay G, et al. High-dose steroid treatment increases free water transport in peritoneal dialysis patients. Nephrol Dial Transplant. 2011;26:4142–4145. doi: 10.1093/ndt/gfr533. [DOI] [PubMed] [Google Scholar]
- 42.Devuyst O, Rippe B. Water transport across the peritoneal membrane. Kidney Int. 2013 doi: 10.1038/ki.2013.250. advance online publication 26 June 2013; doi:1038/ki.2013.250. [DOI] [PubMed] [Google Scholar]
- 43.Zweers MM, Splint LJ, Krediet RT, et al. Ultrastructure of basement membranes of peritoneal capillaries in a chronic peritoneal infusion model in the rat. Nephrol Dial Transplant. 2001;16:651–654. doi: 10.1093/ndt/16.3.651. [DOI] [PubMed] [Google Scholar]
- 44.Matteijzen MAM, van der Wal AC, Hendriks PMEM, et al. Vascular and interstitial changes in the peritoneum of CAPD patients with peritoneal sclerosis. Perit Dial Int. 1999;19:517–525. [PubMed] [Google Scholar]
- 45.Friedlander MA, Wu YC, Schulak JA, et al. Influence of dialysis modality on plasma and tissue concentrations of pentosidine in patients with end-stage renal disease. Am J Kidney Dis. 1995;25:445–451. doi: 10.1016/0272-6386(95)90107-8. [DOI] [PubMed] [Google Scholar]
- 46.Combet S, Miyata T, Moulin P, et al. Vascular proliferation and enhanced expression of endothelial nitric oxide synthase in human peritoneum exposed to long-term peritoneal dialysis. J Am Soc Nephrol. 2000;11:717–728. doi: 10.1681/ASN.V114717. [DOI] [PubMed] [Google Scholar]
- 47.Korte M, Sampimon DE, Betjes MGH, et al. Encapsulating peritoneal sclerosis; state of affairs. Nature Rev Nephrol. 2012;7:528–538. doi: 10.1038/nrneph.2011.93. [DOI] [PubMed] [Google Scholar]
- 48.Sampimon DE, Coester AM, Struijk DG, et al. The time course of peritoneal transport parameters in peritoneal dialysis patients who develop encapsulating peritoneal sclerosis. Nephrol Dial Transplant. 2011;26:291–298. doi: 10.1093/ndt/gfq343. [DOI] [PubMed] [Google Scholar]
- 49.Kolesnyk I, Dekker FW, Boeschoten EW, et al. Time dependent reasons for PD technique failure and mortality. Perit Dial Int. 2010;30:170–177. doi: 10.3747/pdi.2008.00277. [DOI] [PubMed] [Google Scholar]
- 50.Fuszholler A, Zur Nieden S, Grabensee B, et al. Peritoneal fluid and solute transport: influence of treatment time, dialysis modality and peritonitis incidence. J Am Soc Nephrol. 2002;13:1055–1060. doi: 10.1681/ASN.V1341055. [DOI] [PubMed] [Google Scholar]
- 51.Davies SJ, Bryan J, Phillips I, et al. Longitudinal changes in peritoneal kinetics: the effects of peritoneal dialysis and peritonitis. Nephrol Dial Transplant. 1996;11:498–506. [PubMed] [Google Scholar]
- 52.Liberek T, Topley N, Jörres A, et al. Peritoneal dialysis fluid inhibition of polymorphonuclear leucocyte respiratory burst activation is related to the lowering of intracellular pH. Nephron. 1993;65:260–265. doi: 10.1159/000187485. [DOI] [PubMed] [Google Scholar]
- 53.Topley N, Coles GA, Williams JD. Biocompatibility studies on peritoneal cells. Perit Dial Int. 1994;14(Suppl 3):S21–S28. [PubMed] [Google Scholar]
- 54.Parikova A, Zweers MM, Hiralall JK, et al. Does the residual volume after drainage matter in peritoneal dialysis treatment? Perit Dial Int. 2004;24:75–77. [PubMed] [Google Scholar]
- 55.Pedersen FB, Ryttov N, Deleuran P, et al. Acetate versus lactate in peritoneal dialysis solutions. Nephron. 1985;39:55–58. doi: 10.1159/000183338. [DOI] [PubMed] [Google Scholar]
- 56.Wieslander AP, Nordin MK, Kjellstrand PT, et al. Toxicity of peritoneal dialysis fluids on cultured fibroblasts, L-929. Kidney Int. 1991;40:77–79. doi: 10.1038/ki.1991.182. [DOI] [PubMed] [Google Scholar]
- 57.Davies SJ, Phillips L, Naish P, et al. Peritoneal glucose exposure and changes in membrane solute transport with time on peritoneal dialysis. J Am Soc Nephrol. 2000;12:1046–1051. doi: 10.1681/ASN.V1251046. [DOI] [PubMed] [Google Scholar]
- 58.Ho-dac-Pannekeet MM, Weiss MF, de Waart DR, et al. Analysis of non enzymatic glycosylation in vivo: impact of different dialysis solutions. Perit Dial Int. 1999;19(Suppl 2):S68–S74. [PubMed] [Google Scholar]
- 59.Krediet RT. Dialysate cancer antigen 125 concentration as marker of peritoneal membrane status in patients treated with chronic peritoneal dialysis. Perit Dial Int. 2001;21:560–567. [PubMed] [Google Scholar]
- 60.Lopes- Barreto D, Krediet RT. Current status and practical use of effluent biomarkers in peritoneal dialysis patients. Am J Kidney Dis. 2013;62:823–833. doi: 10.1053/j.ajkd.2013.01.031. [DOI] [PubMed] [Google Scholar]
- 61.Krediet RT, van Westrhenen R, Zweers MM, et al. Clinical advantages of new peritoneal dialysis solutions. Nephrol Dial Transplant. 2002;17(Suppl 3):16–18. doi: 10.1093/ndt/17.suppl_3.16. [DOI] [PubMed] [Google Scholar]
- 62.Van Westrhenen R, Vlijm A, Hiralall JK, et al. Experimental study on long-term exposure to a biocompatible, hypertonic, pyruvate-buffered dialysis solution. Perit Dial Int. 2008;28(Suppl 5):S43–S47. [PubMed] [Google Scholar]
- 63.Krediet RT, Zweers MM, van Westrhenen R, et al. Effects of reducing the lactate and glucose content of PD solutions on the peritoneum: is the future GLAD? NDT Plus. 2008;1(Suppl 4):iv 56–iv 62. doi: 10.1093/ndtplus/sfn126. [DOI] [PMC free article] [PubMed] [Google Scholar]
- 64.De Graaff M, Zegwaard AH, Zweers MM, et al. The effects of a dialysis solution with a combination of glycerol/aminoacids/dextrose on the peritoneal membrane in chronic renal failure. Perit Dial Int. 2010;30:192–200. doi: 10.3747/pdi.2008.00159. [DOI] [PubMed] [Google Scholar]


