Abstract
In most mammalian species, the removal of one lung results in dramatic compensatory growth of the remaining lung. To investigate the contribution of alveolar macrophages (AM) to murine post-pneumonectomy lung growth, we studied bronchoalveolar lavage (BAL)-derived AM on 3, 7, 14 and 21 days after left pneumonectomy. BAL demonstrated a 3.0-fold increase in AM (CD45+, CD11b−, CD11c+, F4/80+, Gr-1− ) by 14 days after pneumonectomy. Cell cycle flow cytometry of the BAL-derived cells demonstrated an increase in S+G2 phase cells on days 3 (11.3± 2.7 %) and 7 (12.1±1.8 %) after pneumonectomy. Correspondingly, AM demonstrated increased expression of VEGFR1 and MHC class II between days 3 and 14 after pneumonectomy. To investigate the potential contribution of peripheral blood cells to this AM population, parabiotic mice (wild-type/GFP) underwent left pneumonectomy. Analysis of GFP+ cells in the post-pneumonectomy lung demonstrated that by day 14, less than 1% of the alveolar macrophage population were derived from the peripheral blood. Finally, AM gene transcription demonstrated a significant shift from decreased transcription of angiogenesis-related genes on day 3 to increased transcription on day 7 after pneumonectomy. The increased number of locally proliferating AM, combined with their growth-related gene transcription, suggests that AM actively participate in compensatory lung growth.
Introduction
In normal circumstances, the alveolar macrophage (AM) is a prominent component of the lung alveoli. An estimated 95% of the hematopoietic cellular content of the lung airspace is alveolar macrophages (Martin and Frevert, 2005). AM are essential in inflammatory processes for the clearance of pathogens and debris (Brain, 1992); however, the potential regulatory role of AM in non-inflammatory lung processes, such as post-pneumonectomy lung growth, is less clear.
In most mammalian species, removal of one lung results in compensatory growth of the remaining lung to near-baseline levels. Compensatory lung growth has been observed in rats (Addis, 1928), mice (Tatar-Kiss et al., 1984), dogs (Heuer and Dunn, 1920), cats (Bremer, 1936), rabbits (Sery et al., 1969) and ferrets (McBride, 1989). By histologic criteria, post-pneumonectomy lung growth is a non-inflammatory lung process that results in the increase in not only lung weight, but also alveolar number (Fehrenbach et al., 2008).
Recent developments suggest the potential importance of alveolar macrophages in post-pneumonectomy lung growth. First, studies in both humans and rodents have demonstrated the importance of macrophages in maintaining the hematopoietic stem cell niche (Ehninger and Trumpp, 2011). The recent finding that blood-borne CD34+ progenitor cells contribute to compensatory lung growth (Chamoto et al., 2011) suggests that alveolar macrophages may participate in regulating alveolar construction. Second, tissue macrophages have been shown to regulate epithelial proliferation (Cakarova et al., 2009) as well as neovascularization and vascular stabilization (Sunderkotter et al., 1994) Both epithelial proliferation and alveolar angiogenesis are central features of post-pneumonectomy lung growth.
Few studies have addressed the alveolar macrophage contribution to post-pneumonectomy lung growth. Cell composition studies have demonstrated no significant change in the proportion of alveolar macrophages (Das and Thurlbeck, 1979; Rannels et al., 1991; Thet and Law, 1984), despite a small increase in alveolar macrophages concentration in bronchoalveolar lavage fluid (Kakizaki et al., 2009). Although more than 20 years have passed since Rannels’ original speculation that alveolar macrophages might “release growth-promoting factors active against other lung cells” in response to post-pneumonectomy mechanical stretch (Rannels, 1989), the role of alveolar macrophages in post-pneumonectomy lung growth remains unknown.
In this report, we investigated the population dynamics and potential regulatory contribution of alveolar macrophages after murine pneumonectomy. Using a parabiotic pneumonectomy model, we demonstrated that the alveolar macrophage pool was increased by local proliferation alone. The potential role of this population of alveolar macrophages in alveolar angiogenesis was suggested by the active transcription of genes relevant to vascular growth.
Methods
Mice
Male mice, eight to ten week old wild type C57BL/6 (Jackson Laboratories, Bar Harbor, ME), were used for all non-parabiotic experiments. Wild-type and GFP+ C57BL/6-Tg (UBC-GFP) 30Scha/J (Jackson laboratories, Bar Harbor, ME) with similar weights were selected for parabiosis. The care of the animals was consistent with guidelines of the American Association for Accreditation of Laboratory Animal Care (Bethesda, MD) and approved by our Institutional Animal Care and Use Committee.
Parabiotic surgery
The animals were paired based on a modified technique described by Bunster (Bunster and Meyer, 1933). The animals were anesthetized with a intraperitoneal injection of ketamine 100 mg/kg (Fort Dodge Animal Health, Fort Dodge, IA) and xylazine 10 mg/kg (Phoenix Scientific, St. Joseph, MO). After satisfactory anesthesia, the skin and subcutaneous tissue overlying the thorax and abdomen (right side of the wild type mouse and the left side of the GFP+ mouse) was incised and the pair joined by a running monofilament suture as previously described (Gibney et al., 2011a). Postoperatively, each parabiont was given a subcutaneous 1 ml bolus of warmed 0.9% sodium chloride (Abbott Laboratories, North Chicago, IL) twice daily for 48 hours. Analgesia (Buprenorphine, 0.05 mg/kg, Webster Generics, Sterling, MA) was given twice daily for 48 hours and titrated to activity. 1% Sulfatrim water (Webster Generics, Sterling, MA) was provided in the cage for 28 days. Left pneumonectomy was performed 28 days after parabiosis. Cross-circulation equilibrium prior to left pneumonectomy, typically established by 14 days, was confirmed by a “spot assay” as well as flow cytometry (Gibney et al., 2011a).
Pneumonectomy
After general anesthesia, the mouse was orally intubated (Gibney et al., 2011c) and the animal was ventilated on a Flexivent (SCIREQ, Montreal, QC Canada) at ventilator settings of 200/min, 10 ml/kg, and PEEP of 2 cmH2O with a pressure limited constant flow profile. A thoracotomy was created in the left fifth intercostal space and a left pneumonectomy was performed by hilar ligation (Gibney et al., 2011b). The entire left lung distal to the hilar ligature was removed. At the completion of the procedure, the animal was removed from the ventilator and observed for spontaneous respirations. The animal remained intubated until spontaneous muscle activity was noted. With return of spontaneous respiratory effort, the animal was extubated and transferred to a warmed cage. Sham thoracotomy involved an identical incision and closure without surgical manipulation of the left lung.
BAL treatment
The time course of BAL analysis was based on prior developmental studies in rodents (Burri, 2006). After a cervical tracheostomy, an olive-tipped catheter was inserted and secured with a silk suture. Cold PBS (500 ul) was slowly delivered and retrieved through the catheter; the lavage was repeated 7 times. BAL cells were treated with red blood cell lysis buffer (BD Biosciences), washed in 3% serum containing medium, and stored on ice for subsequent analysis.
Cell isolation and sorting
BAL cells were stained with biotinylated anti-CD11b mAb, and washed by FACS buffer (BD Biosciences). After the incubation with 3 ul avidin-conjugated Dynabeads (Sigma, St. Louis, MO) for 20 min, CD11b+ cells were removed by magnetic separation. The remaining CD11b− cells were stained with biotinylated anti-CD11c mAb and washed by FACS buffer. The cells were incubated with 3 ul avidin-conjugated Dynabeads (Sigma) for 20 min and CD11c+ cells were purified by magnetic separation. The purified cells, with over 90% purity demonstrated by flow cytometry, were used for subsequent PCR array analysis.
Cell counting
BAL cells were counted using a Neubauer hemacytometer (Fisher, Pittsburgh, PA). Dead cells were excluded by trypan blue (Sigma, St Louis, MO). The numbers of CD11c+ CD11b− cells (AM) were calculated by using flow cytometric analysis: (AM number) = (total BAL cell number) × (% of CD11c+ CD11b− cells among total cells) / 100.
Monoclonal antibodies
For flow cytometric lung cell analyses, fluorescein isothiocynate (FITC), phycoerythrin (PE), Allophycocyanin (APC), PE-Cy7-conjugated monoclonal antibodies (mAb) were used: anti-CD45 mAb (FITC, rat IgG2b, clone 30-F11, eBioScience), anti-CD11c mAb (PE or APC; hamster IgG, clone N418, eBioScience), anti-CD11b mAb (FITC or PE-Cy7, rat IgG2b, clone M1/70, BD Bioscience), anti-Gr-1 mAb (APC, rat IgG2b, clone RB-8C5, eBioScience), anti-F4/80 mAb (biotin, rat IgG2a, clone BM8, eBioScience), anti-VEGFR1 mAb (PE, rat IgG2b, clone 141522, R&D), anti-MHC classII mAb (APC, Rat IgG2b, clone M5/114.15.2), anti-CD69 mAb (PE, hamster IgG, clone H1.2F3 Biolegend), anti-Ly6G mAb (biotin, clone 1A8, BD Bioscience), anti-NK1.1 (PE, IgG2a, clone PK136, eBioscience), isotype control rat IgG2a (biotin, clone eBR2a, eBioScience), isotype control rat IgG2b (FITC, APC or PE, clone A95-1, BD Bioscience), isotype control rat IgG2b (PE-Cy7, clone RTK4530, Biolegend), isotype control hamster IgG (PE, clone HTK888, Biolegend) and isotype control hamster IgG (APC, clone eBio299arm, eBioscience.)
Flow cytometry
For standard phenotyping, the cells were incubated with a 5-fold excess of anti-mouse antibodies directly conjugated with FITC, PE, APC, PE-Cy7 or biotin. The cells stained with biotinylated antibodies were washed by FACS buffer (BD Biosciences) and subsequently stained with streptavidin-RPE (Sigma, St Louis, MO). The cells were analyzed by FACSCanto II (BD, Franklin Lakes NJ) with tri excitation laser (407nm, 488nm and 633nm ex). The data were analyzed by FCS Express 4 software (De Novo Software, Los Angeles, CA). In all analyses, debris were eliminated by gating the alive cell population of Side Scatter (SSC) and Forward Scatter (FSC), and further by gating the 7-amino-actinomycin D (7AAD, BD Biosciences)-negative population.
DNA cell-cycle analysis
For cell cycle analysis, the cells were pre-warmed to 37°C, treated with 20 ug/ml Hoechst 33342 (Molecular Probes, Carlsbad, CA) or 200 ug/ml 7AAD (BD Biosciences) and incubated for 45 min at 37°C. The cells were washed, stained with antibodies and analyzed using a FACSCanto II flow cytometer (BD Biosciences). In each experiment, samples were individually assessed to be within the guidelines of the DNA Consensus Conference criteria for quality (extrapolated to non-neoplastic tissue)(Shankey et al., 1993). The cells were analyzed by FCS express 4 autoanalysis and autolinearity algorithms (De Novo Software Los Angeles, CA). Because of nuclear density interference and other staining nonlinearities (Wersto et al., 2001), the G2/G1 ratio was typically modified using the FCS express 4 autolinearity algorithm.
Immunohistochemical staining
As previously described (Lin et al., 2011), cryostat sections were warmed and blocked with 20% sheep serum, 20% goat serum, 0.1% azide in PBS. The slides were treated with anti-PCNA antibody (Clone PC10, Dako, Hamburg, Germany). The slides were washed twice and treated with avidin-biotin-peroxidase complex (Vectastatin ABC-Kit, Vector Laboratories) or with the Envision® kit (Dako, Hamburg, Germany). After 15 minute incubation, the slides were washed twice, developed and counterstained with hematoxylin (Sigma).
PCR arrays
The commercially available Angiogenesis Array (catalog PAMM-024) obtained from S.A.Biosciences (Frederick, MD) was used for all PCR array experiments. Real-time PCR was performed with SYBR green qPCR master mixes that include a chemically- modified hot start Taq DNA polymerase (SABioscience). PCR was performed on ABI 7300 Real-Time PCR System (Applied Biosystems). For all reactions, the thermal cycling conditions were 95°C for 10 min followed by 40 cycles of denaturation at 95°C for 15 sec and simultaneous annealing and extension at 60°C for 1 min. The two sets of triplicate control wells (RTC and PPC) were also examined for inter-well and intra-plate consistency; standard deviations of the triplicate wells were uniformly less than 1 Ct. To reduce variance and improve inferences per array (Kendziorski et al., 2005), we used a design strategy that combined pooled samples (typically 3 mice).
RNA quality
For the rapid analysis of RNA quantity and quality, all samples were analyzed using the Agilent 2100 Bioanalyzer (Agilent Technologies, Palo Alto, CA). In most samples, the RNA Pico 6000 LabChip kit (Agilent Technologies) was used. RNA integrity numbers (RIN) of the RNA samples were uniformly greater than 7.4 (mean 8.3; range 7.4 to 9.7)(Schroeder et al., 2006).
Statistical analysis
Our quantitative PCR assumed that DNA template and/or sampling errors were the same for all amplifications; our internal control replicates indicated that our sample size was sufficiently large that sampling errors were statistically negligible (Stolovitzky and Cecchi, 1996). The exponential phase of the reaction was determined by a statistical threshold (10 standard deviations). Flow cytometry statistical analysis was based on measurements in at least three different mice. The unpaired Student's t-test for samples of unequal variances was used to calculate statistical significance. The data was expressed as mean ± one standard deviation (SD). The significance level for the sample distribution was defined as p<.05.
Results
Population dynamics after pneumonectomy
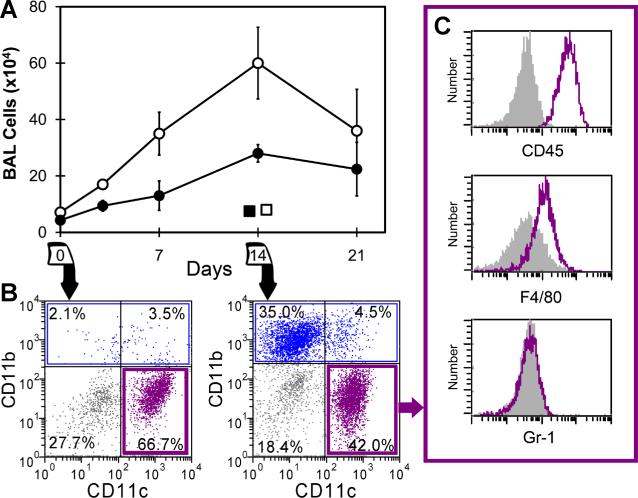
To investigate the population dynamics within the alveolar airspace, bronchoalveolar lavage (BAL) of the right lung was performed prior to and after left pneumonectomy and in age-matched nonsurgical and sham thoracotomy controls. The BAL samples obtained on 3, 7, 14 and 21 days (N=4-5, each time point) after pneumonectomy demonstrated an increase in both the total number of cells as well as the cells phenotypically defined as alveolar macrophages (AM)(CD45+, CD11b−, CD11c+, F4/80+, Gr-1−) (Figure 1). The non-AM cells in BAL fluid reflected small populations of monocytes, neutrophils and dendritic cells. On day 14 after pneumonectomy, the percentage of each cell population within the BAL fluid was CD45+ (84%), CD11c+ (59%), CD11b+ (38%), Gr-1+ (2%), F4/80+ (41%), NK1.1+ (1%), B220+ (2%), CD3+ (7%), Cytokeratin+ (20% in CD45− cells)(Figure S1). The total number of cells in the BAL fluid increased 4.9-fold; the AM population increased 3.0-fold.
Figure 1.
Bronchoalveolar lavage cells in the lung after pneumonectomy. A) The total number of BAL cells (open circle) and AM (closed circle) were determined on 0, 3, 7, 14, and 21 days after pneumonectomy (each data point, N=4-5 mice). Sham thoracotomy controls of the total number of BAL cells (open square) and AM (closed square) are shown. Error bars reflect the mean + 1 SD. B) The CD11b− CD11c+ population (purple) and CD11b+ population (blue) of BAL cell were defined on 0 and 14 days after pneumonectomy. C) After gating the presumed AM population (purple), the expression of the CD45, F4/80 and Gr-1 cell surface molecules were compared to isotype control (gray).
Local alveolar macrophage proliferation
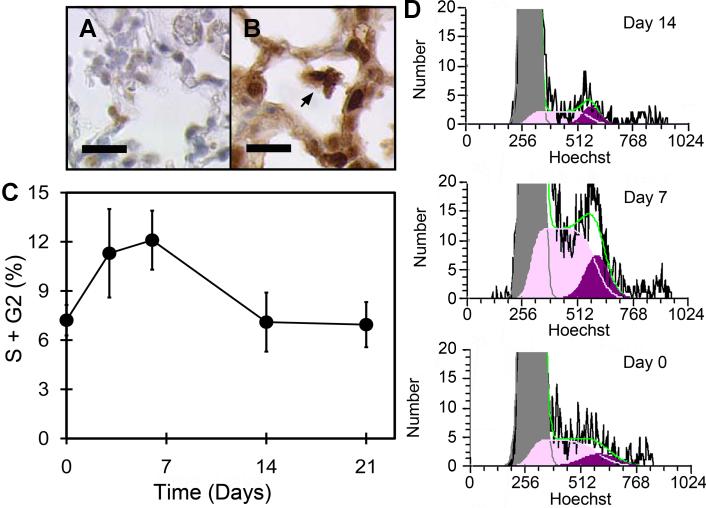
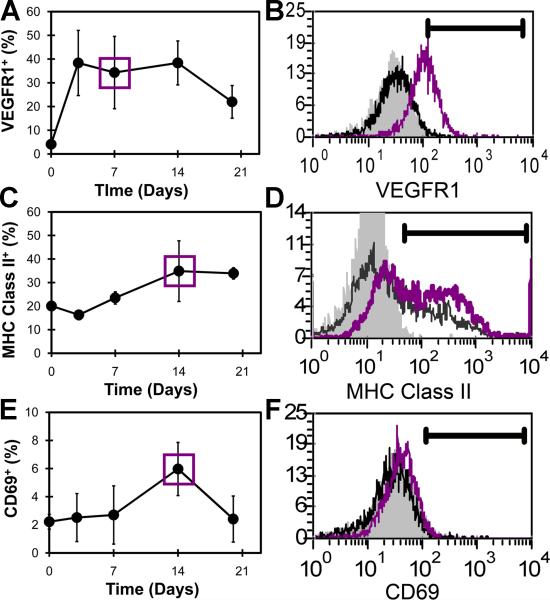
The local proliferation of airspace AM was studied by immunohistochemistry as well as BAL and flow cytometry (Figure 2). Anti-PCNA immunohistochemistry of the post-pneumonectomy lung on days 3 (Figure 2B) and 7 (not shown) demonstrated significant cellular proliferation. To provide a quantitative assessment of cell proliferation, the airspace cells were isolated by BAL and studied by flow cytometry. Using the DNA dyes Hoechst 33342 and 7AAD, flow cytometry of the BAL cells demonstrated increased number of cells in S and G2 phase of the cell cycle on days 3 and 7 after pneumonectomy. The number of cells in S and G2 phases was diminished by day 14 after pneumonectomy and back to baseline levels by 21 days. Surface activation markers expressed on BAL cells were also studied by flow cytometry. Expression of VEGFR1, the protein product of the Flt1 gene, was elevated by day 3 after pneumonectomy (Figure 3A,B). In contrast, the immunologically relevant activation marker MHC Class II reached a peak of expression on day 14 after pneumonectomy (Figure 3C,D). The surface expression of the activation molecule CD69 also peaked on day 14 after pneumonectomy (Figure 3E,F).
Figure 2.
Local proliferation of AM during lung regeneration. Control (A) and anti-PCNA (B) immunohistochemistry of the regenerating lung on day 3 after pneumonectomy. C) Flow cytometry cell cycle analysis of regenerating lung cells after BAL. After exclusion of debris by light scatter gating, automated analysis (FCS Express 4; silenced background mode) excluded aggregates and identified S phase and G2 phase cells. Cell cycle profiles of BAL-derived AM were determined on day 0, 7, 14, 21 after pneumonectomy. Mean values + 1 SD are shown; N=3-4 mice per time point. D) Representative cell cycle histograms demonstrating S phase (S; light purple) and G2 phase (G2; dark purple) cells on days 0, 7 and 14 after pneumonectomy; MFI=mean fluorescence intensity. The green line reflects the cumulative percentage of S + G2 cells.
Figure 3.
Kinetics of alveolar macrophage activation during lung growth. The expressions of VEGFR1 (A), MHC class II (C), and CD69 (E) on AM were examined on day 0, 7, 14, and 21 days after pneumonectomy. B) Representative single parameter histogram of AM stained with anti-VEGFR1 mAb (dark gray line=day7; black line=day0; light gray=isotype control). D) Representative histogram of AM stained with anti-MHC classII mAb (dark gray line=day14; black line=day0; light gray=isotype control). F) Representative histogram of AM stained with the anti-CD69 mAb (dark gray line=day14; black line=day 0; light gray=isotype control. Mean values + 1 SD are shown; N=3-4 mice per time point.
Blood-borne migration of alveolar macrophages
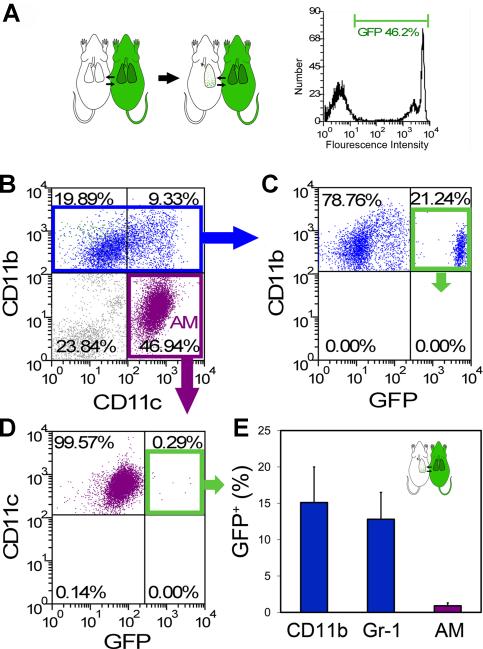
The potential contribution of blood-borne cells to the elevated number of AM was investigated using a parabiotic model (wild-type/GFP) of cell migration. Parabiotic mice (wild-type/GFP) with complete cross-circulation (Gibney et al., 2011a) underwent left pneumonectomy and the remaining lung was studied 14 days after surgery. The migration of GFP+ cells into the post-pneumonectomy lung was studied by BAL and flow cytometry. Gating on the CD11b+ population, nearly 15% of the isolated cells were GFP+ (7.6×10⁴ cells) (Figure 4B, C). Similarly, 13% of the CD11b+ , Gr-1+ cells were GFP+ (0.8×10³ cells) (Figure 4E). The Gr-1+ cells in the BAL fluid were also Ly6G+ indicating a neutrophil phenotype (Daley et al., 2008). In contrast, less than 0.5% of the AM population defined as CD11b− , CD11c+ , F4/80+ were GFP+ (0.5×10⁴ cells)(Figure 4C, D and E). Since both the wild-type (GFP−) and GFP+ parabionts contributed equally to the circulation (Gibney et al., 2011a), less than 1% of the AM population was derived from the peripheral blood.
Figure 4.
Parabiotic demonstration of rare blood-borne AM after pneumonectomy. A) Schematic of the parabiotic experiments with parabiosis being established for 28 days prior to left pneumonectomy (left). Cross-circulation equilibrium was confirmed by single parameter flow cytometry (right). B-D) Because the cumulative effects of cell activation, migration and proliferation were maximal on day 14, BAL cells were studied 14 days after pneumonectomy. B) After gating CD11b+ Gr-1- (blue) or CD11b- CD11c+ cell populations (purple), the frequency of GFP+ cell migration was determined. Representative dual parameter histograms are shown (C, D). E) Flow cytometry of BAL cells demonstrated that an average of 15.1+4.9% of CD11b+ Gr-1- cells, 12.8+3.7% of CD11b+ Gr-1+ cells and 0.9+0.4% of AM were blood-borne cells (p<.001; N=4 mice, error bars reflect the mean + 1 SD). Of note, separately analyzed AM from the GFP+ parabiont demonstrated GFP expression similar to the CD11b+ cells shown here (C).
Alveolar macrophages and angiogenesis
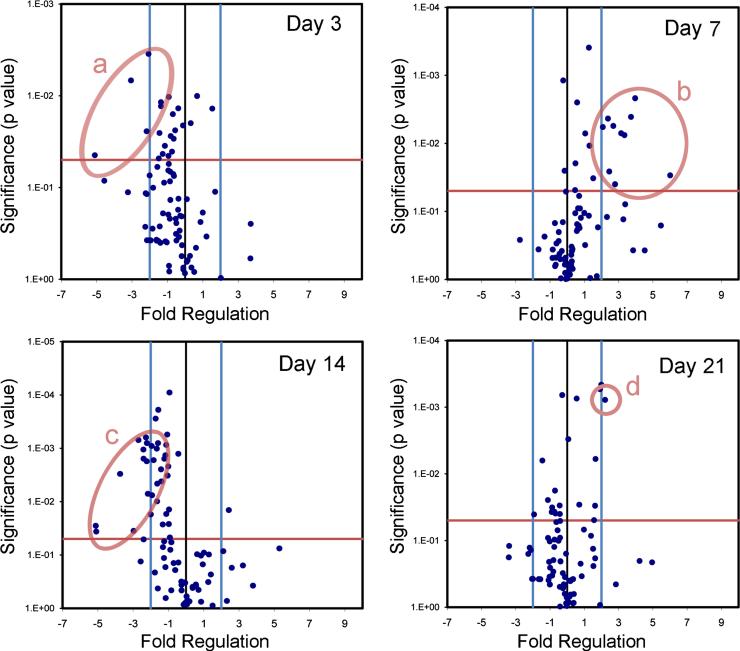
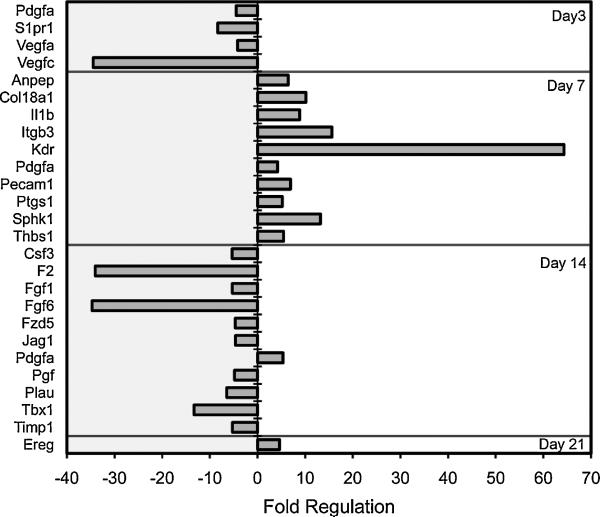
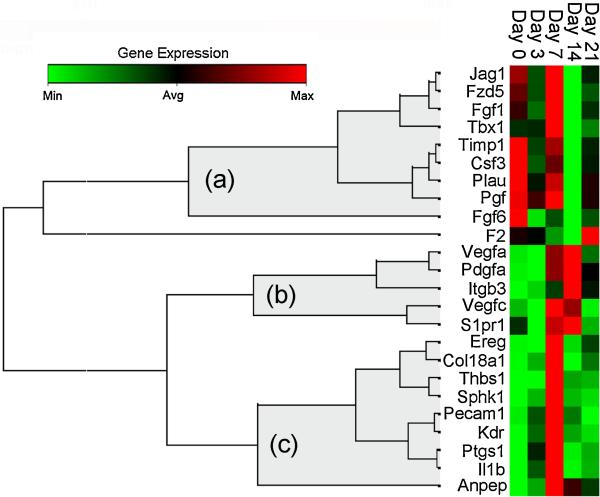
To investigate the contribution of AM to alveolar angiogenesis, the transcriptional profile of BAL-derived AM was studied by PCR arrays. BAL-derived AM obtained on post-pneumonectomy days 3, 7, 14 and 21 demonstrated 24 angiogenesis-related genes with a significant difference (p<.05, t-test) and greater than a 4-fold change in expression compared to control AM (Figure 5). The volcano plot data, replotted for clarity, demonstrated a significant shift in AM expression from the negative regulation of angiogenesis-related gene transcription on day 3, to the positive regulation of angiogenesis-related genes on day 7 after pneumonectomy (Figure 6). To clarify this temporal pattern, the PCR arrays were analyzed using hierarchical clustering. Consistent with 3 “waves” of gene expression, 3 patterns of gene expression emerged: one group with decreased early gene expression on day 3 (Figure 7a), a second group with peak expression on day 7 (Figure 7b) and a third group with decreased late gene expression on day 14 after pneumonectomy (Figure 7c).
Figure 5.
Expression of angiogenesis-related genes in BAL-derived AM after pneumonectomy. Gene expression in mice 3, 7, 14 and 21 days after pneumonectomy was compared to age-matched controls without surgery. The log2 fold-change in gene expression was plotted against the p-value (t-test) to produce a “volcano plot.” The vertical threshold reflected the relative statistical significance (red horizontal line, -log10, p < 0.05); the horizontal threshold reflected the relative fold-change in gene expression (blue vertical line, 4-fold). The significant change in the expression of specific genes is highlighted (red ellipses): a) Pdgfa, S1pr1, Vegfa, and Vegfc; b) Anpep, Col18a1, Il1b, Itgb3, Kdr, Pdgfa, Pecam1, Ptgs1, Sphk1, and Thbs1; c) Csf3, F2, Fgf1, Fgf6, Fzd5, Jag1, Pdgfa, Pgf, Plau, Tbx1, Timp1; and d) Ereg. Each data point reflects 6 arrays (N=3 mice per array).
Figure 6.
Expression of angiogenesis-related genes in BAL-derived AM 3, 7, 14 and 21 days after pneumonectomy. The gene expression data presented in the volcano plots (Figure 5) was replotted for comparison purposes. The AM genes demonstrating statistically significant difference (p<.05, t-test and greater than 4-fold regulation) are shown.
Figure 7.
Temporal expression clustergram mapping of growth-related genes contributing to alveolar construction. Genes demonstrating a statistically significant change in expression (p<.05, t-test, greater than 4-fold regulation) at one or more time points were clustered using an agglomerative hierarchical clustering algorithm that produced 3 temporal patterns (a, b, and c). The similarity/dissimilarity metric was based on the Pearson correlation coefficient between two dimension profiles of qRT-PCR gene expression. The dendrogram was produced using an “average” linkage method; (a), (b) and (c) represent gene clusters with temporal linkage. The colored matrix display was encoded based on the value of the gene at the 5 time points; the relative dissimilarity index in the unshaded portion of the dendrogram was compressed for presentation purposes.
Discussion
In this report, we investigated the alveolar macrophage (AM) dynamics associated with murine post-pneumonectomy lung growth. Our data indicated that 1) there was a marked increase in the number of airspace AM, 2) the post-pneumonectomy increase in AM number was due to local proliferation and not blood-borne precursor cells, 3) phenotypic activation persisted during the 3 week duration of compensatory growth, and 4) functional activation was suggested by at least 3 waves of angiogenesis-related gene transcription. Together, these findings suggest a dynamic role for AM in post-pneumonectomy alveolar growth.
The origin of AM has been variously attributed to blood-borne precursors, lung progenitors and local self-renewal. Most studies of AM turnover have used bone marrow transplant models created through total body irradiation conditioning regimens (Blusse van oud Alblas and Van Furth, 1979; Godleski and Brain, 1972; Matute-Bello et al., 2004; Perez-Arellano et al., 1990). The AM sensitivity to conditioning levels of radiation (Hubbard et al., 2008; Tarling et al., 1987), however, suggests that the observed turnover in these studies may have reflected toxic injury more than the steady state turnover of AM. Shielding of the lung has led to much lower levels of AM turnover (Murphy et al., 2008). Most studies have also shown a dramatic increase in AM turnover in the presence of bacterial pathogens and other forms of lung inflammation (Maus et al., 2006). In this study, we examined AM population dynamics in a model without radiation injury or bacterial inflammation; routine post-pneumonectomy lung growth in mice is associated with a 30% increase in alveolar number without apparent inflammation (Fehrenbach et al., 2008). Further, the analysis of AM kinetics in our mice indicated a 3-fold increase in the number of BAL-derived macrophages. The biologic question was whether these new AM were derived from the peripheral blood or from local self-renewal.
To avoid the limitations of radiation and/or bone marrow transplantation, we performed pneumonectomies in parabiotic (wild-type/GFP) mice. The use of GFP+ parabiotic mice was particularly useful in determining the peripheral blood contribution to parenchymal population dynamics. GFP fluorescence was brightly expressed on peripheral blood and bone marrow cells--GFP was not diluted by cell division nor influenced by surface phenotype. Thus, GFP fluorescence provided a “fate map”; that is, cells derived from the peripheral blood could be reliably tracked in the tissues irrespective of subsequent differentiation phenotype or migratory destination. The near-absence of GFP+ AM provided convincing evidence for self-renewal during lung regeneration.
Although these studies seem to conclusively demonstrate local self-renewal in post-pneumonectomy lung growth, there are 3 theoretical limitations. First, the establishment of cross-circulation is complete by 12-14 days (Gibney et al., 2011a), but the exchange flow between parabionts requires days for equilibration. It is possible that a limited release of short-lived AM precursors into the peripheral blood would not have sufficient time for cross-circulation. On the other extreme, it is possible that the circulation of blood-borne precursors was delayed beyond the timeframe examined in this study. Both of these possibilities are inconsistent with the integral time scale of lung regeneration as well as the time course of endothelial progenitor cells observed in this model (Chamoto et al., 2011). Finally, it is possible that growth-related activation of blood-derived AM led to a phenotypic shift (e.g. increased CD11b expression) that masked the presence of blood-borne AM. Whereas this possibility is difficult to exclude, we were unable to demonstrate a transitional surface phenotype (e.g. CD11b and GFP co-expression) compatible with in situ activation nor were significant numbers of GFP+ AM detected at any time point post-pneumonectomy. Based on these results, we conclude that the increase in alveolar number associated with post-pneumonectomy lung growth was solely attributable to local self-renewal.
Because of the complexity of alveolar morphogenesis, it is not likely that AM are a unilateral controlling element in alveolar construction; nonetheless, it is likely that AM actively participate in a network of signaling interactions. This signaling network complicates the interpretation of traditional macrophage ablation/reconstitution experimental design. An alternative experimental approach investigates post-pneumonectomy lung growth at the “tissue-scale.” Tissue-scale models typically consider individual cell types as “nodes” and the exchanges between cells as “edges” in computational networks. The structural composition of the lung—repeating functional units and phenotypically uniform cell types in a relatively closed system—makes this approach particularly appealing in the study of compensatory growth. In tissue-scale networks, any measurable or quantifiable property can be considered a variable of interest to be associated with a node. In adult morphogenesis, issues such as cell shape properties and the tissue mechanics are also among the variables associated with a node at this scale. Here, we studied a phenotypically uniform cell type (alveolar macrophages) and analyzed the transcriptional profile associated with the morphogenetic process of angiogenesis. We anticipate that the value of this data will grow as other nodes in the tissue-scale network are defined, and more AM variables are characterized.
When compared to the transcriptional signature of control cells, the AM demonstrated several “waves” of negatively and positively regulated gene transcription. Consistent with AM participation in growth-related angiogenesis, the transcription of 10 genes was significantly increased 7 days after pneumonectomy. By analogy with lung development (Burri, 1974), this timepoint is coincident with active alveolar angiogenesis. An intriguing observation was the prominent increase in Kdr and Pdgfa transcription. Kdr encodes a type III receptor tyrosine kinase that functions as a main mediator of VEGF-induced signaling (Ziegler et al., 1999). Perhaps not coincidently, Vegfa transcription in both endothelial cells and AM was elevated during this period of lung growth. Similarly, the Kdr signaling, notable in not only macrophages, but also other lung cells (Kranenburg et al., 2005), suggests a broader role for VEGF in lung growth (Brown et al., 2001).
The transcription of a prominent pro-angiogenic gene, Pdgfa, was also enhanced 7 days after pneumonectomy. Encoded by the Pdgfa gene, PDGFA is mitogenic for mesenchymal lung cells (Andrae et al., 2008); conversely, a loss of Pdgfa gene function appears to perturb alveolar septation (Bostrom et al., 2002; Bostrom et al., 1996; Lindahl et al., 1997). The enhanced expression of Pdgfa coinciding with alveolar angiogenesis is further support for the participation of AM in growth regulation. Also notable was the enhanced expression of Ereg. A gene encoding a ligand of EGFR (epidermal growth factor receptor), as well as a ligand of most members of the ERBB (v-erb-b2 oncogene homolog) family of tyrosine-kinase receptors, Ereg transcription was increased on day 21 after pneumonectomy. The increased expression of Ereg suggests a growth promoting interaction between AM and epithelial and stromal cells.
In summary, our data indicates a reproducible response of murine AM to pneumonectomy and the active participation of AM in compensatory lung growth. We have demonstrated an increase in AM number—commensurate with lung growth—that appears to be solely determined by local self-renewal. This increasing AM population actively transcribed several genes associated with tissue growth. The functional associations and temporal pattern of gene transcription suggests that murine AM actively participate in compensatory lung growth.
Footnotes
This work was supported by NIH grants HL75426, HL94567 and HL007734 as well as the Uehara Memorial Foundation and the JSPS Postdoctoral Fellowships for Research Abroad.
Abbreviations: 7AAD, 7-amino-actinomycin D; AM, alveolar macrophages; BAL, bronchoalveolar lavage; GFP, green fluorescence protein; mAb, monoclonal antibodies; MFI, mean fluorescence intensity; SD, standard deviation
References
- Addis T. Compensatory hypertrophy of the lung after unilateral pneumectomy. J Exp Med. 1928;47(1):51–56. doi: 10.1084/jem.47.1.51. [DOI] [PMC free article] [PubMed] [Google Scholar]
- Andrae J, Gallini R, Betsholtz C. Role of platelet-derived growth factors in physiology and medicine. Genes Dev. 2008;22(10):1276–1312. doi: 10.1101/gad.1653708. [DOI] [PMC free article] [PubMed] [Google Scholar]
- Blusse van oud Alblas A, Van Furth R. Origin, kinetics, and characteristics of pulmonary macrophages in the normal steady-state. J Exp Med. 1979;149(6):1504–1518. doi: 10.1084/jem.149.6.1504. [DOI] [PMC free article] [PubMed] [Google Scholar]
- Bostrom H, Gritli-Linde A, Betsholtz C. PDGF-A/PDGF alpha-receptor signaling is required for lung growth and the formation of alveoli but not for early lung branching morphogenesis. Dev Dyn. 2002;223(1):155–162. doi: 10.1002/dvdy.1225. [DOI] [PubMed] [Google Scholar]
- Bostrom H, Willetts K, Pekny M, Leveen P, Lindahl P, Hedstrand H, Pekna M, Hellstrom M, GebreMedhin S, Schalling M, Nilsson M, Kurland S, Tornell J, Heath JK, Betsholtz C. PDGF-A signaling is a critical event in lung alveolar myofibroblast development and alveogenesis. Cell. 1996;85(6):863–873. doi: 10.1016/s0092-8674(00)81270-2. [DOI] [PubMed] [Google Scholar]
- Brain JD. Mechanisms, measurement, and significance of lung macrophage function. Environ Health Perspect. 1992;97:5–10. doi: 10.1289/ehp.92975. [DOI] [PMC free article] [PubMed] [Google Scholar]
- Bremer JL. The fate of the remaining lung tissue after lobectomy or pneumonectomy. JThoracSurg. 1936;6:336–343. [Google Scholar]
- Brown KRS, England KM, Goss KL, Snyder JM, Acarregui MJ. VEGF induces airway epithelial cell proliferation in human fetal lung in vitro. Am J Physiol-Lung Cell Mol Physiol. 2001;281(4):L1001–L1010. doi: 10.1152/ajplung.2001.281.4.L1001. [DOI] [PubMed] [Google Scholar]
- Bunster E, Meyer RK. An improved method of parabiosis. Anat Rec. 1933;57:339–343. [Google Scholar]
- Burri PH. The postnatal growth of the rat lung. 3. Morphology. Anat Rec. 1974;180(1):77–98. doi: 10.1002/ar.1091800109. [DOI] [PubMed] [Google Scholar]
- Burri PH. Structural aspects of postnatal lung development - Alveolar formation and growth. Biol Neonate. 2006;89:313–322. doi: 10.1159/000092868. [DOI] [PubMed] [Google Scholar]
- Cakarova L, Marsh LM, Wilhelm J, Mayer K, Grimminger F, Seeger W, Lohmeyer J, Herold S. Macrophage Tumor Necrosis Factor-alpha Induces Epithelial Expression of Granulocyte-Macrophage Colony-stimulating Factor Impact on Alveolar Epithelial Repair. Am J Respir Crit Care Med. 2009;180(6):521–532. doi: 10.1164/rccm.200812-1837OC. [DOI] [PubMed] [Google Scholar]
- Chamoto K, Gibney BC, Lee GS, Lin M, Simpson DC, Voswinckel R, Konerding MA, Tsuda A, Mentzer SJ. CD34+ progenitor to endothelial cell transition in post-pneumonectomy angiogenesis. Am J Resp Cell Mol Biol In press. 2011 doi: 10.1165/rcmb.2011-0249OC. [DOI] [PMC free article] [PubMed] [Google Scholar]
- Daley JM, Thomay AA, Connolly MD, Reichner JS, Albina JE. Use of Ly6G-specific monoclonal antibody to deplete neutrophils in mice. J Leukoc Biol. 2008;83(1):64–70. doi: 10.1189/jlb.0407247. [DOI] [PubMed] [Google Scholar]
- Das RM, Thurlbeck WM. Events in the contralateral lung following pneumonectomy in the rabbit. Lung. 1979;156(3):165–172. doi: 10.1007/BF02714007. [DOI] [PubMed] [Google Scholar]
- Ehninger A, Trumpp A. The bone marrow stem cell niche grows up: mesenchymal stem cells and macrophages move in. J Exp Med. 2011;208(3):421–428. doi: 10.1084/jem.20110132. [DOI] [PMC free article] [PubMed] [Google Scholar]
- Fehrenbach H, Voswinickel R, Michl V, Mehling T, Fehrenbach A, Seeger W, Nyengaard JR. Neoalveolarisation contributes to compensatory lung growth following pneumonectomy in mice. Eur Respir J. 2008;31(3):515–522. doi: 10.1183/09031936.00109407. [DOI] [PubMed] [Google Scholar]
- Gibney B, Chamoto K, Lee GS, Simpson DC, Miele L, Tsuda A, Konerding MA, Wagers A, Mentzer SJ. Cross-circulation and cell distribution kinetics in parabiotic mice. J Cell Physiol. 2011a doi: 10.1002/jcp.22796. In press. [DOI] [PMC free article] [PubMed] [Google Scholar]
- Gibney B, Houdek J, Lee GS, Ackermann M, Lin M, Simpson DC, Chamoto K, Konerding MA, Tsuda A, Mentzer SJ. Mechanical evidence of microstructural remodeling in post-pneumonectomy lung growth. American Thoracic Society. 2011b [Google Scholar]
- Denver CO, Gibney B, Lee GS, Houdek J, Lin M, Chamoto K, Konerding MA, Tsuda A, Mentzer SJ. Dynamic determination of oxygenation and lung compliance in murine pneumonectomy. Exp Lung Res. 2011c;37:301–309. doi: 10.3109/01902148.2011.561399. [DOI] [PMC free article] [PubMed] [Google Scholar]
- Godleski JJ, Brain JD. Origin of alveolar macrophages in mouse radiation chimeras. J Exp Med. 1972;136(3):630–643. doi: 10.1084/jem.136.3.630. [DOI] [PMC free article] [PubMed] [Google Scholar]
- Heuer GJ, Dunn GR. Experimental pneumectomy. Bull Johns Hopkins Hosp. 1920;31:31–42. [Google Scholar]
- Hubbard LLN, Ballinger MN, Wilke CA, Moore BB. Comparison of conditioning regimens for alveolar macrophage reconstitution and innate immune function post bone marrow transplant. Exp Lung Res. 2008;34(5):263–275. doi: 10.1080/01902140802022518. [DOI] [PMC free article] [PubMed] [Google Scholar]
- Kakizaki T, Kohno M, Watanabe M, Tajima A, Izumi Y, Miyasho T, Tasaka S, Fukunaga K, Maruyama I, Ishizaka A, Kobayashi K. Exacerbation of Bleomycin-Induced Injury and Fibrosis by Pneumonectomy in the Residual Lung of Mice. J Surg Res. 2009;154(2):336–344. doi: 10.1016/j.jss.2008.06.021. [DOI] [PubMed] [Google Scholar]
- Kendziorski C, Irizarry RA, Chen KS, Haag JD, Gould MN. On the utility of pooling biological samples in microarray experiments. Proc Natl Acad Sci U S A. 2005;102(12):4252–4257. doi: 10.1073/pnas.0500607102. [DOI] [PMC free article] [PubMed] [Google Scholar]
- Kranenburg AR, de Boer WI, Alagappan VKT, Sterk PJ, Sharma HS. Enhanced bronchial expression of vascular endothelial growth factor and receptors (Flk-1 and Flt-1 ) in patients with chronic obstructive pulmonary disease. Thorax. 2005;60(2):106–113. doi: 10.1136/thx.2004.023986. [DOI] [PMC free article] [PubMed] [Google Scholar]
- Lin M, Chamoto K, Gibney B, Lee GS, Collings-Simpson D, Houdek J, Konerding MA, Tsuda A, Mentzer SJ. Angiogenesis gene expression in murine endothelial cells during post-pneumonectomy lung growth. Resp Res. 2011 doi: 10.1186/1465-9921-12-98. In press. [DOI] [PMC free article] [PubMed] [Google Scholar]
- Lindahl P, Karlsson L, Hellstrom M, GebreMedhin S, Willetts K, Heath JK, Betsholtz C. Alveogenesis failure in PDGF-A-deficient mice is coupled to lack of distal spreading of alveolar smooth muscle cell progenitors during lung development. Development. 1997;124(20):3943–3953. doi: 10.1242/dev.124.20.3943. [DOI] [PubMed] [Google Scholar]
- Martin TR, Frevert CW. Innate Immunity in the Lungs. Proc Am Thorac Soc. 2005;2(5):403–411. doi: 10.1513/pats.200508-090JS. [DOI] [PMC free article] [PubMed] [Google Scholar]
- Matute-Bello G, Lee JS, Frevert CW, Liles WC, Sutlief S, Ballman K, Wong V, Selk A, Martin TR. Optimal timing to repopulation of resident alveolar macrophages with donor cells following total body irradiation and bone marrow transplantation in mice. J Immunol Methods. 2004;292(1-2):25–34. doi: 10.1016/j.jim.2004.05.010. [DOI] [PubMed] [Google Scholar]
- Maus UA, Janzen S, Wall G, Srivastava M, Blackwell TS, Christman JW, Seeger W, Welte T, Lohnneyer J. Resident alveolar macrophages are replaced by recruited monocytes in response to endotoxin-induced lung inflammation. Am J Respir Cell Mol Biol. 2006;35(2):227–235. doi: 10.1165/rcmb.2005-0241OC. [DOI] [PubMed] [Google Scholar]
- McBride JT. Lung-volumes after an increase in lung distension in pneumonectomized ferrets. J Appl Physiol. 1989;67(4):1418–1421. doi: 10.1152/jappl.1989.67.4.1418. [DOI] [PubMed] [Google Scholar]
- Murphy J, Summer R, Wilson AA, Kotton DN, Fine A. The prolonged life-span of alveolar macrophages. Am J Respir Cell Mol Biol. 2008;38(4):380–385. doi: 10.1165/rcmb.2007-0224RC. [DOI] [PMC free article] [PubMed] [Google Scholar]
- Perez-Arellano JL, Alcazarmontero MC, Jimenezlopez A. Alveolar macrophage-origin, kinetics and relationship with cells of the alveolo-interstitial region. Allergologia Et Immunopathologia. 1990;18(3):175–183. [PubMed] [Google Scholar]
- Rannels DE. Role of physical forces in compensatory growth of the lung. Am J Physiol Heart Circ Physiol. 1989;257(4):L179–L189. doi: 10.1152/ajplung.1989.257.4.L179. [DOI] [PubMed] [Google Scholar]
- Rannels DE, Stockstill B, Mercer RR, Crapo JD. Cellular-changes in the lungs of adrenalectomized rats following left pneumonectomy. Am J Respir Cell Mol Biol. 1991;5(4):351–362. doi: 10.1165/ajrcmb/5.4.351. [DOI] [PubMed] [Google Scholar]
- Schroeder A, Mueller O, Stocker S, Salowsky R, Leiber M, Gassmann M, Lightfoot S, Menzel W, Granzow M, Ragg T. The RIN: an RNA integrity number for assigning integrity values to RNA measurements. BMC Mol Biol. 2006;7:1–14. doi: 10.1186/1471-2199-7-3. [DOI] [PMC free article] [PubMed] [Google Scholar]
- Sery Z, Keprt E, Obrucnik M. Morphometric analysis of late adaptation of residual lung following pneumonectomy in young and adult rabbits. J Thorac Cardiovasc Surg. 1969;57(4):549–557. [PubMed] [Google Scholar]
- Shankey TV, Rabinovitch PS, Bagwell B, Bauer KD, Duque RE, Hedley DW, Mayall BH, Wheeless L. Guidelines for implementation of clinical DNA cytometry. Cytometry. 1993;14(5):472–477. doi: 10.1002/cyto.990140503. [DOI] [PubMed] [Google Scholar]
- Stolovitzky G, Cecchi G. Efficiency of DNA replication in the polymerase chain reaction. Proc Natl Acad Sci U S A. 1996;93(23):12947–12952. doi: 10.1073/pnas.93.23.12947. [DOI] [PMC free article] [PubMed] [Google Scholar]
- Sunderkotter C, Steinbrink K, Goebeler M, Bhardwaj R, Sorg C. Macrophages and angiogenesis. J Leukoc Biol. 1994;55(3):410–422. doi: 10.1002/jlb.55.3.410. [DOI] [PubMed] [Google Scholar]
- Tarling JD, Lin H, Hsu S. Self-renewal of pulmonary alveolar macrophages -evidence from radiation chimera studies. J Leukoc Biol. 1987;42(5):443–446. [PubMed] [Google Scholar]
- Tatar-Kiss S, Bardocz S, Kertai P. Changes in L-ornithine decarboxylase activity in regenerating lung lobes. FEBS Lett. 1984;175(1):131–134. doi: 10.1016/0014-5793(84)80585-2. [DOI] [PubMed] [Google Scholar]
- Thet LA, Law DJ. Changes in cell number and lung morphology during early postpneumonectomy lung growth. J Appl Physiol. 1984;56(4):975–978. doi: 10.1152/jappl.1984.56.4.975. [DOI] [PubMed] [Google Scholar]
- Wersto RP, Chrest FJ, Leary JF, Morris C, Stetler-Stevenson M, Gabrielson E. Doublet discrimination in DNA cell-cycle analysis. Cytometry. 2001;46(5):296–306. doi: 10.1002/cyto.1171. [DOI] [PubMed] [Google Scholar]
- Ziegler BL, Valtieri M, Porada GA, De Maria R, Muller R, Masella B, Gabbianelli M, Casella I, Pelosi E, Bock T, Zanjani ED, Peschle C. KDR receptor: A key marker defining hematopoietic stem cells. Science. 1999;285(5433):1553–1558. doi: 10.1126/science.285.5433.1553. [DOI] [PubMed] [Google Scholar]


