

Abstract
Dissociated cell cultures of the rodent hippocampus have become a standard model for studying many facets of neural development. The cultures are quite homogeneous and it is relatively easy to express green fluorescent protein (GFP)-tagged proteins by transfection. Studying developmental processes that occur over many hours or days—for example, dendritic branching—involves capturing images of a cell at regular intervals without compromising cell survival. This approach is also useful for studying events of short duration that occur asynchronously across the cell population. For such studies, it is highly desirable to use a computer-controlled microscope with an automated stage, to follow multiple cells at different locations in the culture, moving sequentially from one to the next and capturing an image at each location. A method to correct for focal drift is also required. For long-term imaging, we culture neurons in a medium without phenol red, which is thought to give rise to toxic substances following exposure to light. To label cells with GFP-tagged proteins for long-term imaging, we usually use nucleofection (rather than lipid-mediated transfection); this gives a high transfection efficiency, which makes it easier to find the right cell for imaging. Our protocol for long-term imaging is given here, along with appropriate methods to express GFP-tagged proteins. Examples illustrate how the protocol can be used to image cytoskeletal dynamics during axon specification and to study kinesin motor dynamics in stage 2 neurons (when minor neurites extend).
MATERIALS
It is essential that you consult the appropriate Material Safety Data Sheets and your institution’s Environmental Health and Safety Office for proper handling of equipment and hazardous materials used in this protocol.
Reagents
Buffer to control pH (1 M HEPES buffer or 3-(N-morpholino)propanesulfonic acid [MOPS], pH 7.2 at 37°C)
Ethanol (70%)
Glial cell culture growing in neuronal culture medium (phenol red free)
Minimal Essential Medium with 10% horse serum
Neuronal cells, freshly dissociated (see Step 29 in Kaech and Banker 2006)
Neuronal culture medium, phenol red free (see Kaech and Banker 2006)
Plasmids for expressing fluorescent protein-tagged proteins
Nucleofector kit (Lonza Cologne)
Silicon grease
Equipment
Centrifuge
Centrifuge tubes, conical, 15-mL, clear plastic
Coverslips
Fine forceps, sterilized
Imaging chamber with temperature control (for details, see General Considerations for Live Imaging of Developing Hippocampal Neurons in Culture [Kaech et al. 2012a])
Microcentrifuge tubes
Nucleofector device (Lonza Cologne)
METHOD
Methods for establishing hippocampal cultures—including preparation of coverslips, generation of glial cultures, and hippocampal dissection and dissociation of neurons from embryonic tissue—are described in detail in a recent protocol (Kaech and Banker 2006) available for download on our website (http://www.ohsu.edu/xd/research/centers-institutes/neurology/jungers-center/research/banker-lab.cfm). General information is also available in General Considerations for Live Imaging of Developing Hippocampal Neurons in Culture (Kaech et al. 2012a).
Labeling of Cells by Nucleofection
Freshly dissociated neurons (Step 29 in Kaech and Banker 2006) are transfected by nucleofection before plating onto polylysine-treated glass coverslips.
-
1
For each individual plasmid or plasmid combination to be transfected, add 400,000–500,000 neurons to 2 mL of Minimal Essential Medium with 10% horse serum in a 15-mL conical centrifuge tube.
-
2
Collect the cells at the bottom of the tube by centrifugation at 120g for 10 min at room temperature.
-
3
During centrifugation, transfer the plasmid DNA to the bottom of a microcentrifuge tube. This aliquot should contain a total of 0.5–2 μg of plasmid DNA (either a single plasmid or a mix) in a total volume of ≤10 μL.
-
4
Carefully aspirate the medium from the centrifuged cells, down to the barely visible pellet at the bottom of the 15-mL conical tube, leaving as little medium as possible, but be careful that the cells do not dry.
-
5
Using a micropipettor, gently resuspend the cell pellet in 100 μL of nucleofection solution (warmed to room temperature and supplemented per the manufacturer’s suggestion), and transfer the cell suspension to the microcentrifuge tube containing the plasmid DNA (from Step 3).
-
6
Transfer cells and DNA mixture to a cuvette supplied in the Nucleofector kit, and treat the neurons using the setting recommended by the manufacturer.
-
7
Promptly remove the cuvette from the nucleofector device, and add 0.5 mL of neuronal plating medium.
-
8
Using the narrow-bore transfer pipette supplied by the manufacturer, transfer the desired number of cells from the cuvette to the culture dish. In experiments requiring a low percentage of transfected cells, plate additional untransfected cells to achieve the desired cell density. (As always, avoid bubbles when pipetting cells.)
-
9
Return the dish to the incubator. Allow 4 h for the neurons to attach to the glass coverslips, and then transfer them to a dish containing a glial culture growing in neuronal culture medium (phenol red free).
Mounting Coverslips for Imaging
When the hippocampal cultures have reached the desired developmental stage, select the culture you plan to use for imaging. To help improve pH control, we often add additional buffer to the dish before mounting coverslips in the imaging chamber.
-
10
Add a sufficient volume of 1 M HEPES buffer or MOPS buffer (pH 7.2 at 37°C) to bring the final concentration in the medium to 10 mRM, and then return the dish to the incubator to equilibrate the pH.
-
11
Turn on the microscope, and turn on the objective heater.
-
12
Sterilize all areas of the imaging chamber that come in contact with the medium by rinsing in 70% ethanol, then air dry in a laminar flow hood.
-
13
Thoroughly grease the Teflon ring, and arrange the chamber components so they can be assembled rapidly.
-
14
Retrieve the culture dish with neurons from the incubator, remove a coverslip with growing neurons, and place it in the chamber. Add the Teflon ring, and fill the well with a little medium from the dish, top it with a clean coverslip, and seal the chamber. Be certain not to trap any air bubbles in the chamber—the trapped air will equilibrate with the medium and will alter the pH.
It is crucial to work as quickly as possible because, until the chamber is sealed together, CO2 dissolved in the medium will escape into the air, allowing the pH to become more basic. About 30 sec is all the time you have, so this manipulation takes a little practice. -
15
Place the chamber on the microscope stage, and turn on the temperature control to begin heating the chamber.
Image Acquisition
-
16
Scan the coverslip for fluorescent cells, and use the image acquisition software to record the position of cells you may want to image.
-
17
Revisit each of the cells you marked, and choose the ones you plan to image. If using software-based autofocusing, set the region of interest that will be used to determine focus.
We typically pick at least five cells. Because you will invest a lot of time in image acquisition and analysis, it makes sense to be very choosy at this stage. Pick healthy cells, and make sure that there are no nearby cells likely to grow into the chosen field of view. If possible, choose cells clustered near the center of the field; stage movement is more reproducible over short runs, and choosing cells too close to the edge of the field can lead to contact between the objective and the chamber edges. -
18
Pick one transfected cell that you do not plan to image, and use it to estimate the maximum acceptable illumination intensity. Increase the intensity until there is a small but noticeable drop in fluorescence in a stream of consecutive images, and then reduce intensity by at least one-third. In our experience, cells survive repeated imaging at these illumination levels.
-
19
Close down the field diaphragms both in the transmitted and the fluorescence illumination light path so that only the field of view captured by the camera is exposed to light.
-
20
Set individual image parameters for each cell.
-
21
Set time-lapse parameters, and begin the recording. Acquisition rate will depend on the experiment.
See Troubleshooting.
TROUBLESHOOTING
Problem (Step 21)
Cells begin to show signs of degeneration during long-term imaging.
Solution
In general, there are two possibilities to consider: The conditions for maintaining cultures on the microscope stage are suboptimal, or cells are being damaged by light exposure during imaging. These possibilities are easy to distinguish. If exposure to light is the culprit, only cells in the fields that were imaged will be damaged; cells in adjoining fields will be unaffected.
Optimize conditions for maintaining the culture while imaging. If all cells in the chamber are affected, it means that the environment on the microscope stage does not adequately mimic the conditions in the incubator. Inadequate pH control is the most common problem. Neurons are very sensitive to pH >7.5, and air bubbles or a poor seal could cause this. Test your mounting technique and chamber setup in a mock experiment using medium that contains phenol red to convince yourself that the pH does not increase over time. Verify the temperature of the imaging chamber on the microscope using a small probe thermometer.
Reduce light exposure. Decrease the intensity of illumination during image acquisition in the transmitted and epifluorescent light train, and compensate by increasing the duration of the exposure. In general, phototoxicity is reduced by exposing cells to less intense light for a longer period of time. If using autofocus software, perform the autofocus routine using phase-contrast illumination, then switch to epifluorescence illumination to acquire the image. Increase the time interval between images. Consider using a spinning-disk confocal microscope, which reduces photobleaching and photodamage (see the section on Microscope Configuration and Automation in the article General Considerations for Live Imaging of Developing Hippocampal Neurons in Culture [Kaech et al. 2012a]).
Problem (Step 21)
The fluorescence signal bleaches over time.
Solution
Consider methods to reduce the intensity of illumination, as described in Solution 2 for the preceding problem.
DISCUSSION
Example 1: Axonal Specification
Long-term time-lapse imaging was used to capture the transition of neurons from stage 2, when minor neurites extend, to stage 3, when one neurite becomes distinctly longer than the rest and eventually acquires axonal characteristics (Fig. 1). Although it takes only an hour or so for the axon to grow significantly longer than the other neurites (Fig. 1B, C), this event occurs asynchronously across the population of cells during the first 48 h of culture so that long-term recording is required. Using an automated microscope allows many cells to be followed, which greatly increases the usable data that can be obtained.
FIGURE 1.
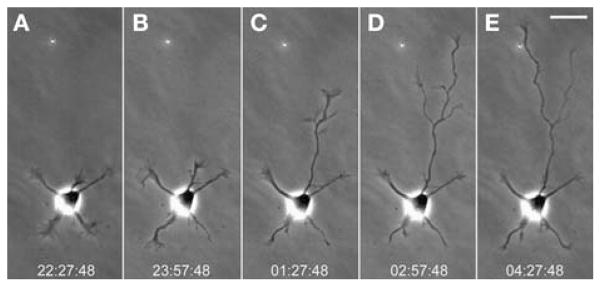
Long-term imaging of a neuron during axonal specification. These frames were taken from a time-lapse recording in which images were acquired at 10-min intervals over a period of 13 h (see Movie 1 at http://cshprotocols.cshlp.org). A fully automated wide-field microscope was used together with software-based autofocusing. During stage 2 (A, B), minor neurites extended and retracted but showed little net growth. In the next interval (C), one neurite became longer than the rest; at this point in development, the identity of the axon is certain. In the final two intervals (D, E), the axon extended still farther and gave off a collateral branch. The branch became dominant and extended quickly while the initial process stalled. Time stamps show h:min:sec. Scale bar, 25 μm.
Example 2: Kinesin Motor Dynamics in Stage 2 Neurons
To explain the symmetry-breaking process that underlies the transition from stage 2 (unpolarized) to stage 3 (polarized), current models suggest that signaling proteins become preferentially concentrated in some neurites but not in others, permitting differential growth. In culture, which neurite becomes the axon is thought to occur stochastically, whereas in vivo it is thought to be controlled by extracellular cues. To determine whether kinesin-mediated transport could selectively deliver cargoes to some neurites but not to others, constitutively active kinesins were expressed during stage 2. The accumulation of constitutively active kinesins at the tip of a neurite is thought to indicate where that kinesin normally transports its cargo. As seen in Figure 2, this constitutively active kinesin first accumulated in one neurite, then accumulated in another. Such studies reveal dynamic changes in kinesin transport that cannot be appreciated from analysis of fixed cells. Once the axon becomes specified, this dynamic pattern stabilizes and kinesins translocate selectively to the axons (Jacobson et al. 2006).
FIGURE 2.
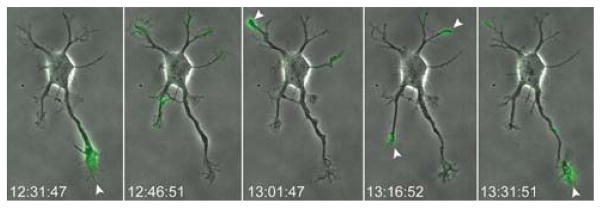
Rapid changes in the localization of a constitutively active kinesin during stage 2. The accumulation of constitutively active kinesin at the tip of a neurite is a measure of the efficiency with which it translocates along the microtubules in that neurite. This kinesin accumulated first in one neurite, then in another. This observation suggests that the biochemical properties of the microtubules, which regulate kinesin transport, differ in different neurites and change rapidly over time. This construct (KIF171–511-GFP), which includes the motor domain but lacks the autoinhibitory domain, was expressed by nucleofection before plating. One day later, its localization was imaged at 15-min intervals, then was overlaid on the corresponding phase-contrast images, which show the cell’s growth. The entire sequence is shown in Movie 2. (See Movie 2 at http://cshprotocols.cshlp.org.)
RELATED INFORMATION
If one wants to capture rapid subcellular events at high resolution, rather than studying events which require long-term time-lapse imaging, one must maximize signal and reduce noise. See Short-Term High-Resolution Imaging of Developing Hippocampal Neurons in Culture (Kaech et al. 2012b).
Acknowledgments
Research in our laboratory is supported by National Institutes of Health Grants MH66179 and NS17112. The Advanced Light Microscopy Core is supported in part by P30 Center Grant NS061800.
References
- Jacobson C, Schnapp B, Banker GA. A change in the selective translocation of the Kinesin-1 motor domain marks the initial specification of the axon. Neuron. 2006;49:797–804. doi: 10.1016/j.neuron.2006.02.005. [DOI] [PubMed] [Google Scholar]
- Kaech S, Banker G. Culturing hippocampal neurons. Nat Protoc. 2006;1:2406–2415. doi: 10.1038/nprot.2006.356. [DOI] [PubMed] [Google Scholar]
- Kaech S, Huang C-F, Banker G. General considerations for live imaging of developing hippocampal neurons in culture. Cold Spring Harb Protoc. 2012a doi: 10.1101/pdb.ip068221. [DOI] [PMC free article] [PubMed] [Google Scholar]
- Kaech S, Huang C-F, Banker G. Short-term high-resolution imaging of developing hippocampal neurons in culture. Cold Spring Harb Protoc. 2012b doi: 10.1101/pdb.prot068247. [DOI] [PMC free article] [PubMed] [Google Scholar]