

Abstract
Dental implants are one of the most frequently used treatment options for tooth replacement. Approximately 30% of patients with dental implants develop peri-implantitis, which is an oral inflammatory disease that leads to loss of the supporting tissues, predominately the bone. For the development of future therapeutic strategies, it is essential to understand the molecular pathophysiology of human dental peri-implant infections. Here, we describe the gene and protein expression patterns of peri-implantitis bone tissue compared with healthy peri-implant bone tissue. Furthermore, cells from the osteoblastic lineage derived from peri-implantitis samples were immortalized and characterized. We applied microarray, quantitative reverse transcription polymerase chain reaction, fluorescence-activated cell sorting, and Western blot analyses. The levels of typical bone matrix molecules, including SPP1, BGLAP, and COL9A1, in patients with peri-implantitis were reduced, while the inflammation marker interleukin 8 (IL8) was highly expressed. RUNX2, one of the transcription factors of mature osteoblasts, was also decreased in peri-implantitis. Finally, the human telomerase reverse transcriptase immortalized cell line from peri-implantitis exhibited a more fibro-osteoblastic character than did the healthy control.
Keywords: bone matrix degradation, RUNX2, BMP2, micro array, dental implants, IL8
For the long-term stability of dental implants, implants need to be osseointegrated into the alveolar bone (Brånemark et al. 1969). Osteoblasts both synthesize the organic matrix of bone tissue (Dudley and Spiro 1961), which is rich in collagen type I, osteocalcin, and alkaline phosphatase (Long 2012), and control the mineralization process. During the physiological turnover of the bone extracellular matrix (ECM), some osteoblasts are predetermined to become osteocytes (Bonewald 2011), which are embedded in the calcifying ECM by adjacent osteoblasts (Palumbo et al. 1990). In general, osteocytes are important regulators of bone remodeling in response to mechanical stress, for example, by occlusal load of the implant, and in response to hormonal signals (Long 2012). The cellular metabolism of bone is controlled via hormones—that is, thyroid hormone (Long 2012) and transcription factors, for example, SOX9 (Akiyama et al. 2005), RUNX2 (Kronenberg 2004), and OSX (Nakashima et al. 2002), as well as different signaling pathways via bone morphogenetic proteins (BMPs) (Rosen and Thies 1992), Hedgehog (St-Jacques et al. 1999), Notch (Hilton et al. 2008), Wnt, and fibroblast growth factor (FGF) (Long 2012). The complexity of this specialized tissue is also reflected in the large number of diseases affecting it (Karsenty and Ferron 2012).
Therefore, the clinical long-term survival of an osseointegrated implant depends on both systemic and local factors, including implant materials, surface structure, bone quality, mechanical loading, and several systemic diseases, as well as the adherence of bacterial biofilms, which in turn leads to peri-implant infections such as peri-implant mucositis and peri-implantitis (Esposito et al. 1998). Peri-implantitis has been found to be a key factor responsible for implant failure (Berglundh et al. 2002), and approximately 30% of patients with dental implants develop peri-implantitis (Berglundh et al. 2002; Roos-Jansaker et al. 2006; Mombelli et al. 2012). Peri-implantitis is an oral inflammatory disease that affects the surrounding tissue of the implant, predominately the bone. The adhesion of pathogenic biofilms on the implant surface and peri-implant tissues results in bone loss and destruction of soft tissues (Scarano et al. 2004). There are possible lead bacteria of peri-implantitis, such as Porphyromonas gingivalis, Prevotella intermedia, and Aggregatibacter actinomycetemcomitans, which are associated with biofilm formation on dental implants (Leonhardt et al. 1999). The immune system responds to the bacterial infection by mobilizing neutrophils, macrophages, T cells, and B cells, which then migrate into the lesion (Belibasakis 2014). During the pathogenesis of peri-implantitis, the loss of alveolar bone leads to instability and, finally, to loss of the implant (Lang et al. 2011).
A high number of treatment options for peri-implantitis have been described in the literature. They are mainly focused on removal of the biofilm from the implant surface and have been adopted from various treatment strategies for periodontitis, the infection of the natural tooth attachment. These treatments include the application of systemic antibiotics, mechanical debridement with or without systemic antibiotic treatment (Renvert et al. 2008), mechanical debridement with or without localized drug delivery and chlorhexidine oral rinses (Rosenberg et al. 1991), mechanical debridement combined with Er:YAG laser decontamination (Schwarz et al. 2006), surgical debridement, and surgical debridement with guided bone regeneration for the reparation of bone and soft tissue defects (Klinge et al. 2002). Unfortunately, none of these therapeutic strategies has proven to be highly effective against peri-implantitis, and a gold standard for the treatment of peri-implantitis and peri-implant mucositis has yet to be defined.
With the increasing use of dental implants and the remaining lack of effective therapeutic options for peri-implantitis, the molecular pathophysiology of human dental peri-implantitis requires further investigation to open the way for new, effective therapeutic options. Our study presents both in vivo and in vitro analyses to compare tissue samples from peri-implantitis with healthy tissues from dental implants. The results may provide the basis for the development of new and effective treatment options for peri-implantitis, especially for tissue regeneration of alveolar bone.
Materials and Methods
Patient Characteristics and Tissue Sources
The bone tissue of dental implants was taken from 12 patients with peri-implantitis (Table 1). Two healthy implants served as controls; these implants were completely osseointegrated and needed to be extracted after 31 and 28 months of clinical-functional use due to nerve irritations. All patients were white and did not have periodontitis. The patients were members of an implant cohort at the University of Goettingen and in a program of intensified oral hygiene; therefore, bleeding on probing and the Quigley-Hein plaque index were negative (for further details, see Table 1).
Table 1.
Patients and Implant Characteristics.
| Patient | Sex | Age, y | Smoker | Internal Diseases | Time of Clinical Use, mo | Implant Characteristics |
|---|---|---|---|---|---|---|
| 1 | F | 46 | − | − | 43 | Sand-blasted and acid-etched, rough |
| 2 | F | 49 | − | Diabetes mellitus | 79 | Particle-blasted and acid-etched, rough |
| 3 | F | 51 | − | − | 60 | Sand-blasted and high-temperature acid-etched, rough |
| 4 | F | 46 | + | − | 31 | Grit-blasted, rough |
| 5 | F | 60 | − | Crohn disease | 96 | Plasma electrolytic oxidation, rough |
| 6 | F | 73 | − | Osteoporosis, hypertension | 54 | Sand-blasted and acid-etched, rough |
| 7 | M | 50 | + | − | 37 | Sand-blasted and high-temperature acid-etched, rough |
| 8 | M | 53 | − | − | 75 | Particle-blasted and acid-etched, rough |
| 9 | M | 71 | − | Diabetes mellitus, hypertension | 61 | Sand-blasted and high-temperature acid-etched, rough |
| 10 | M | 65 | − | − | 58 | Grit-blasted and chemical (fluoride) treatment, rough |
| 11 | M | 40 | + | − | 65 | Sand-blasted and acid-etched, rough |
| 12 | M | 52 | − | Diabetes mellitus | 50 | Plasma electrolytic oxidation, rough |
| 13a | F | 47 | − | − | 28 | Particle-blasted and acid-etched, rough |
| 14a | F | 55 | − | − | 31 | Sand-blasted and acid-etched, rough |
F, female; M, male.
Healthy control samples.
Healthy bone cells of the osteoblastic lineage were derived from one of the patients from whom the implant needed to be removed due to nerve irritation. All patients gave their written informed consent according to the ethics regulations of the University of Goettingen (file number: 22/1/05).
Cell Isolation and Culture
Standard explant cultures were performed for 3 peri-implantitis bone tissues and 1 from an healthy implant. After extraction, the bone tissue sticking to the osseointegrated part of the totally removed implant was scaled off, but it was always ensured that no soft tissues (e.g., gingiva or granuloma tissues) were included. The specimens were washed carefully, 3 times for 1 min with Braunol (cat. 3864219; BBraun, Melsungen, Germany) and finally 3 times for 1 min with phosphate-buffered saline (PBS). After the washing process, each of the bone tissue samples from the dental implants were added to a cell culture dish with Dulbecco’s modified Eagle’s medium (DMEM) (cat. 21885-025; Invitrogen, Darmstadt, Germany) with 10% fetal bovine serum (cat. 10270; Invitrogen) supplemented with 50 µg/mL gentamycin and 10 mM L-glutamine. After 10 d, outgrown cells were harvested, and 103 cells/cm2 were transferred to a 75-cm2 flask (cat. 83.1811.002; Sarstedt, Sarstedt, Germany).
Immortalization of Peri-Implant Cells
Virus production
We seeded 5 × 10⁵ 293T-cells (cat. ACC635; DSMZ, Braunschweig, Germany) into a dish (∅ = 10 cm) and grew them to 80% confluence. On the next day, 10 µg lenti-plasmid-DNA (hTERT) (amsbio, El Toro, CA, USA) and 10 µg packing-plasmid mix (cat. LV053; abm, Richmond, Canada) were mixed together with 1 mL DMEM. Then, 80 µL lentifectin (cat. G074; abm) was mixed with 1 mL DMEM. Both solutions were incubated for 5 min at room temperature (RT), after which they were mixed together to allow for the formation of the transfection complex. After 20 min, 4.5 mL DMEM was added to the transfection complex. The transfection complex mixture was pipetted onto the peri-implant cells, and after 6 h, 0.65 mL heat-inactivated fetal calf serum (FCS) was added. The next day, the medium was carefully removed from the cells, and 10 mL DMEM + 10% heat-inactivated FCS + 1% bovine serum albumin (BSA) fraction V (BL63-0500; Equitech-Bio, Kerrville, TX, USA) was added. After 24 h, the cells had produced enough of the virus; the supernatant was then harvested, centrifuged, and filtered (cat. SLHA033SB; Merck Millipore, Billerica, MA, USA).
Transfection
Freshly trypsinized cells (1.8 × 10⁵) from the inflamed peri-implant tissues were resuspended in 3 mL of the virus supernatant and 30 µL protaminsulfat (cat. P3369; Sigma-Aldrich, St. Louis, MO, USA). In a 24-well plate, 3 wells were each filled with 1 mL of the above solution. After 6 h, an additional 1 mL of medium was added to each well. The next day, the medium and any dead cells were removed, and the adhered cells received a second treatment of 1 mL virus supernatant together with 10 µl protaminsulfat per well overnight.
Selection
The infected cells were transferred to a 75-cm2 flask and selected with up to 10 µg/mL blasticidin.
RNA Extraction and Complementary DNA Synthesis
Bone tissue scraped off the implants was frozen in liquid nitrogen and crushed with a pestle to a fine powder. Afterward, the powder was dissolved in 1 mL peqGOLD TriFast (cat. 30-2020; Peqlab, Erlangen, Germany) and homogenized with an ULTRA-TURRAX (cat. 2578800; IKA, Staufen, Germany). Next, 0.2 mL chloroform was added, and the mixture was centrifuged. After separation of the phases, the upper one containing the RNA was washed with chloroform/isoamyl alcohol (24:1). Following another centrifugation step, 100 µL RNA was mixed with 350 µL RLT buffer and 10% β-mercaptoethanol. Then, an equal volume of 70% ethanol was added, mixed briefly, transferred to a mini-column from the RNeasy Mini Kit (cat. 74104; Qiagen, Chatsworth, CA, USA), and processed according to the manufacturer’s instructions. In contrast, cells were directly dissolved in RLT buffer, and RNA was isolated according to the standard protocols. RNA was reverse-transcribed into complementary DNA (cDNA) using the Qiagen QuantiTect Reverse Transcription Kit (cat. 205311; Qiagen).
Microarray Analysis and Bioinformatics
Quality control and quantification of the total RNA samples were performed prior to the microarray experiments (Agilent 2100 Bioanalyzer; Agilent Technologies, Palo Alto, CA, USA). We used equal amounts of total RNA from each of the patients. The microarray analysis was conducted at the university transcriptome facility using an Affymetrix whole-human genome chip (Affymetrix, Santa Clara, CA, USA). The microarray experiments were performed with 6 samples from patients with peri-implantitis, as well as with 2 samples from healthy implants according to the manufacturer’s protocols. A complete list of the genes present on the chip can be found at http://www.affymetrix.com/analysis/index.affx. The data were analyzed using Affymetrix Microarray Suite 5.0. Gene expression was evaluated using Affymetrix Data Mining Tool 3.0. First, the data were curated, primarily from nonzero flag values that indicated absent or poor-quality spots. Next, quantile normalization and logarithmizing followed. A Pearson correlation-based hierarchical clustering approach, including row scaling and Ward’s minimum variance method, was chosen. A differential expression analysis with an empirical Bayes statistic of the limma package, moderated gene-by-gene t tests, and P value adjustments via the Benjamini-Hochberg method were then performed. The entire data set is published in a MIAME-compliant format in the GEO database, with the accession number GSE57631 (http://www.ncbi.nlm.nih.gov/geo/).
Quantitative Polymerase Chain Reaction
Primers were designed with the help of primer3. For the primer sequences, see Table 2. The master mix (cat. 11730-025; Invitrogen) and the polymerase chain reaction (PCR) program were applied as described in the manufacturer’s instructions and run in the Mastercycler Realplex2 S (cat. 950021209; Eppendorf, Hamburg, Germany). The relative ratios were calculated according to Pfaffl (2001). Gels were prepared when necessary by dissolving 1.5% agarose in 50 mL of TE buffer. Then, 3.5 µL Roti-GelStain (cat. 3865.1; Carl Roth, Karlsruhe, Germany) was added to visualize DNA. The PCR product size was detected using a GeneRuler 100-bp DNA Ladder (cat. SM0241; Thermo Scientific, Marietta, GA, USA).
Table 2.
Primer Sequences.
| Gene ID | Primer Forward | Primer Reverse | Accession No. |
|---|---|---|---|
| SPP1 | agacctgacatccagtaccctg | gtgggtttcagcactctggt | NM_001040058.1 |
| BGLAP | acactcctcgccctattg | gatgtggtcagccaactc | NM_199173.4 |
| COL9A1 | gtgttgctggtgaaaagggt | gggatcccactcctaat | NM_001851.4 |
| IL8 | tctggaccccaaggaaaac | tctggaccccaaggaaaac | NM_0000584 |
| FGF18 | aacaaactccccctaactttcc | agtcacggaaggtcgatagc | NM_001040058.1 |
| BMP2 | gacaccctttgtacgtggactt | aaccttttcattctcgtcaagg | NM_001851.4 |
| RUNX2 | ttccagaccagcagcactc | cagcgtcaacaccatcatt | NM_004348 |
| B2M | tgctgtctccatgtttgatgtatct | tctctgctccccacctctaa | NM_004048 |
Antibodies
Antibody immunoreactions were performed with the primary antibodies listed in Table 3, and control reactions were carried out with swine serum instead of the primary antibody. All data shown are representatives of 3 individual experiments.
Table 3.
Antibodies.
| Antigene | Clonality | Host | Source |
|---|---|---|---|
| RUNX2 | Monoclonal | Mouse | Santa Cruz Biotechnology, Dallas, TX, cat. sc-101145 |
| SOX9 | Polyclonal | Rabbit | Acris, San Diego, CA, cat. AP06583PU-N |
| COL1A1 | Monoclonal | Mouse | DSHB, Iowa City, IA, cat. M-38 |
| SPP1 | Monoclonal | Mouse | DSHB, Iowa City, IA, cat. MPIIIB10(1) |
| SPARC | Monoclonal | Mouse | DSHB, Iowa City, IA, cat. AON-1 |
| Stro-1 | Monoclonal | Mouse | DSHB, Iowa City, IA, cat. Stroh-1 |
| Fibrocyte-derived protein | Monoclonal | Mouse | AbD Serotec, Oxford, UK, cat. MCA1399G |
| α-Tubulin | Monoclonal | Mouse | Sigma-Aldrich, St. Louis, MO, cat. T6199 |
| mouse-IgG, peroxidase-conjugated | Polyclonal | Goat | Sigma-Aldrich, St. Louis, MO, cat. A9917 |
| Mouse-IgG, FITC-conjugated | Polyclonal | Goat | KPL, Gaithersburg, MD, cat. 02-18-09 |
| Rabbit-IgG, FITC-conjugated | Polyclonal | Goat | KPL, Gaithersburg, MD, cat. 172-1506 |
| Mouse-IgG2a, Isotype control, FITC-conjugated | Monoclonal | Mouse | BD Biosciences, San Jose, CA, cat. 554647 |
Immunoblotting
To prepare the samples, we dissolved 1.5 × 10⁵ cells in 30 µL 3× sodium dodecyl sulfate (SDS) with 10% β-mercaptoethanol and heated them at 95 °C for 5 min. SDS–polyacrylamide gel electrophoresis (PAGE) was then performed, with 6% acrylamide in the stacking gel and 8% in the separation gel. After SDS-PAGE, the separated proteins were blotted on an Immobilon-P Transfer Membrane (cat. PVH07850; Merck Millipore). General detection of the proteins was performed with Coomassie blue staining. After destaining, the membrane was blocked with 5% milk in TRIS-buffered saline with TWEEN (TBS-T) for 1 h, followed by 5 washing steps with TBS-T. Then, the primary antibodies were dissolved in 5% milk in TBS-T, according to the dilution instructions provided by the manufacturer, and incubated for 12 h at 4 °C. Again, 5 washing steps were performed. Then, secondary antibodies were incubated for 2 h at room temperature, followed by 5 washing steps. Proteins were visualized by applying WesternBright Sirius HRP substrate (cat. K-12043-D10; Advansta, Menlo Park, CA, USA). To control the immunoreactions of the Western blotting, we incubated membranes with the secondary antibody only.
Fluorescence-Activated Cell Sorting Analysis
Always 106 cells were suspended in 100 µL of PBS containing 1 µL of the primary antibodies and incubated at RT for 1 h in the dark. The cells were then washed twice and centrifuged at 800 rpm for 10 min, and the respective fluorescence-coupled antibody was incubated for 30 min at RT. After thorough washing steps, the cells were subjected to fluorescence-activated cell sorting (FACS) analysis using a FACScan machine (cat. 343524; Becton Dickinson, Mountain View, CA, USA), and 105 living cells were analyzed. For gating and normalization, FITC mouse isotype antibodies were applied as controls. For data evaluation, we used the WinMDlv2.9 program (Scripps Research Institute, La Jolla, CA, USA). The FACS Vantage SE (cat. 343554; Becton Dickinson) was applied, and the Cell Quest Pro 2000 software package was used for analysis.
Results
In Vivo Gene Expression Analysis of Healthy and Peri-Implantitis Bone Tissue from Dental Implants
To investigate the overall changes in gene expression between these 2 tissues, we performed a microarray analysis. We show tissue samples from 5 patients with peri-implantitis and 2 healthy samples without any signs of peri-implantitis. Heat map clustering clearly separates the gene expression of healthy and peri-implantitis bone tissues into 2 groups (Fig. 1A). The sixth patient did not show this clear-cut patterning (data not shown). As expected, matrix metalloproteinases (MMPs) such as MMP7 and MMP8 were upregulated in peri-implantitis, while BMPs such as BMP7 were downregulated. Interestingly, the expression levels of BMP2, which is important for the regenerative capacity of bone (Rosen 2009), were slightly enhanced in peri-implantitis. The osteogenic factor RUNX2 was decreased, which is in line with the degeneration process of the bone. Again, as expected, the inflammatory marker interleukin 8 (IL8) was upregulated, while the anti-inflammatory molecule PPARγ was downregulated in peri-implantitis. The entire data set is published in a MIAME-compliant format in the GEO database, with the accession number GSE57631 (http://www.ncbi.nlm.nih.gov/geo/).
Figure 1.

The gene expression of peri-implantitis tissue in vivo. (A) Heat map of the microarray results shows a clear clustering of genes (upregulated in yellow and downregulated in blue). (B) A selection of log-fold change ratios is shown for some relevant genes. Note that most of the osteogenic genes are downregulated, while interleukin 8 (IL8), an inflammation marker, is upregulated. (C–I) quantitative reverse transcription polymerase chain reaction verification experiments showed downregulation of SPP1 (C), BGLAP (D), COL9A1 (E), FGF18 (G), and RUNX2 (I) in inflamed peri-implantitis tissues. BMP2 (H) is upregulated, as is the inflammation marker IL8 (F). Asterisks = significant differences (P = 0.05).
A selection of relevant genes is listed for ECM molecules, cytokines, and transcription factors (Fig. 1B). A list of the most significantly regulated genes is found in Appendix Table 1. Typical ECM proteins of the bone, such as SPP1 (P = 0.55), BGLAP (P = 0.12), COL9A1 (P = 0.23), BMP2 (P = 0.89), and RUNX2 (P = 0.03), were downregulated. FGF18 (P = 0.22), known to play a role in bone development and diseases (Su et al. 2008), was reduced in peri-implantitis compared with the control. As expected, IL8 was upregulated (P = 0.22). To verify a few of the gene expression results from the microarray, we performed quantitative reverse transcription polymerase chain reaction (RT-qPCR) experiments with the same patient samples. The expression patterns of the results of RT-qPCR largely mirrored the microarray results, but here all results were statistically significant with P values smaller than 0.05. SPP1 (Fig. 1C), BGLAP (Fig. 1D), and COL9A1 (Fig. 1E) were downregulated in the peri-implantitis tissues compared with the healthy samples, while IL8 (Fig. 1F) was upregulated in the patients with peri-implantitis. The expression of FGF18 (Fig. 1G) was lower, BMP2 (Fig. 1H) was upregulated, and RUNX2 (Fig. 1I) was downregulated in the peri-implantitis tissue samples.
In Vitro Protein Expression Patterns of Cells of the Osteoblastic Lineage Derived from the Bone Tissue of Implants from a Healthy Donor or from Peri-Implantitis Patients
The implants extracted from patients with peri-implantitis exhibited cells that migrated out of the attached bone tissue (Fig. 2A). After the second passage, we immortalized these cells with hTERT. To verify the immortalization, we performed PCR for hTERT. Only the immortalized cells expressed hTERT, while the controls did not (Fig. 2B). After immortalization, we characterized protein levels in these cells with FACS analysis. Most of the cells were positive for bone markers such as RUNX2 (Fig. 2C) and COL1A (Fig. 2D). Interestingly, just 21% were positive for SPP1 (Fig. 2E). Twenty-nine percent were also positive for the stem cell marker STRO-1 (Fig. 2F), and 85% were positive for fibrocyte-derived protein (Fig. 2G). Notably, just a few cells were positive for the premature osteoblast marker SOX9 (Fig. 2H). These results indicate that the immortalized cells of the osteoblastic lineage derived from the patients with peri-implantitis reveal a fibro-osteoblastic character. Therefore, we compared the protein levels of these cells with the ones of a healthy implant. Coomassie blue staining showed the proper separation of the proteins (Fig. 2I). The Western blots showed that peri-implantitis cells expressed lower levels of RUNX2 (Fig. 2J) and equal levels of SPARC (Fig. 2K) and COL1A1 (Fig. 2L) compared with osteoblastic lineage cells of the healthy implant. As a loading control, α-tubulin was used (Fig. 2M).
Figure 2.
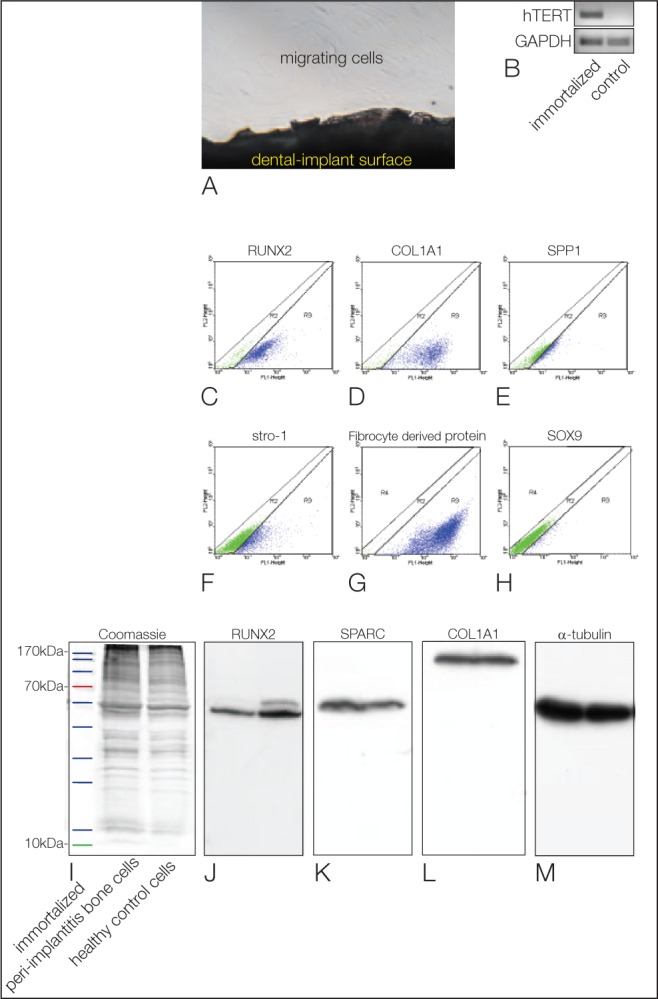
The protein pattern of peri-implantitis cells in vitro. (A) Cells migrating out of the bone tissue attached to an explanted titanium implant. (B) Conventional polymerase chain reaction shows the product for hTERT (first lane) in the immortalized cells only, not in the control cells (second lane). (C–H) Fluorescence-activated cell sorting analysis of the immortalized peri-implantitis cell line. The cells are positive for the osteogenic markers RUNX2 (C), COL1A1 (D), and SPP1 (E), as well as the stem cell marker Stro-1 (F) and a fibroblast marker (G), while only a few cells are positive for SOX9 (H). Western blot analysis corroborated these results (I–M). (I) Equal loading of the gels is shown by Coomassie blue staining. (J–M) The first lanes always depict the peri-implantitis cells, while the second lanes show the results for the control cells from the healthy implant. (J) RUNX2 is downregulated in the peri-implantitis cells. (K) No changes are seen for SPARC. (L) No changes are seen for COL1A1. Equal loading was confirmed by α-tubulin staining (M).
Discussion
Most peri-implantitis studies concerned with the differences between affected and healthy patients focus on microbiological aspects (Heuer et al. 2012) and treatment possibilities (Khoshkam et al. 2013; Heitz-Mayfield and Mombelli 2014). In the present study, we investigated the molecular composition of healthy and peri-implantitis bone tissues with the help of a microarray, as well as qPCR and Western blotting. Typical bone matrix molecules, such as SPP1, BGLAP, and COL9A1, were reduced in the peri-implantitis tissues. Furthermore, our data suggest that the cells derived from the osteointegrated part of the implant extracted due to peri-implantitis exhibit a fibro-osteoblastic phenotype with a reduction of RUNX2 expression and enhanced expression of fibrocyte markers. This indicates that in peri-implantitis, osteointegration is eventually lost due to the ongoing infection of a bone tissue that exhibits already a more scar-like, fibrous characteristic rather than those of proper bone tissue. Fibroblasts have already been identified to participate in the pathogenesis of peri-implantitis by upregulating both vascularity and matrix degradation (Bordin et al. 2009). Furthermore, marginal bone loss in early experimental periodontitis is believed to result in an imbalanced foreign body response (Albrektsson et al. 2013), which is also known to involve the activation of fibroblasts.
It is well known that the upregulation of inflammatory mediators and MMPs in peri-implantitis fibroblasts plays a role in the disease pathogenesis (Irshad et al. 2013). In addition, levels of the anti-inflammatory cytokine IL10 have been found to decrease in peri-implantitis (Casado et al. 2013). These results are mirrored by the increased levels of proinflammatory interleukins, such as IL8 in peri-implantitis detected in this study. We already investigated the molecular profile of PDL fibroblasts from tissue of several patients with periodontitis as well as healthy controls at the messenger RNA (mRNA) level (Gersdorff et al. 2008). Also here, we found that especially ECM molecules and those not primarily involved in inflammatory processes (e.g., collagen types I and IV) were downregulated, as were HSP90 or CD27, while the IL28 receptor was upregulated in the fibroblasts from the periodontitis tissues. Complete results can be found under GEO number GSE27993, and major differences between peri-implantitis and periodontitis tissues are detectable.
In addition, elevated levels of MMP8 and MMP7 have been found in the sulcular fluid of patients with peri-implantitis (Kivelä-Rajamäki et al. 2003) and are believed to be responsible for the destruction of the tissue. Indeed, MMP8 and MMP7 levels were upregulated in the microarray presented here.
On the other hand, proteins such as BMP2 have been shown to enhance bone formation on titanium implants (Schliephake et al. 2012; Schliephake et al. 2008), and BMP2/7 heterodimers have been found to exert osteogenic effects on implant surfaces (Sun et al. 2012). In the peri-implantitis bone tissue investigated here, BMP7 was downregulated, and BMP2 was slightly upregulated. One might speculate that BMP2 takes part in a regeneration attempt in peri-implantitis and is responsible for the bone characteristics of the tissue investigated. PPARγ, an anti-inflammatory molecule, has been shown to inhibit inflammation and promote osteoblast function (Park et al. 2015) and was downregulated in the peri-implantitis tissues investigated in this study.
A clear limitation of the study is the small number of healthy controls (n = 2) in the microarray experiments and obviously the comparison of the results of isolated, cultured cells from the patients for Western blotting and FACS analysis with the results from the microarray and PCR of tissue samples from patients. However, the isolation and immortalization of the peri-implantitis bone tissue allows further investigations and the distribution of these cells among the interested scientists.
In conclusion, the present investigation indicates that, together with the process of inflammation, fibro-osteoblastic cells from the peri-implantitis bone tissues are also responsible for the failure of osteointegration by generating a tissue that is more fibrous and expresses less osteogenic markers.
Author Contributions
B. Schminke, N. Miosge, contributed to conception, design, and data analysis, drafted and critically revised the manuscript; F. vom Orde, R. Gruber, H. Schliephake, R. Bürgers, contributed to data analysis, critically revised the manuscript. All authors gave final approval and agree to be accountable for all aspects of the work.
Acknowledgments
We thank the Transcriptome Facility and Dr. Salinas-Riester of our university for performing the microarray analysis and Dr. Jung from the Department of Medical Statistics.
Footnotes
The study was supported by a grant from the German Society of Implantology (DGI).
Parts were taken from the doctoral thesis of Simon Schmitt.
The authors declare no potential conflicts of interest with respect to the authorship and/or publication of this article.
A supplemental appendix to this article is published electronically only at http://jdr.sagepub.com/supplemental.
References
- Akiyama H, Kim JE, Nakashima K, Balmes G, Iwai N, Deng JM, Zhang Z, Martin JF, Behringer RR, Nakamura T, et al. 2005. Osteo-chondroprogenitor cells are derived from Sox9 expressing precursors. Proc Natl Acad Sci U S A. 102(41):14665–14670. [DOI] [PMC free article] [PubMed] [Google Scholar]
- Albrektsson T, Dahlin C, Jemt T, Sennerby L, Turri A, Wennerberg A. 2013. Is marginal bone loss around oral implants the result of a provoked foreign body reaction? Clin Implant Dent Relat Res. 16(2):155–165. [DOI] [PubMed] [Google Scholar]
- Belibasakis GN. 2014. Microbiological and immuno-pathological aspects of peri-implant diseases. Arch Oral Biol. 59(1):66–72. [DOI] [PubMed] [Google Scholar]
- Berglundh T, Persson L, Klinge B. 2002. A systematic review of the incidence of biological and technical complications in implant dentistry reported in prospective longitudinal studies of at least 5 years. J Clin Periodontol. 29(Suppl 3):197–212; discussion 232–293. [DOI] [PubMed] [Google Scholar]
- Bonewald LF. 2011. The amazing osteocyte. J Bone Miner Res. 26(2):229–238. [DOI] [PMC free article] [PubMed] [Google Scholar]
- Bordin S, Flemmig TF, Verardi S. 2009. Role of fibroblast populations in peri-implantitis. Int J Oral Maxillofac Implants. 24(2):197–204. [PubMed] [Google Scholar]
- Brånemark PI, Adell R, Breine U, Hansson BO, Lindström J, Ohlsson A. 1969. Intra-osseous anchorage of dental prostheses, I: experimental studies. Scand J Plast Reconstr Surg. 3(2):81–100. [DOI] [PubMed] [Google Scholar]
- Casado PL, Canullo L, de Almeida Filardy A, Granjeiro JM, Barboza EP, Leite Duarte ME. 2013. Interleukins 1beta and 10 expressions in the periimplant crevicular fluid from patients with untreated periimplant disease. Implant Dent. 22(2):143–150. [DOI] [PubMed] [Google Scholar]
- Dudley HR, Spiro D. 1961. The fine structure of bone cells. J Biophys Biochem Cytol. 11(3):627–649. [DOI] [PMC free article] [PubMed] [Google Scholar]
- Esposito M, Hirsch JM, Lekholm U, Thomsen P. 1998. Biological factors contributing to failures of osseointegrated oral implants: (II). Etiopathogenesis. Eur J Oral Sci. 106(3):721–764. [DOI] [PubMed] [Google Scholar]
- Gersdorff N, Miro X, Roediger M, Geffers R, Toepfer T, Huels A, Miosge N. 2008. Gene expression analysis of chronically inflamed and healthy human periodontal ligament cells in vivo. Dent Res J. 5(1):5–11. [Google Scholar]
- Heitz-Mayfield LJ, Mombelli A. 2014. The therapy of peri-implantitis: a systematic review. Int J Oral Maxillofac Implants. 29(Suppl):325–345. [DOI] [PubMed] [Google Scholar]
- Heuer W, Kettenring A, Stumpp SN, Eberhard J, Gellermann E, Winkel A, Stiesch M. 2012. Metagenomic analysis of the peri-implant and periodontal microflora in patients with clinical signs of gingivitis or mucositis. Clin Oral Investig. 16(3):843–850. [DOI] [PubMed] [Google Scholar]
- Hilton MJ, Tu X, Wu X, Bai S, Zhao H, Kobayashi T, Kronenberg HM, Teitelbaum SL, Ross FP, Kopan R, et al. 2008. Notch signaling maintains bone marrow mesenchymal progenitors by suppressing osteoblast differentiation. Nat Med. 14(3):306–314. [DOI] [PMC free article] [PubMed] [Google Scholar]
- Irshad M, Scheres N, Anssari Moin D, Crielaard W, Loos BG, Wismeijer D, Laine ML. 2013. Cytokine and matrix metalloproteinase expression in fibroblasts from peri-implantitis lesions in response to viable Porphyromonas gingivalis. J Periodontal Res. 48(5):647–656. [DOI] [PubMed] [Google Scholar]
- Karsenty G, Ferron M. 2012. The contribution of bone to whole-organism physiology. Nature. 481(7381):314–320. [DOI] [PMC free article] [PubMed] [Google Scholar]
- Khoshkam V, Chan HL, Lin GH, MacEachern MP, Monje A, Suarez F, Giannobile WV, Wang HL. 2013. Reconstructive procedures for treating peri-implantitis: a systematic review. J Dent Res. 92(12 Suppl):131S–138S. [DOI] [PMC free article] [PubMed] [Google Scholar]
- Kivelä-Rajamäki M, Maisi P, Srinivas R, Tervahartiala T, Teronen O, Husa V, Salo T, Sorsa T. 2003. Levels and molecular forms of MMP-7 (matrilysin-1) and MMP-8 (collagenase-2) in diseased human peri-implant sulcular fluid. J Periodontal Res. 38(6):583–590. [DOI] [PubMed] [Google Scholar]
- Klinge B, Gustafsson A, Berglundh T. 2002. A systematic review of the effect of anti-infective therapy in the treatment of peri-implantitis. J Clin Periodontol. 29(Suppl 3):213–225; discussion 232–233. [DOI] [PubMed] [Google Scholar]
- Kronenberg HM. 2004. Twist genes regulate Runx2 and bone formation. Dev Cell. 6(3):317–318. [DOI] [PubMed] [Google Scholar]
- Lang NP, Berglundh T; Working Group 4 of Seventh European Workshop on Periodontology. 2011. Periimplant diseases: where are we now? Consensus of the Seventh European Workshop on Periodontology. J Clin Periodontol. 38(Suppl 11):178–181. [DOI] [PubMed] [Google Scholar]
- Leonhardt A, Renvert S, Dahlen G. 1999. Microbial findings at failing implants. Clin Oral Implants Res. 10(5):339–345. [DOI] [PubMed] [Google Scholar]
- Long F. 2012. Building strong bones: molecular regulation of the osteoblast lineage. Nat Rev Mol Cell Biol. 13(1):27–38. [DOI] [PubMed] [Google Scholar]
- Mombelli A, Muller N, Cionca N. 2012. The epidemiology of peri-implantitis. Clin Oral Implants Res. 23(Suppl 6):67–76. [DOI] [PubMed] [Google Scholar]
- Nakashima K, Zhou X, Kunkel G, Zhang Z, Deng JM, Behringer RR, de Crombrugghe B. 2002. The novel zinc finger-containing transcription factor osterix is required for osteoblast differentiation and bone formation. Cell. 108(1):17–29. [DOI] [PubMed] [Google Scholar]
- Palumbo C, Palazzini S, Zaffe D, Marotti G. 1990. Osteocyte differentiation in the tibia of newborn rabbit: an ultrastructural study of the formation of cytoplasmic processes. Acta Anat (Basel). 137(4):350–358. [DOI] [PubMed] [Google Scholar]
- Park SY, Kim KH, Gwak EH, Rhee SH, Lee JC, Shin SY, Koo KT, Lee YM, Seol YJ. 2015. Ex vivo bone morphogenetic protein 2 gene delivery using periodontal ligament stem cells for enhanced re-osseointegration in the regenerative treatment of peri-implantitis. J Biomed Mater Res A. 103(1):38–47. [DOI] [PubMed] [Google Scholar]
- Pfaffl MW. 2001. A new mathematical model for relative quantification in real-time RT-PCR. Nucleic Acids Res. 29(9):e45. [DOI] [PMC free article] [PubMed] [Google Scholar]
- Renvert S, Roos-Jansaker AM, Claffey N. 2008. Non-surgical treatment of peri-implant mucositis and peri-implantitis: a literature review. J Clin Periodontol. 35(8 Suppl):305–315. [DOI] [PubMed] [Google Scholar]
- Roos-Jansaker AM, Lindahl C, Renvert H, Renvert S. 2006. Nine- to fourteen-year follow-up of implant treatment: Part II. Presence of peri-implant lesions. J Clin Periodontol. 33(4):290–295. [DOI] [PubMed] [Google Scholar]
- Rosen V. 2009. BMP2 signaling in bone development and repair. Cytokine Growth Factor Rev. 20(5–6):475–480. [DOI] [PubMed] [Google Scholar]
- Rosen V, Thies RS. 1992. The BMP proteins in bone formation and repair. Trends Genet. 8(3):97–102. [DOI] [PubMed] [Google Scholar]
- Rosenberg ES, Torosian JP, Slots J. 1991. Microbial differences in 2 clinically distinct types of failures of osseointegrated implants. Clin Oral Implants Res. 2(3):135–144. [DOI] [PubMed] [Google Scholar]
- Scarano A, Piattelli M, Caputi S, Favero GA, Piattelli A. 2004. Bacterial adhesion on commercially pure titanium and zirconium oxide disks: an in vivo human study. J Periodontol. 75(2):292–296. [DOI] [PubMed] [Google Scholar]
- Schliephake H, Bötel C, Förster A, Schwenzer B, Reichert J, Scharnweber D. 2012. Effect of oligonucleotide mediated immobilization of bone morphogenic proteins on titanium surfaces. Biomaterials. 33(5):1315–1322. [DOI] [PubMed] [Google Scholar]
- Schliephake H, Weich HA, Dullin C, Gruber R, Frahse S. 2008. Mandibular bone repair by implantation of rhBMP-2 in a slow release carrier of polylactic acid—an experimental study in rats. Biomaterials. 29(1):103–110. [DOI] [PubMed] [Google Scholar]
- Schwarz F, Bieling K, Bonsmann M, Latz T, Becker J. 2006. Nonsurgical treatment of moderate and advanced periimplantitis lesions: a controlled clinical study. Clin Oral Investig. 10(4):279–288. [DOI] [PubMed] [Google Scholar]
- St-Jacques B, Hammerschmidt M, McMahon AP. 1999. Indian hedgehog signaling regulates proliferation and differentiation of chondrocytes and is essential for bone formation. Genes Dev. 13(16):2072–2086. [DOI] [PMC free article] [PubMed] [Google Scholar]
- Su N, Du X, Chen L. 2008. FGF signaling: its role in bone development and human skeleton diseases. Front Biosci. 13:2842–2865. [DOI] [PubMed] [Google Scholar]
- Sun P, Wang J, Zheng Y, Fan Y, Gu Z. 2012. BMP2/7 heterodimer is a stronger inducer of bone regeneration in peri-implant bone defects model than BMP2 or BMP7 homodimer. Dent Mater J. 31(2):239–248. [DOI] [PubMed] [Google Scholar]