

Abstract
The ability to deliver uniform light dose in Photodynamic therapy (PDT) is critical to treatment efficacy. Current protocol in pleural photodynamic therapy uses 7 isotropic detectors placed at discrete locations within the pleural cavity to monitor light dose throughout treatment. While effort is made to place the detectors uniformly through the cavity, measurements do not provide an overall uniform measurement of delivered dose. A real-time infrared (IR) tracking camera is development to better deliver and monitor a more uniform light distribution during treatment. It has been shown previously that there is good agreement between fluence calculated using IR tracking data and isotropic detector measurements for direct light phantom experiments. This study presents the results of an extensive phantom study which uses variable, patient-like geometries and optical properties (both absorption and scattering). Position data of the treatment is collected from the IR navigation system while concurrently light distribution measurements are made using the aforementioned isotropic detectors. These measurements are compared to fluence calculations made using data from the IR navigation system to verify our light distribution theory is correct and applicable in patient-like settings. The verification of this treatment planning technique is an important step in bringing real-time fluence monitoring into the clinic for more effective treatment.
Keywords: Photodynamic therapy, light fluence, light dosimetry, intracavitory treatment planning
1. INTRODUCTION
Photodynamic therapy (PDT) is a cancer treatment modality well suited for treating localized cancers, such as malignant pleural mesothelioma (MPM). MPM has no standard treatment protocol and patient outlook is on average, 6–17 months. Traditional cancer treatments do not consistently improve patient outlook, and PDT is one treatment option that shows promise. PDT uses a photosensitizing drug that is administered to the patient at a specified time before surgery. Once this time has elapsed, the treatment area is illuminated by a laser of a drug-specific wavelength. This illumination generates singlet oxygen that in turn causes localized cell death and tissue necrosis. Thus it is critical to understand and monitor the amount of light delivered to the desired tissue to optimize treatment efficacy. The more uniform and consistent light is delivered will lead to greater treatment accuracy and patient outlook.
Current PDT MPM protocol at the University of Pennsylvania involves the surgical debulking of tumor in the thoracic cavity, followed by illumination from a laser which is monitored by seven isotropic detectors, sutered in at several different locations in the patient’s thoracic cavity. The clinician uses the real time read out of the detectors as a guide for the regions of the cavity that need to be treated. The pleural treatment program at Penn treats patients with MPM or pleural effusion. The photosensitizing drug, HPPH®, is administered 24–48 hours before irradiation. Once this illumination time is complete, the patient under goes surgical tumor debulking and irradiation. The irradiation is applied using a laser of wavelength 661 nm at 15–60 J/cm. Within the thoracic cavity, the light delivery is continuously administered by a moving point source directed by the clinician. It is at this point in the PDT treatment where real-time dosimetry guidance becomes most critical. As the clinician applies the light source, the knowledge of how greatly each particular area of the thoracic cavity is being irradiated will make the entire treatment process more effective and efficient.
The clinician uses a real time read out of the fluence from the isotropic detectors, measured in mW/cm2, as guide to treat the thoracic cavity uniformly. However, considering the discrete nature of the monitoring system, a more complete map the fluence distribution is desirable. This is achieved by obtaining a contour of the cavity and coupling it with a device tracking the light source, then using this position data to perform a fluence calculation based on the light source position to create a real time, three dimensional fluence map. This navigation system is currently in development and has been introduced into the clinic. Full treatments from patients can be reconstructed from the clinic and currently a real-time fluence map of the direct light can applied to a phantom. The goal of the work presented here is to expand upon the direct light fluence map and incorporate a fluence solution that accounts for the scattered light present in the cavity.
2. THEORY
It is necessary, when treating the thoracic cavity, to calculate the fluence at the cavity wall for different geometries and optical properties and account for the integrating sphere effect. It has been demonstrated previously [1] that the fluence in the medium surrounding a cavity is independent of index of refraction mismatch; this does not hold, however, for fluence within a cavity. Light is multiply scattered by the cavity walls and surrounding medium and is further attenuated if an attenuating medium is present in the cavity. This causes an overall increase in the amount of fluence experienced by the inner cavity wall and must be accounted for in order to achieve accurate light dosimetry for PDT. The scattered light within a cavity is uniform, assuming an infinite number of reflections and can be expressed as[2]:
| (1) |
where S is the source strength in watts, As is the surface area of the cavity, f is the fraction of the open surface area to the total surface area, and ρ is the diffuse reflectance of the cavity wall. The diffuse reflectance can be calculated using the optical properties of the cavity wall μa (absorption coefficient) and μs′ (reduced scattering coefficient)[3]:
| (2) |
where a′=μs′/(μa+μs′) is the albedo of the surrounding medium, A is the internal reflection parameter and is a function of the ratio of the indices of refraction: nrel=nt/nv: A=(1+rd)/(1−rd) where rd=−1.44nrel−2+0.710nrel−1+0.668+0.0636nrel. The scattered portion of light in a cavity is then combined with the direct light portion and also attenuated by μatt if an attenuating medium is present in the cavity:
| (3) |
where r is the distance between the cavity wall and the light source. Thus, a full expression, dependent on light source location, cavity geometry, and optical properties exists to calculate the total fluence at the cavity wall. Our phantom study applies this theory in comparison with fluence measurements made in different geometries in order to verify the calculated fluence.
3. METHODS
3.1 Experimental Setup: Spherical and Torso Geometries
The experimental setup for dose verification in a phantom used four different cavity geometries (three spheres of radius=4.14, 5.46, and 7.78 cm and a human torso phantom) submerged in solutions of varying optical properties. Black India ink was used for the absorption component and 20% concentration Intralipid® was used for the scattering component. Intralipid® has been shown to produce scattering similar to that observed in biologic tissues[4, 5] while the absorption spectra of black ink is similar to that of hemoglobin. For each cavity geometry, an isotropic detector was placed on the inside cavity wall and another placed on the outside cavity wall to measure fluence monitored by an in-house made dosimetry system. An isotropic light source was used for the spherical cavities and a cylindrically diffusing light source was used for the human torso geometry, both at 730 nm, at a power ranging from 1–2 W (see Figure 2 for setup schematic, Figure 3 for photos of the various setups). Each cavity was submerged in a solution of nine different optical property combinations (μa=0.1,0.5,1.0 cm−1, μs′=2,10,20 cm−1) for each cavity condition (air, water, and attenuating solution). Optical properties were measured using a motorized parallel catheter system described previously in [6] [7], with the detector and source at 3 mm separation and the detector moving an overall distance of 5 mm. For each solution, optical properties were measured three times and fluence measured five times, with the resulting value of optical properties and fluence being the average of the measurements respectively. For each solution combination, the light source was placed at both the center of the cavity and at an off-center location in order to observe source location affects on fluence at the cavity wall.
Figure 2.
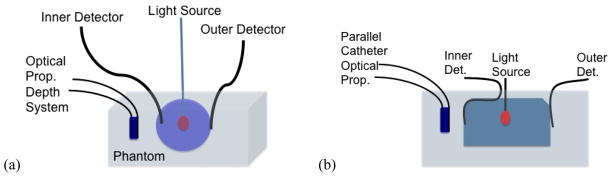
(a) Schematic of experimental setup for a spherical cavity. Optical properties were measured three times before the light source was placed within the cavity. (b) Schematic of experimental setup for the human torso geometry. The “radius” of this geometry was determined by measuring the volume of the cavity and treating the cavity as a sphere.
Figure 3.
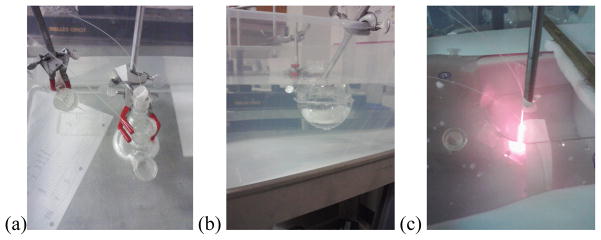
(a) and (b) Setup for spherical cavities submerged in solution. Note the parallel catheter system on the left of figure 4a used to measure the optical properties of the solution. (c) Setup for the human torso phantom submerged in solution with a cylindrically diffusing light source located at the center of the cavity.
Measurements were made in darkened room to prevent overhead lights from affecting overall fluence levels while cavities were submerged in solutions contained in clear plastic containers.
3.2 Navigation System Treatment
The Polaris® Spectra (North Digital Inc., Waterloo, Canada) system was used as the infrared (IR) camera to track treatment motion in 3D. Passive spherical markers (Fig. 1a) were places on the end of the contour and treatment wands so the IR system could track the motion, and the accuracy of the system was ~0.5 mm in 3D. The position data were transferred to a computer at a rate of 20 – 60 Hz, and can be displayed and processed by Matlab® (Mathworks, Natick, MA) in real time. Two phantom treatments were conducted using the navigation system with human torso geometry submerged in a solution of μa=0.78 cm−1 and μs′= 11.2 cm−1. A contour and detector positions were measured twice using the contour navigation tool. Treatments were performed for a period of five minutes each at a power of 3 W at 70% efficiency. The light source position on the treatment wand was determined using the method described by [8]. All data was processed using programs developed in Matlab®.
Figure 1.

A patient’s thoracic cavity being treated with PDT in the clinic. Before the laser is turned on the isotropic detectors are sutered in a various points through the cavity after the bulk tumorous tissue is removed.
4. RESULTS
4.1 Spherical Cavities
Figure 4 displays the results from the spherical cavity measurements for spheres of varying radius. For a spherical air cavity, there is good agreement between the averaged measured fluence values and the calculated values (calculated using Eqn. 1). As the absorption coefficient of the solution surrounding the cavity increases we see the expected decrease in fluence flatten out. We also observe the expected overall increase in observed fluence with increasing reduced scattering. Once a medium other than air is introduced into the cavity, this agreement begins to break down, with the theory overestimating the fluence. These results are independent of cavity size.
Figure 4.

(a–c) Fluence as a function of the absorption coefficient for μs′=2 (red), 10 (blue), and 20 cm−1 (green) in a spherical air cavity. The lines represent fluence calculated using Eqn. (1) and the circles represent the measured values. (d–f) Fluence as a function of the absorption coefficient in a spherical water cavity. (g–i) Fluence as a function of absorption coefficient in a spherical cavity filled with a solution if μattn=0.053 cm−1. Note the theory overestimate the fluence to a greater degree as the medium inside the cavity increases in attenuation.
4.2 Human Torso Cavity
The human torso cavity picture in Fig. 3c was submerged in a solution of varying optical properties, and the fluence experienced at the cavity was measured using two isotropic detectors. Figure 5 displays the results of these measurements compared to the calculated fluence, treating the torso cavity as a sphere of the same volume. Unlike the spherical cavity, there appears to be greater agreement between theory and observation for a water cavity as compared to the airy cavity.
Figure 5.
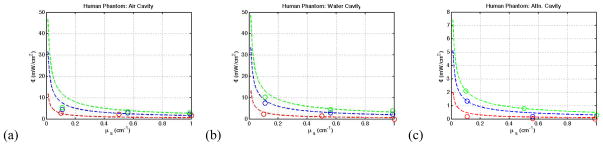
(a–c) The averaged fluence measured (circles) compared the fluence calculated (dashed line) for the human torso cavity for an (a) air cavity, (b) water cavity, and (c) attenuating medium cavity.
4.3 Navigation System Treatment
Using the procedure presented in [8], two treatments were conducted using the human torso cavity. Using the position tracking data coupled with Eqn. 1 where r is the distance between the light source and the cavity wall (the location of which is determined using the contour displayed in Fig. 6a), a comparison is made between measured and observed fluence. By including the scattered light in the calculation, greater agreement is achieved between observation and theory, as seen in Fig. 6b–c.
Figure 6.
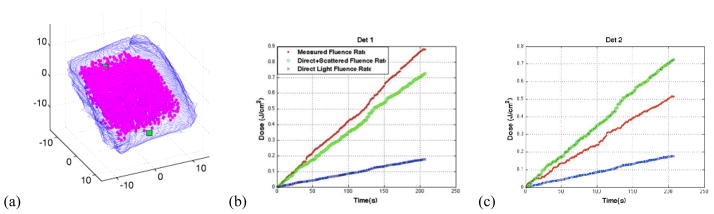
(a) Contour of the human torso cavity obtained using the IR navigation system with the location of the two isotropic detectors marked by a green square with treatment volume denoted by the pink dots. (b–c) the overall fluence rate measured as a function of time (red) compared to the direct light calculation (blue) and the direct+scattered light calculation (green).
5. DISCUSSION AND CONCLUSION
The results for a spherical air cavity are in good agreement with the theory presented in Eqn. 1. Upon the introduction a medium within the cavity, however, this agreement begins to break down and the theory consistently overestimates the amount of fluence experienced by the cavity wall. Further investigation is needed to determine the cause of this disagreement. When considering a cavity of arbitrary geometry such as an empty human torso, the geometry can effectively be approximated as a sphere of the same volume and still achieve good agreement between fluence observations and calculated fluence. Again, with the introduction of an attenuating medium in the cavity, our theory overestimates the fluence at the cavity wall. In the future we hope to resolve this disagreement by obtaining a numerical solution from a series of Monte Carlo simulations.
Coupling the theory presented here with the navigation system shows promising results for calculating both and direct and scattered fluence in real time in arbitrary geometries. By adding in the scattered light term for total fluence, much greater agreement is achieved between observed and calculated fluence using the position data from the camera. More work needs to be done to improve this agreement to a greater degree particularly in the instance where an attenuating medium is present. In the future, clinical implementation of this tool with real-time fluence mapping will provide a powerful guidance system for the clinician in efforts to more uniformly and efficiently deliver light dose for pleural PDT.
Acknowledgments
This work is supported by grant from National Institute of Health (NIH) P01 CA87971 and an NRSA training grant (5T32CA009677-19).
References
- 1.Star W. The relationship between integrating sphere and diffusion theory calculations of fluence rate at the wall of a spherical cavity. Physics in Medicine and Biology. 1995;40:1–8. doi: 10.1088/0031-9155/40/1/001. [DOI] [PubMed] [Google Scholar]
- 2.Integrating Sphere Design and Applications Technical Information. SphereOptics. 2007. p. 4. [Google Scholar]
- 3.Dimofte A, et al. In vivo light dosimetry for motexafin lutetium-mediated PDT of recurrent breast cancer. Lasers in Surgery and Medicine. 2002;31(5):305–12. doi: 10.1002/lsm.10115. [DOI] [PubMed] [Google Scholar]
- 4.Mourant JR, et al. Predictions and measurements of scattering and absorption over broad wavelength ranges in tissue phantoms. Applied Optics. 1997;36(4):948–957. doi: 10.1364/ao.36.000949. [DOI] [PubMed] [Google Scholar]
- 5.van Staveren HJ, et al. Light scattering in Intralipid-10 in the wavelength range of 400–1100 n. Appl Optics. 1991;30:4507–4515. doi: 10.1364/AO.30.004507. [DOI] [PubMed] [Google Scholar]
- 6.Finlay J, et al. In vivo determination of the absorption and scattering spectra of the human prostate during photodynamic therapy. Proc SPIE. 2004;5315:132–142. doi: 10.1117/12.528968. [DOI] [PMC free article] [PubMed] [Google Scholar]
- 7.Zhu TC, Finlay JC, Hahn SM. Determination of the distribution of light, optical properties, drug concentration, and tissue oxygenation in-vivo human prostate during motexafin luteium-mediated photodynamic therapy. Journals of Photochemistry and Photobiology B: Biology. 2005;79(3):231–241. doi: 10.1016/j.jphotobiol.2004.09.013. [DOI] [PMC free article] [PubMed] [Google Scholar]
- 8.Zhu TC, et al. An IR navigation system for real-time treatment guidance of Pleural PDT. Proc SPIE. 2010;7886:78860L. doi: 10.1117/12.875635. [DOI] [PMC free article] [PubMed] [Google Scholar]