Abstract
Uniform light fluence distribution for patients undergoing photodynamic therapy (PDT) is critical to ensure predictable PDT outcome. However, common practice uses a point source to deliver light to the pleural cavity with the light uniformity monitored by 7 detectors placed within the pleural cavity. To improve the uniformity of light fluence rate distribution, we have used a real-time infrared (IR) tracking camera to track the movement of the light point source. The same tracking device is used to determine the surface contour of the treatment area. This study examines the light fluence (rate) delivered between the measurement and calculation in phantom studies. Isotropic detectors were used for in-vivo light dosimetry. Light fluence rate in the pleural cavity is calculated and compared with the in-vivo calculation. Phantom studies show that the surface contour can be determined with an accuracy of 2 mm, with maximum deviation of 5 mm. We can successfully match the calculated light fluence rates with the in-vivo measurements. Preliminary results indicate that the light fluence rate can have up to 50% deviation compared to the prescription in phantom experiments. The IR camera has been used successfully in pleural PDT patient treatment to track the motion of light source in real-time. We concluded that it is feasible to develop an IR camera based system to guide the motion of the light source to improve the uniformity of light distribution.
Keywords: Photodynamic therapy, light fluence, light dosimetry, intra-cavitary treatment planning
INTRODUCTION
PDT is a local treatment aptly suitable to treat malignant, localized tumors such as those observed in malignant pleural mesothelioma (MPM).[1, 2] MPM has no standard treatment and the median survival for diagnosed patients is 6 to 17 months, depending on the disease stage. To treat MPM, PDT is coupled with surgical debulking of the tumorous tissue, part of a trend in multi-modal regimes to increase survival rates. The photosensitizer is administered to the patient, followed by a latent period referred to as the illumination time. After the illumination time is fulfilled, debulking surgery is performed, followed by illumination.
In order to increase the success rate of such procedures, accurate light dosimetry are imperative to treatment efficacy. We propose a novel method to guide the PDT treatment in order to achieve uniform distribution of light fluence. This novel method differs from the existing protocols in following aspects: 1) 4D (3D plus time) information of the treatment is obtained using this method by real-time updated unwrapped images; 2) The accumulative light fluence of every single point of the cavity surface being treated is displayed during the guidance, whilst the existing protocol display light fluence information at a small number of locations.
The pleural treatment program at Penn treats patients with MPM or pleural effusion. The photosensitizing drug, HPPH®, is administered 24–48 hours before irradiation. Once this illumination time is complete, the patient under goes surgical tumor debulking and irradiation. The irradiation is applied using a laser of wavelength 661 nm at 15– 60 J/cm2. Within the thoracic cavity, the light delivery is continuously administered by a moving point source applied by the surgeon. It is at this point in the PDT treatment where real-time dosimetry guidance becomes most critical. As the surgeon applies the light source, the knowledge of how well each particular area of the thoracic cavity is being irradiated will make the entire treatment process more effective and efficient.
2. METHODS
2.1 Infrared tracking system
The Polaris® Spectra (North Digital Inc., Waterloo, Canada) system was used as the infrared (IR) camera to track treatment motion in 3D. Passive spherical markers (Fig. 1a) were used for the IR system to track the motion, and the accuracy of the system was ~0.5 mm in 3D. The maximum volume for the system was ~ 205 × 186 × 147 cm3, which was proper for operations on our patient population (Fig. 1b). Once the positioning wand was inside the working volume, the camera system started to track the position of the tip, on which point light source can be bonded. The position data were transferred to a computer using OpenIGTLink [3] at a rate of 20 – 60 Hz, and can be displayed and processed by Matlab® (Mathworks, Natick, MA) in real time.
Figure 1.
(a) a positioning wand with passive reflective spherical balls and (b) IR camera to monitor movement of a point in a 3D volume (205×186×147 cm3).
2.2 Treatment guidance procedure
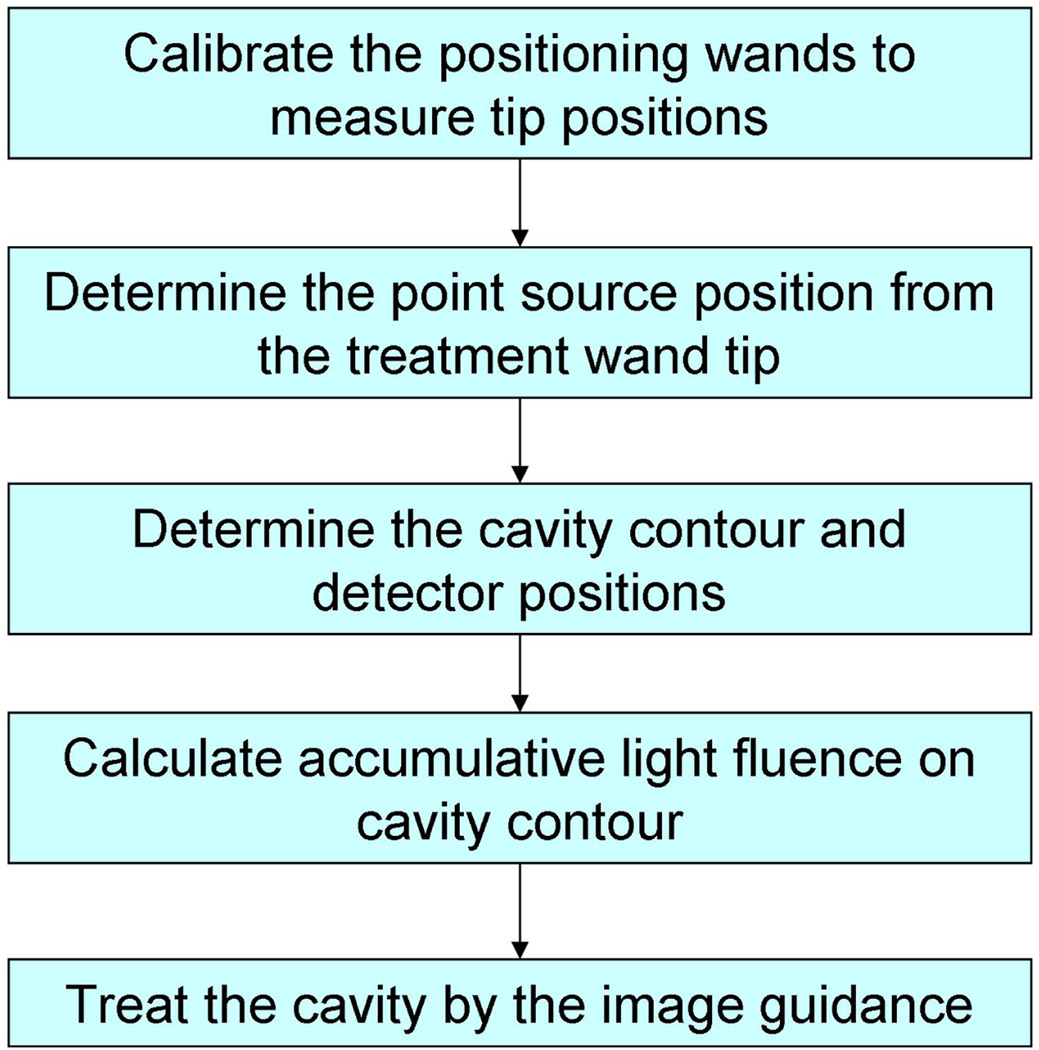
The procedure of the image-guidance system for pleural PDT is shown in Figure 2. Two positioning wands were used in this procedure to complete the image guidance. One wand was used for taking detector and treatment surface contour, while the other one was used for tracking the light source positions during PDT treatment. They are named as contour wand and treatment wand respectively in the subsequent text in this proceeding. Both wands were calibrated to locate their tip positions by pivoting them around a fixed point. Then an optimization algorithm was used to determine the shift between the treatment wand tip position and laser point source. The contour wand was then used to locate the detectors on the cavity surface, and also determine the cavity contour. When the PDT treatment began using the treatment wand, the light fluence distribution on the cavity surface is calculated simultaneously so that the treatment can be guided by the real-time light fluence image to achieve a uniform light fluence on the cavity. To verify the image-guidance procedure, detectors were attached on the cavity surface so that the calculated light fluence can be compared with the measurements at several positions.
Figure 2.
Schematics for the treatment procedure for image guided treatment.
2.3 Determination of laser source position
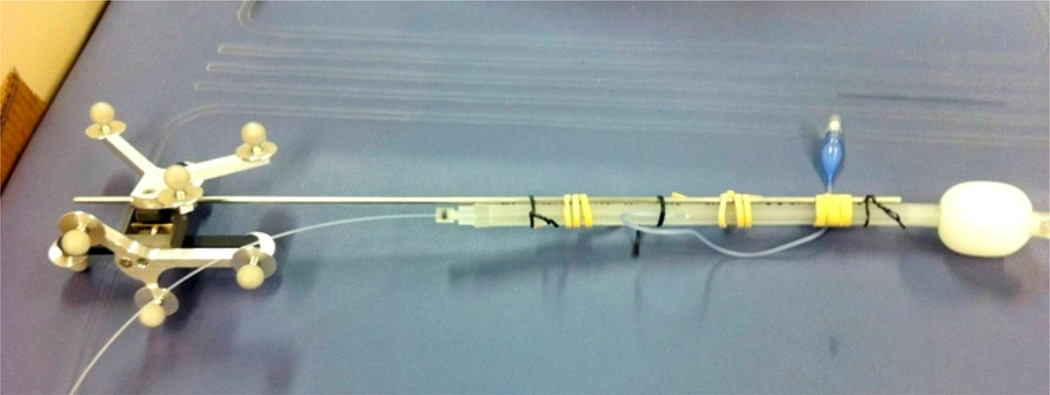
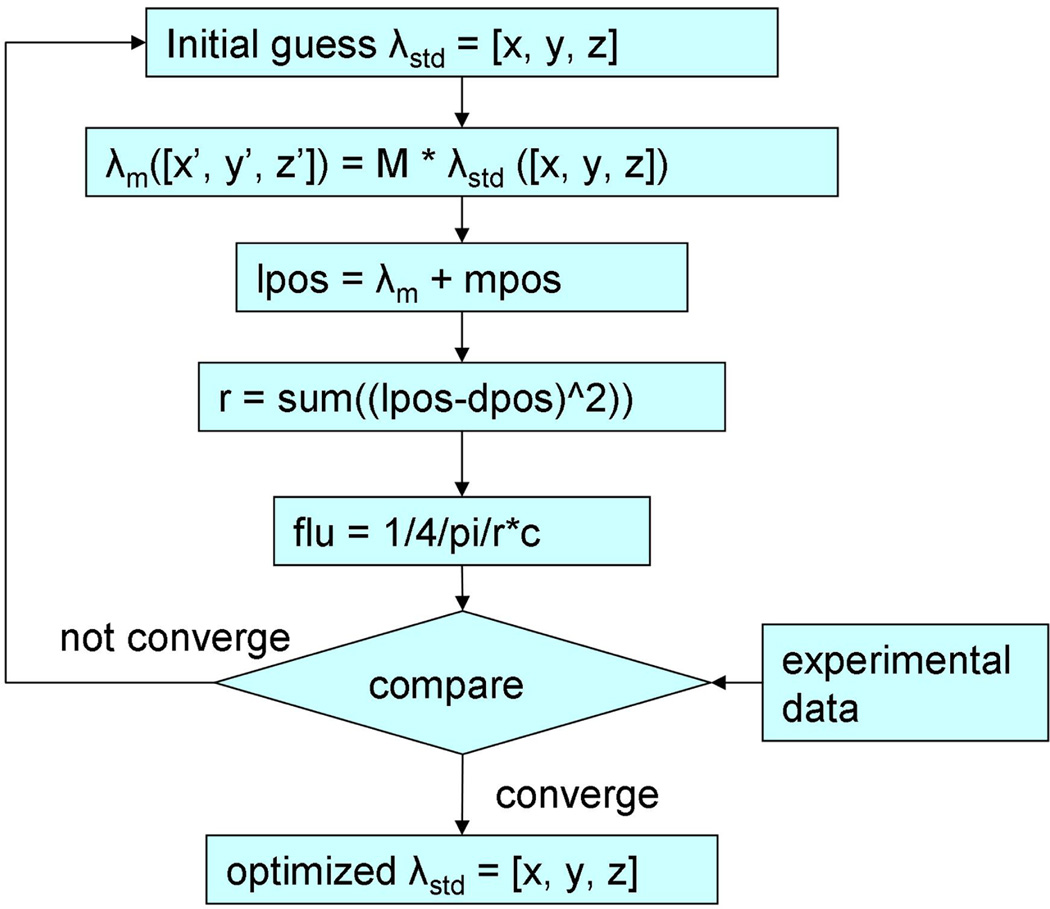
In the IR navigation system, the position of the contour wand tip was known from the IR camera after the positioning calibration process. However, knowing the laser point source position was the key to calculate light fluence for the image-guidance system. During the treatment, a laser fiber was used to deliver the light from a clinical diode laser. The laser fiber tip was located in the balloon of the treating wand, which contained 0.1% Intralipid solution for scattering purpose when delivering the light (Fig. 4). This point source position was determined by a customized optimization algorithm, which is shown in Figure 3. Briefly, an initial guess of the shift between laser point source position and the treatment tool tip position (λstd) in the coordinates of the treatment tool was taken to perform the process. This shift was then transformed into the coordinates of each measurement, by multiplying the rotational matrix M to get the shift in the transformed coordinates (λm). Then the light source position (lpos) can be determined from λm and the measured tool tip position (mpos). Thus, the distance between light source and detector (r) can be determined, as well as the calculated fluence rate (flu). Six positions of the treatment wand were recorded, corresponding to six fluence rate readings from an isotropic detector. The optimization algorithm compares the calculated fluence rates and the measured values to give the most possible shift between the light source position and the treatment wand tip position. Therefore during the PDT treatment, the point laser source can be recorded by the system.
Figure 4.
Picture of a treatment wand composed of a positioning wand bound to a laser treatment wand. The shift between the tip of the positioning wand and the laser source (λm) are to be determined in the OR using the optimization procedure described in Fig. 3.
Figure 3.
Schematics for the optimization algorithm to determine iteratively the position of the laser source relative to the wand tip (λm).
2.4 Determination of pleural cavity contour
To demonstrate the light fluence on the cavity wall, the contour of the cavity need to be determined. The contour positions were measured by moving the contour wand on the inside of a phantom for ~2 minutes. At each recorded point, the position of the tracking device tip was used to represent the inner surface of the cavity. Once the points on the cavity inner surface were determined, a customized algorithm was used to interpolate these points and reconstruct a cavity contour with equal-space in z direction. Detectors attached onto the cavity surface were also located by the contour tool so that they can be located and used to compare the measured results with the image guidance calculations.
2.5 Light fluencee calculation
One can calculate the light fluence rate (ϕ) by summing up the direct and the scattering light during pleural PDT. The direct light follows a simple formula for a point source, i.e.,
| (1) |
where r is the distance from the point of interest to the laser point source. For a perfect integrating sphere, the scattered light fluence rate inside the sphere, assuming an infinite number of reflections, is uniform and can be calculated according to [4]:
| (2) |
where S is the light source power (mW), ρ is the diffuse reflectance of the scattering wall surface, As (=4πR2) is the total surface area with R the radius of the sphere, f is the fraction of the open surface area to the total surface area. Equation (2) is applicable for light fluence in pleural cavity since the integrating sphere theory does not restrict the shape of the enclosed reflective surface. Considering the case of additional absorption from the non-scattering medium inside the pleural cavity (e.g., due to bleeding) and the direct light component, Equations (1) and (2) can be modified to determine the total light fluence rate as:
| (3) |
where μa is the absorption coefficient of the non-scattering liquid. The diffuse reflectance can be calculated based on the optical properties of the thoracic wall [5]. For the phantom studies, only the direct light without light attenuation is considered, i.e. the light fluence at one point on the surface can be described as:
| (4) |
where Ψ is the light fluence at a point at time t. The light fluence was calculated on each point of the reconstructed surface contour, so that 4D information on the contour surface is obtained. For visualization purposes, the 3D light fluence map was unwrapped into 2D meshes, so that the x-axis of the 2D mesh represents the azimuth angle, the y-axis of the 2D mesh represents the height (or z in 3D), and the z-axis of the light fluence values. This 2D light fluence mesh can be updated in real-time so that it can guide the PDT treatment for uniform light fluence distribution.
3. RESULTS
3.1 Results of laser source position
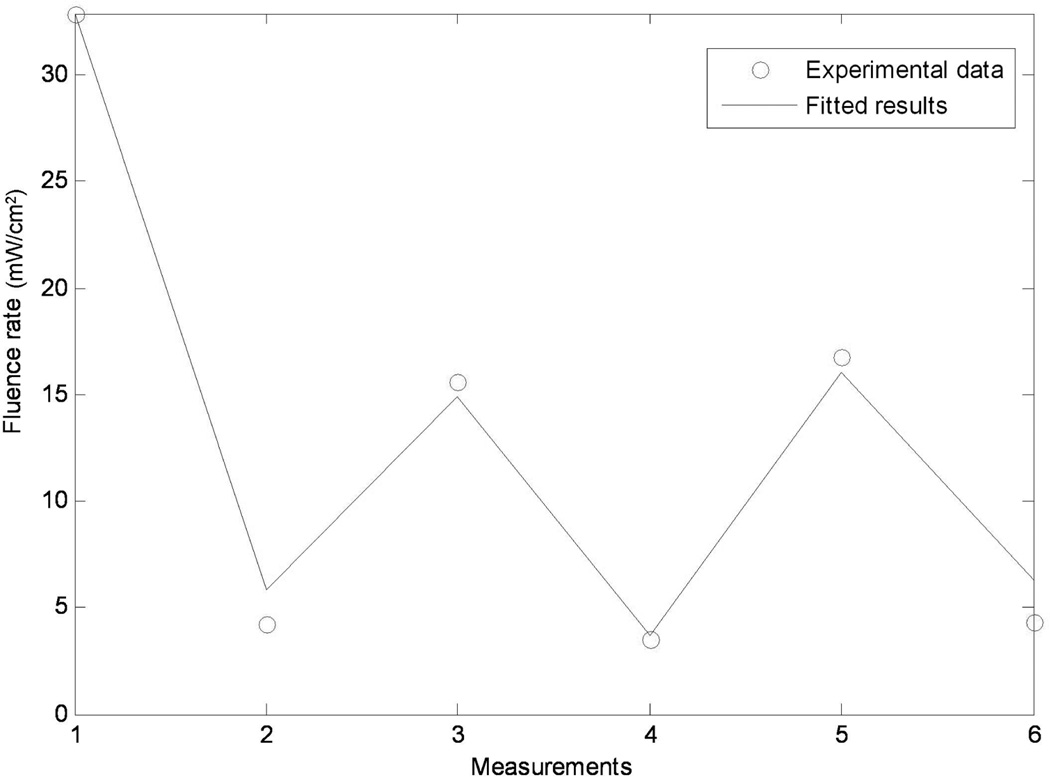
Figure 5 shows the result of an example using the optimization algorithm in 2.3. In the figure, 6 measurements were performed to obtain different light fluence rates at different positions. Then the algorithm compared the experimental results with the calculated values (solid blue line) and gave an optimized shift between laser point source position and the treatment tool tip position so that the least square of the difference between the results were minimized. Then the optimized shift was used to determine the laser point source position in the PDT treatment.
Figure 5.
Optimization results for determining the position of the laser source relative to the wand tip (λm) by matching the measured (symbols) and calculated (line). The Matlab code for performing calculation requires only seconds so it can be performed in real-time in OR environment.
Figure 6.
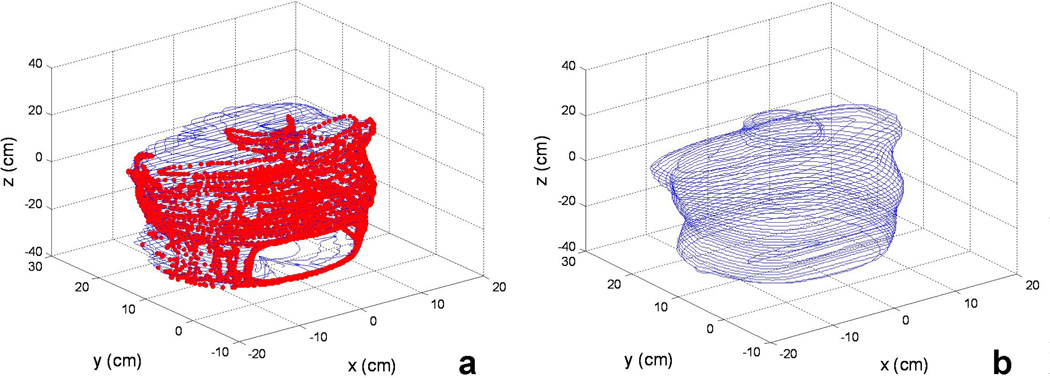
Comparisons of the surface contours determined using (a) IR camera and (b) CT for a chest phantom. The red thick lines in (a) are the raw data obtained using IR camera and the blue thin lines are constructed with our algorithm. The calculation takes less than 1 minutes on a conventional PC.
3.2 Results of cavity contour
The cavity contour results were demonstrated in a phantom as an example. The contour positions were taken from outside of the phantom so that a clear shape can be discerned. In Figure 6a the red dots denote the contour surface position date taken by the IR navigation system, while the blue solid lines denote the reconstructed cavity contour by the algorithm described in 2.4. This reconstruction was used as the cavity representative, and was used for the light fluence calculations.
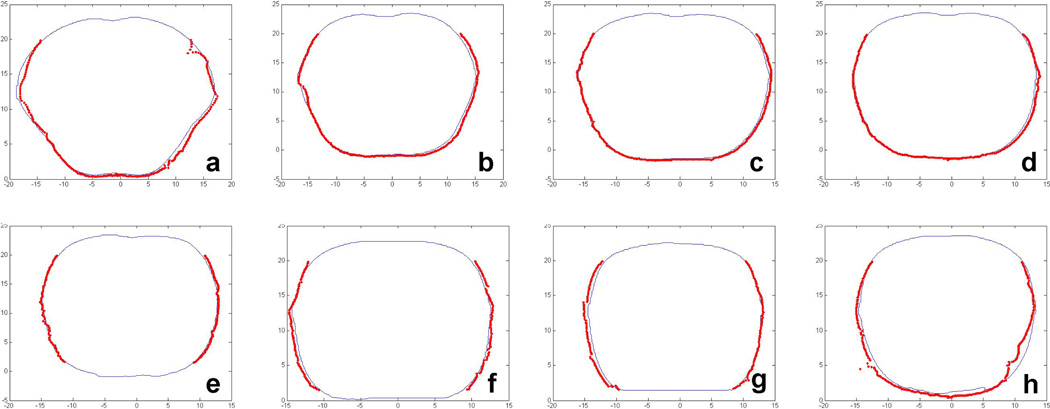
To verify the accuracy of the cavity contour, slice by slice comparison between the IR camera results and the CT results are shown in Figure 7, in which the figures a to h correspond to the contours at depth z in Figure 6 of 1.8 cm, −4.2 cm, −10.2 cm, −13.2 cm, −16.2 cm, −19.2 cm, −25.2 cm, and −34.2 cm respectively. The thin blue lines represent the contour taken by CT images, and the thick red dots represent the contour by the process described in 2.4. The maximum difference between the two was 5 mm.
Figure 7.
Comparison between IR camera (thick red) and CT (thin blue) for a chest phantom.
3.3 Image guidance results in a phantom
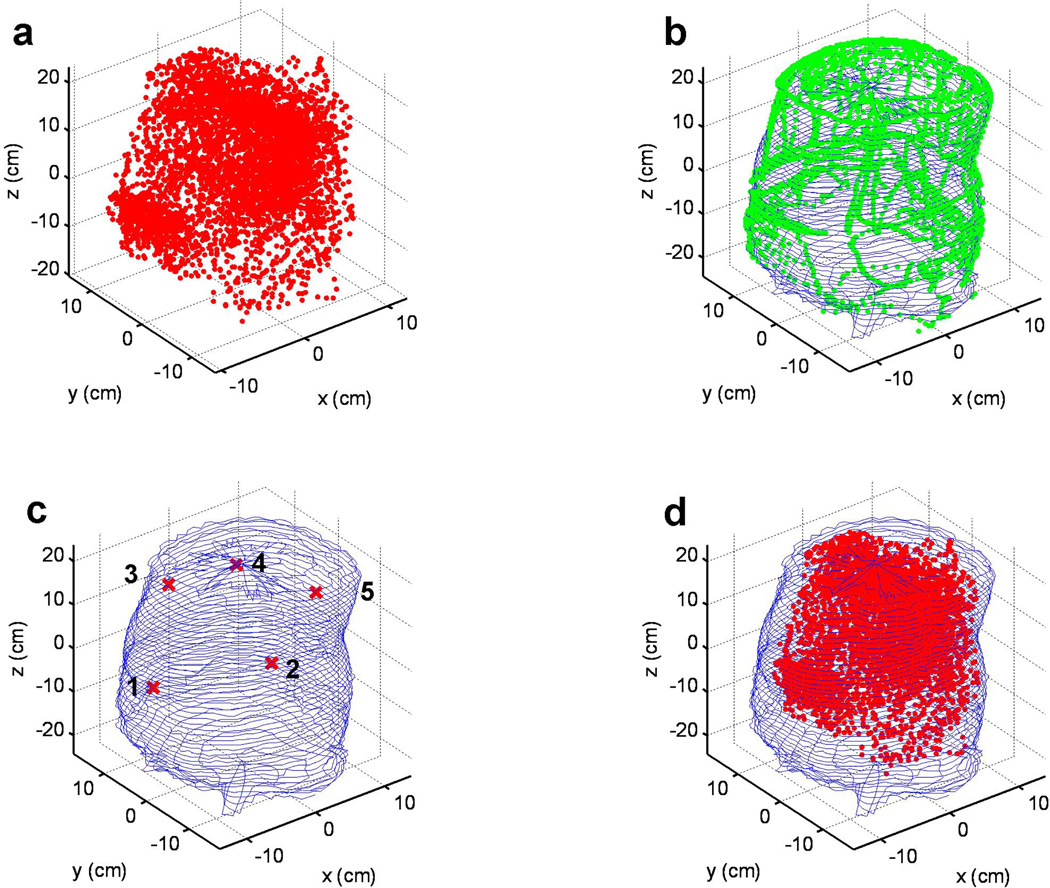
The image guidance for pleural PDT treatment was first demonstrated on the phantom described above. The cavity contour of the inside of the phantom was taken using the algorithm in 2.4. In figure 8b, the recorded contour positions were shown by the green dots, while the reconstructed cavity contour was shown by blue solid lines. There were five detectors used in the experiments, whose positions were also shown together with the cavity contour, as in figure 8c.
Figure 8.
(a) Laser point positions during a PDT treatment session in a phantom. (b) Overlay of surface contour determined by the reconstruction algorithm (thin blue line) and the raw IR camera data (green symbols). (c) The locations of the isotropic detectors on the phantom surface (thin blue lines). (d). Laser position (red symbol) within the phantom contour (thin blue lines).
The PDT treatment position data were also recorded by the IR navigation system. Each recorded position of the laser point source is displayed in figure 8a as a red dot, and they are also combined with the cavity contour of the phantom, to depict how the PDT treatment was performed inside the phantom cavity.
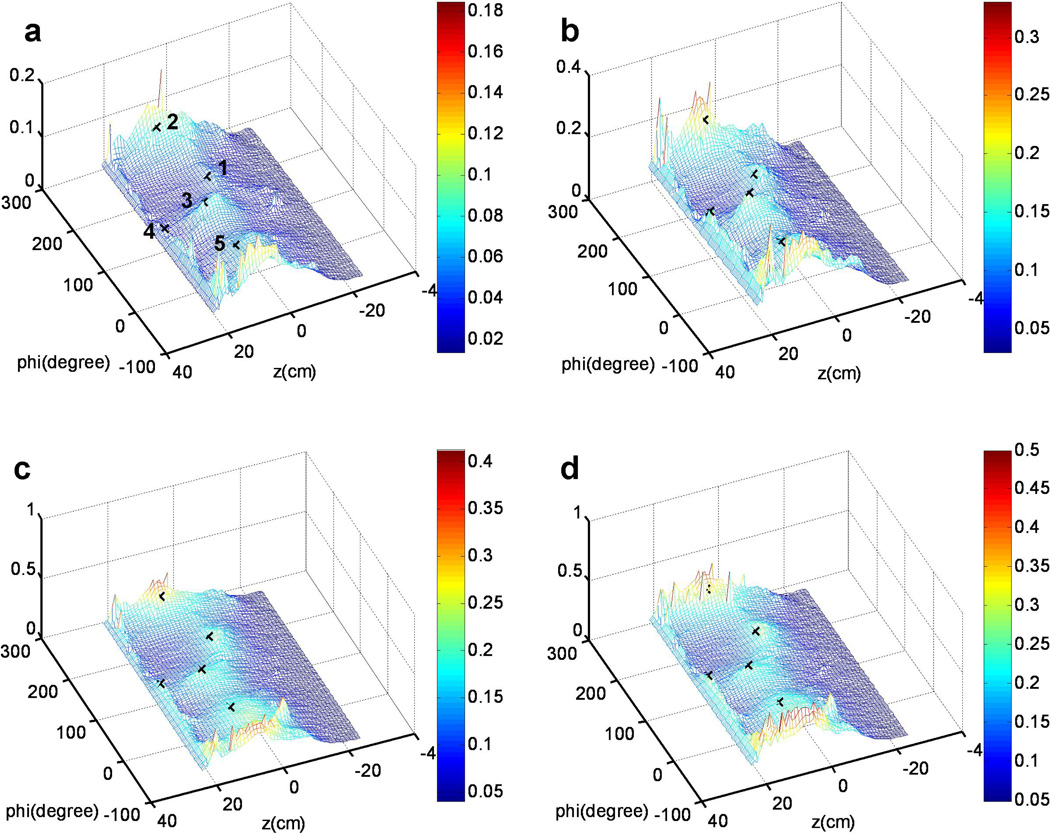
Based on the light fluence model described in 2.5, the accumulative light fluence was calculated in an unwrapped map to display the light fluence for each point of the cavity surface in real time. The unwrapped light fluence maps were mesh for illustrations, and are shown in figure 9 at four different time points. As shown in figure 9a, the five detectors were denoted by the cross markers, corresponding to their 3D positions in figure 9c. Figure 9a – d showed the light fluence mesh for the PDT treatment in the phantom at 86 s, 174 s, 160 s, and 346 s, respectively. The maximum treatment light fluence reached 0.5 J/cm2 in this experiment. In the light fluence mesh, x-axis represents the azimuth angle (phi), while y-axis of the 2D mesh represents the height. By examining the final results, it is concluded that there can easily 50% deviation in regions beyond locations of the detectors (e.g., z < 0 cm) and high geometric gradients (e.g., z ~ 20 cm).
Figure 9.
Calculated light fluence distribution on the contour surface unwrapped on to a 2D rectangular surface for different treatment time: (a) 86 sec (b) 174 sec (c) 160 sec (d) 346 sec.
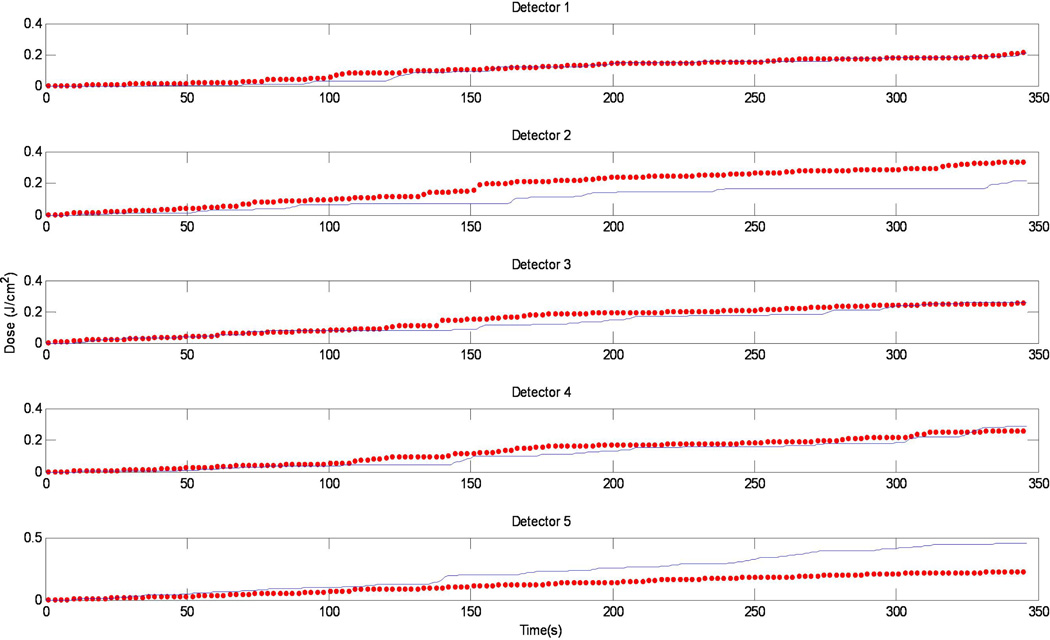
In Fig. 10, the calculated light fluence vs. time was compared with the measured light fluence. We have good agreement for detectors 1, 3, and 4. There are substantial disagreement between the two for detectors 2 and 5, which could be attributed to the positioning uncertainty of the detectors.
Figure 10.
Comparison between the measurement (red symbols) and calculation (blue lines) vs. time for the 5 isotropic detectors.
3.4 Image guidance results in patient
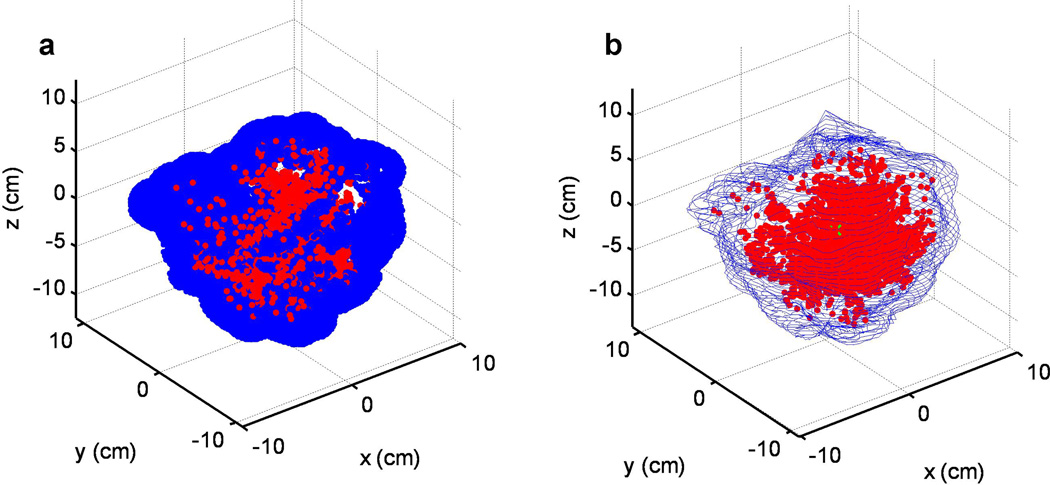
We have monitored the light source position during treatment for one patient. Unfortunately, we were not able to obtain the surface treatment area using a second wand. To estimate the treatment area, we assume the treatment surface is defined by the laser points surrounded with a 2 cm diameter sphere to simulate the intralipid ball encompassing the laser source. The result is shown in Fig. 11b.
Figure 11.
(a) Laser position during a pleural PDT treatment and (b) reconstructed treatment contour
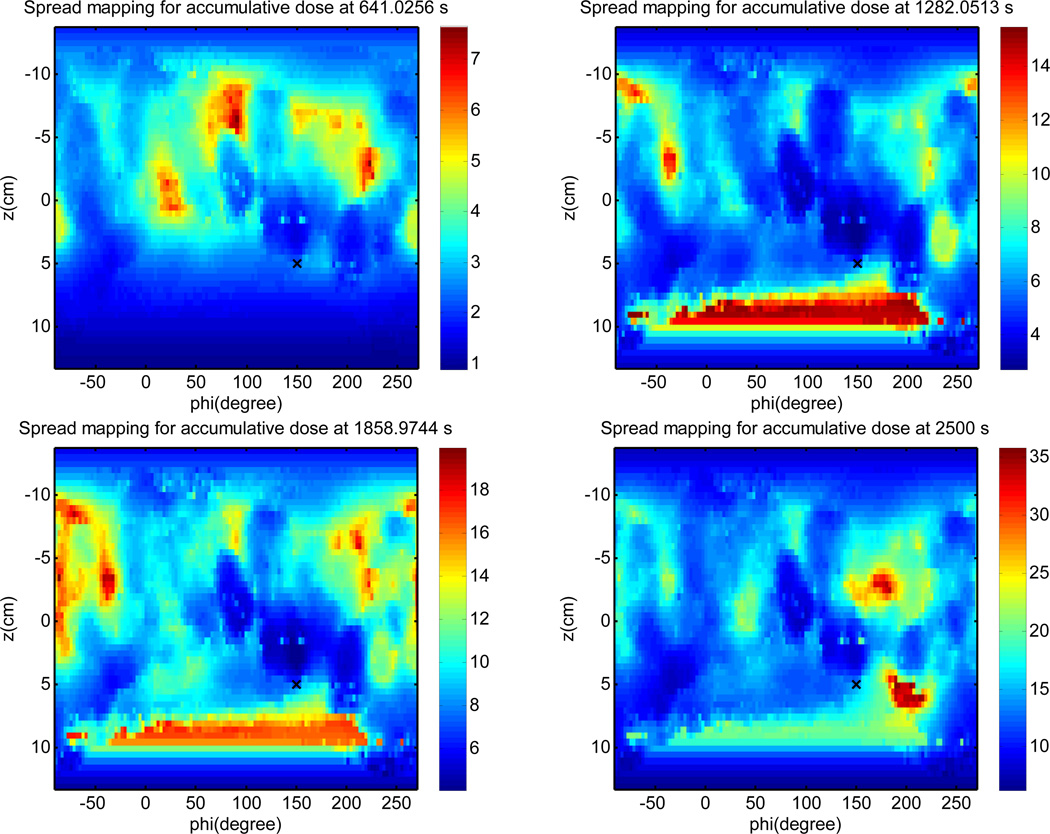
Light fluence is calculated on the pleural surface and unwrapped into a 2D color plot (Fig. 12). It is impossible to draw a conclusion about the light fluence uniformity due to (1) uncertainty in pleural surface determination; (2) missing data of laser positioning due to obscuring of views of the reflective sphere to the IR camera; (3) Error in light fluence calculation due to missing scatter light calculation (which requires knowledge of tissue optical properties). However, even with these drawbacks, it is clear that the physician can use the map to guide the movement of laser source to achieve more uniform light fluence distribution.
Figure 12.
Calculated light fluence at various times using only the direct light (Eq. 4) at different treatment times.
4. DISCUSSION AND CONCLUSION
The results presented here show promising aspects of pleural PDT treatment planning. The IR camera system developed here is shown to be able to obtain the location of the light-source position in real time. This wand would be an exciting addition to PDT treatment, to better help surgeons apply illumination more effectively as well as more efficiently.
Preliminary study has shown that the position data can be transferred to the light fluence calculation engine in real time through a simulated server port. The accumulative light fluence distribution can be displayed on a two dimensional unwrapped surface during the treatment, using the PDT light calculation model, with a rate of 1 Hz.
We have demonstrated that the IR camera system can be used in patients to obtain in-vivo data during pleural PDT. Furthermore, we propose an empirical formula to calculate the fluence rate in a cavity in real time. By verifying our analytical solution with a FEM solution, we are able to assert that fluence rate is not dependent on index of refraction mismatch, angle, or source-location. Further works needs to be done to fully understand the fluence within the cavity as function of multiple scattering and attenuation. We plan to compare these results to phantom measurements in order to further verify our solution.
A marriage of the two results discussed here may provide a powerful wand to pleural treatment planning. By coupling real-time IR monitoring with our analytical fluence rate solution we are able to develop a system which can display the fluence received in a patient in real-time to the treatment team. This will provide an added dimension of efficiency to dosimetry in pleural PDT cases. This, in turn, may help increase the effectiveness and success rate of pleural PDT cases.
ACKNOWLEDGMENT
This work is supported by grant from National Institute of Health (NIH) P01 CA87971.
REFERENCES
- 1.Pass HI, DeLaney TF, Tochner Z, Smith PE, Temeck BK, Pogrebniak HW, Kranda KC, Russo A, Friauf WS, Cole JW, et al. Intrapleural photodynamic therapy: results of a phase I trial. Ann Surg Oncol. 1994;1(1):28–37. doi: 10.1007/BF02303538. [DOI] [PubMed] [Google Scholar]
- 2.Pass HI, Tochner Z, DeLaney T, Smith P, Friauf W, Glatstein E, Travis W. Intraoperative photodynamic therapy for malignant mesothelioma. Ann Thorac Surg. 1990;50(4):687–688. doi: 10.1016/0003-4975(90)90230-4. [DOI] [PubMed] [Google Scholar]
- 3.Tokuda J, Fischer GS, Papademetris X, Yaniv Z, Ibanez L, Cheng P, Liu H, Blevins J, Arata J, Golby AJ, Kapur T, Pieper S, Burdette EC, Fischtinger G, Tempany CM, Hata N. OpenIGTLink: an open network protocol for image-guided therapy environmen. Int. J Med Robot. 2009;5(4):423–434. doi: 10.1002/rcs.274. [DOI] [PMC free article] [PubMed] [Google Scholar]
- 4.SphereOptics. Integrating sphere design and application technical information. 2007:4. [Google Scholar]
- 5.Dimofte A, Zhu TC, Hahn SM, Lustig RA. In vivo light dosimetry for motexafin lutetium-mediated PDT of recurrent breast cancer. Lasers in surgery and medicine. 2002;31(5):305–312. doi: 10.1002/lsm.10115. [DOI] [PubMed] [Google Scholar]


