

Abstract
Background
Efferocytosis is a process by which dead and dying cells are removed by phagocytic cells. Efferocytosis by macrophages is thought to curb the progression of atherosclerosis, but the mechanistic insight of this process is lacking.
Methods and Results
When macrophages were fed apoptotic cells or treated with pitavastatin in vitro, efferocytosis-related signaling and phagocytic capacity were upregulated in an ERK5 activity–dependent manner. Macrophages isolated from macrophage-specific ERK5-null mice exhibited reduced efferocytosis and levels of gene and protein expression of efferocytosis-related molecules. When these mice were crossed with low-density lipoprotein receptor−/− mice and fed a high-cholesterol diet, atherosclerotic plaque formation was accelerated, and the plaques had more advanced and vulnerable morphology.
Conclusions
Our results demonstrate that ERK5, which is robustly activated by statins, is a hub molecule that upregulates macrophage efferocytosis, thereby suppressing atherosclerotic plaque formation. Molecules that upregulate ERK5 and its signaling in macrophages may be good drug targets for suppressing cardiovascular diseases.
Keywords: atherosclerosis, signal transduction
The necrotic core in advanced atherosclerotic lesions is a lipid-rich area containing dead and necrotic white blood cells, mainly macrophages, surrounded by inflammatory cells and contributes toward formation of vulnerable plaques and plaque disruption.1,2 Rapid phagocytic clearance (efferocytosis) of the corpses by macrophages prevents necrotic core formation, but as the demand for efferocytosis increases, the system fails to meet this demand, resulting in the formation of necrotic cores.2–4 In addition, recent evidence shows that efferocytosis becomes defective in advanced human lesions.2 The preventive action of statins on acute coronary syndrome independent of its effect of lowering plasma lipid levels has been recognized.5 In addition, lovastatin was implicated to regulate efferocytosis.6
“Find-me” and “eat-me” signals generated by apoptotic cells (ACs) and macrophages regulate efferocytosis.2–4 When cells, including foam cells, undergo apoptosis, they release diffusible find-me molecules to which macrophages are attracted. ACs also express eat-me signals (such as phosphatidylserine) on their surface,7 and via phosphatidylserine receptors such as T-cell immunoglobulin and mucin-domain–containing molecule, angiogenesis inhibitor 1, and stabilin2, macrophages capture and engulf ACs. In addition to this direct binding of phosphatidylserine to its receptors, it also binds opsonins such as milk fat globule–epidermal growth factor 8 (Mfg-e8) and thrombospondin (Thbs)1. Opsonins are bridging molecules between phosphatidylserine (on the surface of ACs) and various opsonin receptors (on the surface of macrophages), for example, transglutaminase 2/integrin for Mfg-e8, CD36 for Thbs1, and c-mer proto-oncogene tyrosine kinase for growth arrest–specific 6, which also promote the engulfment activity of macrophages.8
The involvement of efferocytosis-related molecules in atherosclerosis has been well established.9,10 Although ACs and statins are known to heighten the phagocytic activity of macrophages,6,11 the mechanism for this is not understood. Mukundan et al11 recently reported that the expression of peroxisome proliferator-activated receptor δ (PPARδ) and certain key opsonins including C1q, Mfg-e8, and Thbs1 was increased in macrophages that were incubated with ACs. Intriguingly, however, clearance of apoptotic debris by these macrophages was delayed despite increased opsonin production.12 Previously, we have demonstrated the involvement of ERK5 in transactivation of PPARγ and PPARδ in endothelial and C2C12 cells.13 ERK5 is a member of the mitogen-activated protein kinase family activated by redox and hyperosmotic stresses, growth factors, and pathways activated by certain G-protein–coupled receptors.14 ERK5 is not only a kinase but also has transcriptional activity, which is critical for activating transcription factors such as Kruppel-like factor 2 (KLF2) and PPARs.13,15,16 These studies suggest a possible role for ERK5 in phagocytosis by macrophages. Indeed, ERK5 is highly expressed in monocytes/macrophages, but its function, especially in the context of efferocytosis and cardiovascular diseases, is unknown.
In this study, we investigated whether ACs and statins could activate ERK5 in macrophages. We also examined whether this ERK5 activation has a role in phagocytosis of ACs. We found that in response to AC feeding and treatment with statins, macrophage ERK5 activity was significantly increased and also enhanced phagocytic clearance by upregulating expression of efferocytosis-related molecules. These in vitro results provide the mechanism for the effect of statins that, in our in vivo experiments, have inhibited apoptotic debris accumulation and formation of necrotic cores and atherosclerotic lesions. On the other hand, depletion of ERK5 in macrophages increased M1-related (inflammatory) gene expression, increased atherosclerotic plaque formation, and reduced the thickness of the fibrotic cap of advanced plaques. The molecules in the efferocytosis pathways should be attractive drug targets because they have unique features that distinguish them from other mitogen-activated protein kinase and signaling events.
Methods
Additional details of the experimental procedures are included in the online-only Data Supplement.
Mice
All animal procedures used in this study were approved by the Animal Care and Use Committee of the University of Rochester. All animals were housed in a temperature-controlled room under a light (12 hours)/dark (12 hours) cycle and under pathogen-free conditions. Macrophages deficient in ERK5 were obtained from ERK5fl/fl mice crossed with LysMCre+/− (C57BL/6 background) mice (ERK5-MKO). For atherosclerosis studies, these mice were crossed with low-density lipoprotein receptor (LDLR)−/− (C57BL/6J background) mice (ERK5-MKO/LDLR−/−). At 8 weeks of age, mice were placed on a high-cholesterol diet (D01061401C, Research Diets, Inc) for 8 or 16 weeks. We prepared ACs by culturing thymocytes from 6- to 8-week-old C57BL/6J wild-type mice in serum-free RPMI medium for 16 to 18 hours or by treating them with dexamethasone (100 nmol/L) for 3 hours.17 For fuorescence-activated cell sorting and microscopy analyses, we labeled apoptotic thymocytes by incubating them with 2 μmol/L 5-chloromethylfluorescein diacetate (CMFDA; Molecular Probes) for 30 minutes before feeding them to macrophages.
Statistical Analysis
Data are presented as mean±SD. Comparison between 2 independent groups was subjected to the Wilcoxon rank sum test. For multiple comparisons of >2 groups, the Kruskal-Wallis test followed by Dunn post hoc analysis was performed with the use of GraphPad Prism (GraphPad Software, Inc, CA). A P value <0.05 was considered statistically significant.
Results
ERK5 Regulates Macrophage Efferocytosis
We have shown previously that ERK5 is involved in regulating PPARδ transcriptional activity.13 Because PPARδ plays a role in phagocytosis of ACs by macrophages,11 we first studied whether ERK5 was activated in bone marrow–derived macrophages (BMDMs) that were fed apoptotic thymocytes as ACs and found that ERK5 kinase activity was increased by ≈10±3.7-fold. This ERK5 activation by ACs was specific because necrotic thymocytes failed to activate ERK5 (Figure 1A). The ERK5 mRNA level (Figure 1B) and protein expression (Figure I in the online-only Data Supplement) also increased in macrophages fed ACs, suggesting the importance of ERK5 in phagocytosis. Flow cytometry data on our thymocyte preparations indicated that practically all cells expressed a lymphocyte-specific protein, CD3 (Figure IIA in the online-only Data Supplement), and that cells with a natural killer T cell–specific marker NK1.1 were negligible (0.496%; Figure IIB in the online-only Data Supplement). Therefore, the results shown in Figure 1A are not due to apoptotic natural killer T cells. Because activated ERK5 detected in the experiment shown in Figure 1A could come from engulfed CD3+ ACs, we analyzed the presence of CD3 protein in macrophages fed ACs. This lymphocyte marker was not detected in AC-fed macrophages, whereas it was readily detectible in ACs that were not phagocytized (Figure IIC in the online-only Data Supplement). Thus, ERK5 detected in Figure 1A comes from macrophages.
Figure 1.
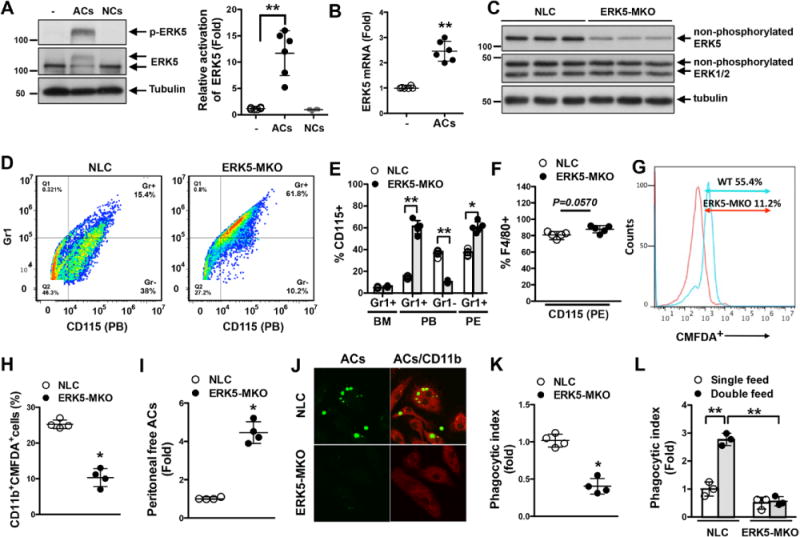
ERK5 kinase activation is involved in macrophage efferocytosis. A and B, ERK5 phosphorylation (A) and mRNA expression (B) in bone marrow–derived macrophages fed apoptotic cells (ACs) for 30 minutes (A) or 18 hours (B), respectively. Feeding necrotic cells (NCs) did not increase ERK5 phosphorylation (A, left), and the graph represents densitometry data (A, right). − indicates no treatment. Data are mean±SD (n=6); **P<0.01. C, ERK5 expression in peritoneal macrophages isolated from nontransgenic littermate control (NLC; LysCre+/−) and LysCre+/−ERK5fl/fl (ERK5-MKO) mice. Cell lysates were immunoblotted for total ERK5, ERK1/2, and tubulin. n=3 per genotype. D through F, Characterization of CD115+ and Gr1+ cells identified by specific immunolabeling. D and E, Representative flow cytometry results showing CD115+Gr1+/− cells in peripheral blood (PB; D) and quantified data for bone marrow (BM), peripheral blood, and peritoneal (PE; E) cells from NLC or ERK5-MKO mice. F, Maturation levels of peritoneal macrophages from NLC and ERK5-MKO mice identified by the expression of CD115 and F4/80 markers. G, Representative flow cytometery data on AC phagocytosis by NLC and ERK-MKO macrophages in vitro after 60 minutes of incubation with 5-chloromethylfluorescein diacetate (CMFDA)–labeled ACs at a 1:5 (bone marrow–derived macrophages:ACs) ratio (n=5). H through K, In vivo clearance and phagocytosis assays. H, CMFDA-labeled ACs were injected intravenously, and 12 hours later, splenic macrophages (CD11b+) that have ingested labeled ACs were quantified by flow cytometery. I, CMFDA-labeled ACs were injected into the peritoneum of NLC and ERK5-MKO mice, and 6 hours later, free fluorescent cells in the peritoneal cavity were quantified. J, Representative images showing phagocytized and free ACs. Anti-CD-11b staining (red) was used to identify macrophages. Delayed clearance of ACs by resident peritoneal macrophages in ERK5-MKO mice is illustrated. K, Phagocytic index 6 hours after AC injection. See Methods for details. H, I, and K, Data are mean±SD (n=4); *P<0.05. L, Bone marrow–derived macrophages isolated from NLC and ERK5-MKO mice were fed ACs 24 hours before refeeding them with CMFDA-labeled ACs. Macrophages with engulfed fluorescent ACs were quantified by flow cytometery 24 hours later. The phagocytic index was determined as described in Methods. Data are mean±SD (n=4); **P<0.01. Comparison between 2 independent groups was subjected to Wilcoxon rank sum test.
To determine the function of ERK5 in macrophages, we generated mice with macrophages deficient in ERK5 (ERK5flfl/LysMCre+/−; ERK5-MKO). ERK5-MKO mice showed ≈90% reduction in ERK5 protein expression in isolated peritoneal macrophages compared with those of nontransgenic littermate control (NLC) mice (Figure 1C). Up to 6 months of age, we observed no difference in size or body weight between ERK5-MKO and NLC mice (Figure IIIA in the online-only Data Supplement), and no notable differences were found in their development and organ structures at the gross anatomic level (data not shown). Complete blood cell counts were performed on these animals, and we found no difference (Figure I in the online-only Data Supplement). Next we examined cells isolated from bone marrow, peripheral blood, and peritoneal fluid of NLC and ERK5-MKO mice (Figure 1D, 1E, and 1F). Compared with NLC mice, ERK5-MKO mice had similar numbers of monocytes (CD115+/Gr1+) in bone marrow but had more inflammatory (classic) monocytes (CD115+Gr1+) in peripheral blood and peritoneal fluid and less resident (nonclassic) monocytes (CD115+Gr1−) in peripheral blood (Figure 1D and 1E). There was no significant difference in the level of peritoneal fluid macrophages positive for F4/80, a maturation marker, between these mice (Figure 1F).
To determine the role of ERK5 in phagocytosis by macrophages, BMDMs were fed CMFDA-FITC–labeled ACs, and clearance of these fluorescent cells was quantified by flow cytometry. As shown in Figure 1G, phagocytotic activity of ERK5-MKO macrophages was lower by ≈44% compared with that of NLC counterparts. Next we examined AC clearance in vivo. We injected CMFDA-FITC–labeled ACs into NLC and ERK5-MKO mice, and phagocytosis by CD11b+ splenic macrophages was measured. Although we injected the same number of fluorescent cells, phagocytosis by ERK5-depleted macrophages was severely compromised (Figure 1H). Furthermore, resident peritoneal macrophages in ERK5-MKO mice showed a reduced capacity for clearance of fluorescent ACs after 6 hours of injection (Figure 1I, 1J, and 1K). ERK5-deficient macrophages also exhibited reduced ability to ingest ACs (Figure 1I, 1J, and 1K). To test whether ACs accelerate their own clearance by stimulating macrophages, BMDMs were primed by feeding them with unlabeled ACs and then feeding them again, this time with fluorescent ACs, and uptake of fluorescent cells was measured. Priming of macrophages from NLC mice increased their phagocytic capacity, whereas no significant priming was seen in ERK5-MKO macrophages (Figure 1L). These results indicate the critical role of ERK5 in the regulation of phagocytosis by macrophages.
ERK5 Regulates Efferocytosis-Related Gene Expression and M1/M2-Type Polarization
To investigate the molecular mechanisms by which ERK5 regulates the capacity of phagocytosis and clearance of ACs, we investigated the expression of efferocytosis-related genes. We found a decreased level of PPARδ mRNA and a significant decrease in PPARδ protein expression in ERK5-MKO macrophages (Figure 2A, 2C, and 2D). Next we examined the expression of the following opsonins: c-mer proto-oncogene tyrosine kinase (Mer-tK), complement component 1a (C1qa), complement component 1b (C1qb), complement component 1c (C1qc), growth arrest-specific 6 (Gas6), Mfg-e8, Thbs1, and annexin A1 (Anxa1). Using quantitative reverse transcription polymerase chain reaction, we found that the expression of these opsonins, but not of CD36 and CD68, was reduced by ≈40% to 80% in ERK5-MKO compared with NLC peritoneal fluid macrophages (Figure 2B). Western blot analyses revealed a similar reduction in protein levels, although a less significant reduction in the annexin A1 protein level in ERK5-MKO cells was noted (Figure 2C).
Figure 2.

Macrophage ERK5 regulates expression of efferocytosis-related genes. A through C, Relative mRNA (A and B) and protein (C) expression of peroxisome proliferator-activated receptors (PPARs) and opsonins in nontransgenic littermate control (NLC) and ERK5-MKO peritoneal macrophages were determined by quantitative reverse transcription polymerase chain reaction or Western blotting, respectively. Data are mean±SD (n=4–5). CD36 and CD68 were used as control genes. *P<0.05. D, Quantification of PPARδ expression is shown as fold change compared with NLC bone marrow–derived macrophages after normalization to the internal tubulin control. Data are mean±SD (n=6); **P<0.01. E, Overexpression of CA-MEK5α in bone marrow–derived macrophages increases mRNA expression of opsonins. Relative mRNA levels of indicated opsonins were assessed by quantitative reverse transcription polymerase chain reaction after Ad-CA-MEK5α or Ad-LacZ transduction. Data are mean±SD (n=4); *P<0.05. Hemagglutinin-tagged CA-MEK5α expression was detected by immunoblotting with anti-hemagglutinin (E, inserted panel). F and G, Overexpression of CA-MEK5α increased Thbs1 (F) and Mfg-e8 (G) promoter activity via PPARδ. RAW264.7 cells were transfected with control siRNA (si-Control) or PPARδ siRNA (si-PPARδ) for 48 hours followed by transfection of Thbs1-luc or Mfg-e8-luc promoter for an additional 18 hours. The cells were transfected with ERK5 or CA-MEK5α and then assayed for firefly and Renilla luciferase activities. Data are mean±SD (n=6); *P<0.05, **P<0.01. H, Depletion of PPARδ protein by siRNA was confirmed by immunoblotting with anti-PPARδ and antitubulin (control). Comparison between 2 independent groups was subjected to Wilcoxon rank sum test. F and G, Subjected to multiple group analysis with Kruskal-Wallis test followed by Dunn post hoc analysis.
We then investigated the role of ERK5 in opsonin expression by gain-of-function studies. When primary BMDMs from wild-type mice were transduced by an adenovirus containing a constitutively active form of MEK5α (Ad-CA-MEK5α), opsonin mRNA levels, especially those of Mfg-e8 and Thbs1, were significantly increased compared with macrophages transduced with Ad-LacZ (Figure 2E). In addition, constitutively active form of MEK5α increased Thbs1 and Mfg-e8 promoter activity in a PPARδ-dependent manner in macrophages, suggesting that ERK5 regulates transcription of certain opsonins at least in part via PPARδ (Figure 2F through 2H). We found that mRNA expression of the eat-me signaling molecules including opsonins, T-cell immunoglobulin and mucin-domain-containing molecule, TYRO3 protein tyrosine kinase 3, integrin alpha V, brain-specific angiogenesis inhibitor 1, stabilin2, ras-related C3 botulinum toxin substrate 1 (Figure 3A and 3B), of the find-me ligands such as sphingosine-1-phosphate receptor 1 and chemokine (C-X3-Cmotif) ligand 1 and of the find-me receptors G protein-coupled receptor 132 and purinergic receptor P2Y, G-protein coupled 2 (Figure 3C) were all increased after AC feeding to macrophages isolated from NLC but not in those from ERK5-MKO mice. This is in sharp contrast to the case of PPARδ whose depletion in macrophages did not affect the expression of eat-me signal receptors.12
Figure 3.
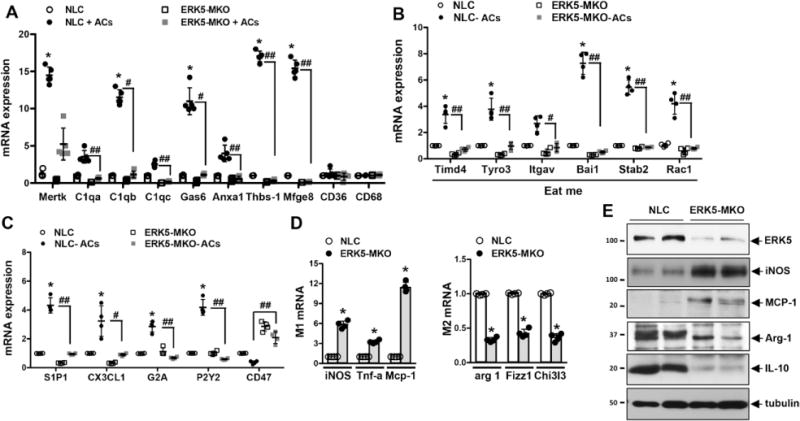
ERK5 has a key role in induction by apoptotic cell (AC) feeding of efferocytosis-related genes in cultured bone marrow–derived macrophages. A through C, Incubation of bone marrow–derived macrophages with ACs for 16 hours increased mRNA expression of opsonins (n=5; A) and proteins involved in “eat-me” (n=4; B) and “find-me” (n=4; C) signals in an ERK5-dependent manner. Downregulation of CD47 (don’t-eat-me signal) expression by AC feeding did not occur in ERK5-MKO macrophages. Data are mean±SD. NLC vs nontransgenic littermate control (NLC)+ACs, *P<0.05, **P<0.01; NLC+ACs vs ERK5-MKO+ACs, #P<0.05, ##P<0.01. D, Relative mRNA levels of inflammatory (left) and anti-inflammatory (right) genes in bone marrow–derived macrophages isolated from NLC or ERK5-MKO mice were assessed by quantitative reverse transcription polymerase chain reaction. Data are mean±SD (n=4); *P<0.05, **P<0.01. E, Protein expressions of inflammatory (inducible nitric oxide synthase [iNOS] and monocyte chemotactic protein-1 [MCP-1]) and anti-inflammatory (arginine [Arg]-1 and interleukin-10 [IL-10]) proteins in bone marrow–derived macrophages isolated from NLC or ERK5-MKO mice were assessed by Western blotting. Comparison between 2 independent groups was subjected to Wilcoxon rank sum test. A, B, and C, Subjected to multiple group analysis with Kruskal-Wallis test followed by Dunn post hoc analysis.
Because a decrease in interleukin-10 (IL-10) and an increase in interferon-γ in Mfg-e8−/− macrophages have been reported,9 we investigated whether ERK5 could modulate the M1/M2 macrophage polarization status. At the basal level, we found that BMDMs isolated from ERK5-MKO animals had higher expression levels of M1-related genes such as inducible nitric oxide synthase, tumor necrosis factor-α, and Mcp-1 and lower levels of M2-related genes such as arginase 1, resisin-like molecule α-1, and chitinase 3–like 3, demonstrating that ERK5 activation promotes M2 genes (Figure 3D). In parallel, we found increased protein expression of inducible nitric oxide synthase and monocyte chemotactic protein-1 (MCP-1) and decreased expression of Arg-1 and IL-10 in the peritoneal macrophages isolated from ERK5-MKO compared with NLC mice (Figure 3E).
Mfg-e8 Secretion and Phagocytic Capacity Are Regulated by ERK5
To determine whether opsonins secreted into the serum contribute to ERK5-mediated AC clearance by macrophages, we treated BMDMs with the serum obtained from ERK5-MKO or NLC mice. Incubation of BMDMs from NLC mice with the ERK5-MKO mouse serum reduced their phagocytic capacity, whereas the serum from NLC mice rescued the phagocytic defect observed in ERK5-MKO BMDMs (Figure 4A). Furthermore, addition of purified recombinant human Mfg-e8 to ERK5-MKO BMDMs improved their phagocytic capacity to ≈80% of the normal level by NLC cells (Figure 4B). Treatment of these cells with Thbs1 also improved their phagocytic ability (Figure V in the online-only Data Supplement). Consistent with these observations were reduced levels of Mfg-e8 in the serum of ERK5-MKO mice detected by enzyme-linked immunosorbent assay (Figure 4C) and an immunoprecipitation assay (Figure 4D). Finally, we determined opsonin levels in the liver of the mice because Kupffer cells are the primary source of circulating opsonins.18 As expected, the opsonin expression in the ERK5-MKO mouse liver was significantly lower than that in NLC mice (Figure 4E).
Figure 4.
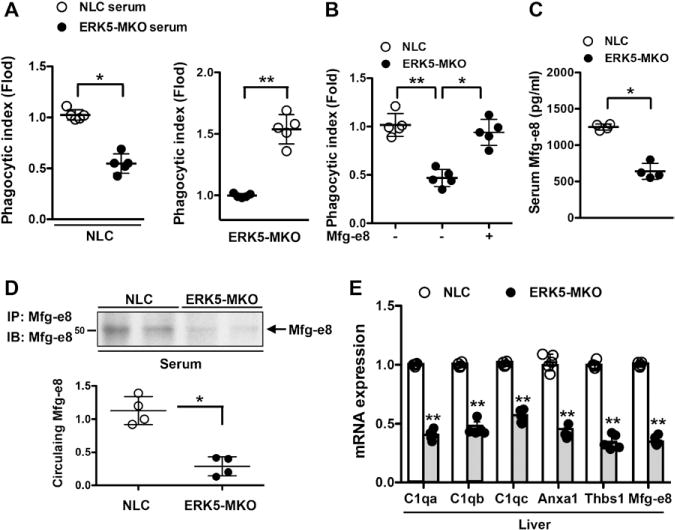
ERK5 regulates phagocytic capacity of macrophages via Mfg-e8 secretion. A and B, Reduced phagocytic capacity of ERK5-MKO macrophages was restored by serum from nontransgenic littermate control (NLC) mice (A) or purified recombinant Mfg-e8 (B). NLC and ERK5-MKO bone marrow–derived macrophages were pretreated with serum from NLC or ERK5-MKO mice (A) or purified Mfg-e8 (11 μg/mL; B) for 24 hours, and the phagocytic index was analyzed by incubation with 5-chloromethylfuorescein diacetate–labeled apoptotic cells at a 1:5 (bone marrow–derived macrophages:apoptotic cells) ratio for 60 minutes, as described in Figure 1. Data are mean±SD (n=5); *P<0.05, **P<0.01. C, Decreased levels of Mfg-e8 in the serum of ERK5-MKO mice as quantified by enzyme-linked immunosorbent assay. Data are mean±SD (n=4); **P<0.01. D, Circulating Mfg-e8 was determined by immunoprecipitating (IP) Mfg-e8 from serum followed by immunoblotting (IB) with anti-Mfg-e8 (top); graph represents densitometry data (bottom). Data are mean±SD (n=4); **P<0.01. E, ERK5 regulates opsonin expression in the liver. Relative mRNA levels of indicated opsonins in the liver of NLC and ERK5-MKO mice were assessed by quantitative reverse transcription polymerase chain reaction. Data are mean±SD (n=5); *P<0.05, **P<0.01. Comparison between 2 independent groups was subjected to Wilcoxon rank sum test.
Statins Induce Opsonin Expression via ERK5 Activation
Statins can increase efferocytosis,6,19 but the mechanism is unknown. We asked whether macrophage ERK5 had a role in statin-induced efferocytosis. We found that pitavastatin significantly increased ERK5 phosphorylation and transcriptional activity in both mouse BMDMs (Figure 5A and 5B) and THP-1 cells (human monocyte/macrophage cell line; Figure VIA and VIB in the online-only Data Supplement). The level of pitavastatin-induced ERK5 transcriptional activation was comparable to that obtained by AC feeding (Figure 5C). Furthermore, pitavastatin significantly increased opsonin expression (Figure VIC in the online-only Data Supplement) and the promoter activity of Thbs1 and Mfg-e8 in macrophages, all of which were inhibited by the depletion of ERK5 (Figure 5D and 5E). Interestingly, opsonin mRNA expression levels in the liver were also significantly increased by pitavastatin injection in NLC mice (Figure 5F) but not in ERK5-MKO mice (Figure VII in the online-only Data Supplement). These results show a crucial role of macrophage ERK5 in statin-induced enhancement of efferocytosis.
Figure 5.

Pitavastatin (Pita.) upregulates opsonin expression via ERK5 activation. A, Pitavastatin increased ERK5 phosphorylation in bone marrow–derived macrophages isolated from nontransgenic littermate control (NLC) mice after 3 hours of treatment. B, RAW264.7 cells were transfected with pBind-ERK5 and pG5-luc for 18 hours, and then ERK5 transcriptional activity was assessed after 6 hours of pitavastatin treatment or Ad-CA-MEK5αtransduction. Data are mean±SD (n=5); **P<0.01. C, Incubation of RAW264.7 cells with 1 μmol/L pitavastatin or apoptotic cells (ACs), but not necrotic cells (NCs), for 6 hours increased ERK5 transcriptional activity. Vehicle (veh) was phosphate-buffered saline. Data are mean±SD (n=5); **P<0.01. D, Relative mRNA levels of indicated opsonins and receptors in NLC and ERK5-MKO bone marrow–derived macrophages treated for 18 hours with 1 μmol/L pitavastatin were assessed by quantitative reverse transcription polymerase chain reaction. Data are mean±SD (n=5). NLC vs NLC bone marrow–derived macrophages, *P<0.05, **P<0.01; NLC bone marrow–derived macrophages vs NLC bone marrow–derived macrophages+pitavastatin, #P<0.05, ##P<0.01. E, Pitavastatin increases Thbs1 and Mfg-e8 promoter activities. NLC and ERK5-MKO bone marrow–derived macrophages were transfected with Thbs1-luc or Mfg-e8-luc for 18 hours and stimulated with 1 μmol/L pitavastatin for 8 hours. The cells were assayed for firefly and Renilla luciferase activities. Data are mean±SD (n=5); *P<0.05, **P<0.01. F, Relative mRNA levels of indicated opsonins in the liver from NLC mice after 18 hours of pitavastatin treatment (40 mg/kg) were assessed by quantitative reverse transcription polymerase chain reaction. Data are mean±SD (n=5); *P<0.05, **P<0.01. Comparison between 2 independent groups was subjected to Wilcoxon rank sum test. B through E, Subjected to multiple group analysis with Kruskal-Wallis test followed by Dunn post hoc analysis.
Macrophage ERK5 Deficiency Accelerates Formation of Atherosclerotic Plaques and Necrotic Cores
To determine the role of macrophage ERK5 in the development of atherosclerosis, NLC and ERK5-MKO mice were bred into the LDLR−/− background and fed a high-cholesterol diet for 8 and 16 weeks. No differences were noted in their body weight, blood content of total, LDL, and high-density lipoprotein cholesterol levels, and blood glucose tolerance test (Figures III and VIIIA in the online-only Data Supplement). However, the atherosclerotic lesion area observed in the en face sample of the aorta was significantly larger in ERK5-MKO/LDLR−/− than in NLC/LDLR−/− mice (Figure 6A and 6B and Figure VIIIB in the online-only Data Supplement). Increased lesion size was also noted in histological cross sections at the aortic valve area in ERK5-MKO/LDLR−/− animals compared with NLC/LDLR−/− mice (Figure 6C and 6D and Figure VIIIC in the online-only Data Supplement). Plaque necrosis is a consequence of apoptotic cell accumulation in advanced lesions.2,20 We therefore assessed the effect of depleted macrophage ERK5 on AC accumulation identified by both apoptotic marker expression and loss of cellular integrity (Figure 7A through 7C). We found that the number of terminal deoxynucleotidyl transferase–mediated dUTP nick end labeling (TUNEL)–positive nuclei was significantly increased in ERK5-MKO/LDLR−/− lesions with larger necrotic cores compared with NLC/LDLR−/− mice (Figure 7A through 7C and 7E). Staining with anti-activated caspase 3 also gave the same results (Figure 7D). We also detected an increased number of TUNEL-positive cells with cellular degradation and disintegration, which are known to be present in the advanced stage of apoptosis,10,21 in ERK5-MKO/LDLR−/− compared with NLC/LDLR−/− mice (Figure 7A through 7C). These data suggest that such advanced stage plaques develop as efferocytosis is severely compromised in ERK5-MKO macrophages. To examine whether the ERK5-null condition makes macrophages more susceptible to apoptosis, we treated BMDMs with oxidized LDL. This treatment significantly increased TUNEL staining–positive cells and cleaved caspase 3 expressions in both ERK5-MKO and NLC BMDMs (Figure 7F, 7G, and 7H), suggesting that apoptotic cell accumulation observed in the lesions of ERK5-MKO/LDLR−/− mice was not caused by increased apoptosis of ERK5-null cells but was due to defective clearance of ACs. Next we examined composition of immune cells and smooth muscle cells in the lesions of ERK5-MKO/LDLR−/− compared with NLC/LDLR−/− mice by immunohistochemistry analysis using the following proteins: macrophages (anti-Mac3), T cells (anti-CD3), and smooth muscle cells (anti-α-smooth muscle actin). As shown in Figure IX in the online-only Data Supplement, increased macrophage content in lesions of ERK5-MKO/LDLR−/− compared with NLC/LDLR−/− mice were detected. However, the total number of T lymphocytes was not different between the 2 groups. Lesions in ERK5-MKO/LDLR−/− mice displayed increased cases of necrotic core formation. In contrast, the relative smooth muscle cell content was significantly less in the total lesions of the ERK5-MKO/LDLR−/− mice, which represents the composition of vulnerable plaques. We also detected macrophage inflammatory mediators in the lesion by immunohistochemistry using anti-MCP-1 (M1 phenotype) and anti-IL-10 (M2 phenotype). We found increased MCP-1 expression but decreased IL-10 expression in the intimal lesions of ERK5-MKO/LDLR−/− compared with those in NLC/LDLR−/− mice (Figure 7I), which support in vitro data presented in Figure 3D and 3E.
Figure 6.
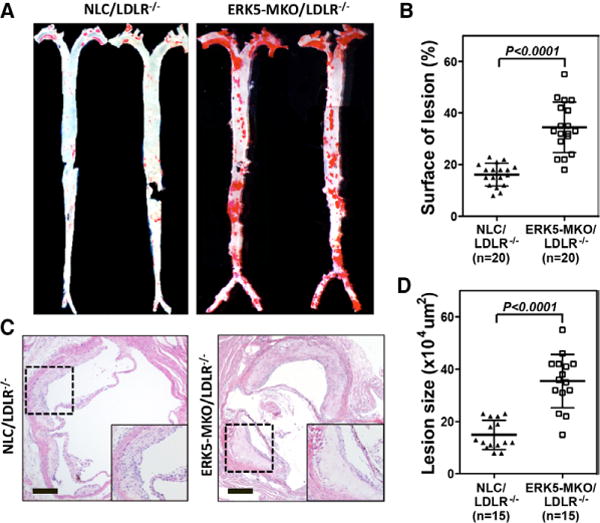
Accelerated atherosclerotic plaque formation in ERK-MKO/low-density lipoprotein receptor (LDLR)−/− mice. A, Whole aortas from each mouse group were stained by Oil-red O. C, Sections from the proximal aortas of each group were stained by hematolylin-eosin. Bars, 10 μm. B and D, The area covered by Oil-red O staining is expressed as percentage of the total surface area of aorta from nontransgenic littermate control (NLC)/LDLR−/− and ERK5-MKO/LDLR−/− mice (B). The area of atherosclerotic plaques in sections of the proximal aorta was measured (D). Data are mean±SD (B, n=20; D, n=15 per genotype); **P<0.01. Comparison between 2 independent groups was subjected to Wilcoxon rank sum test.
Figure 7.
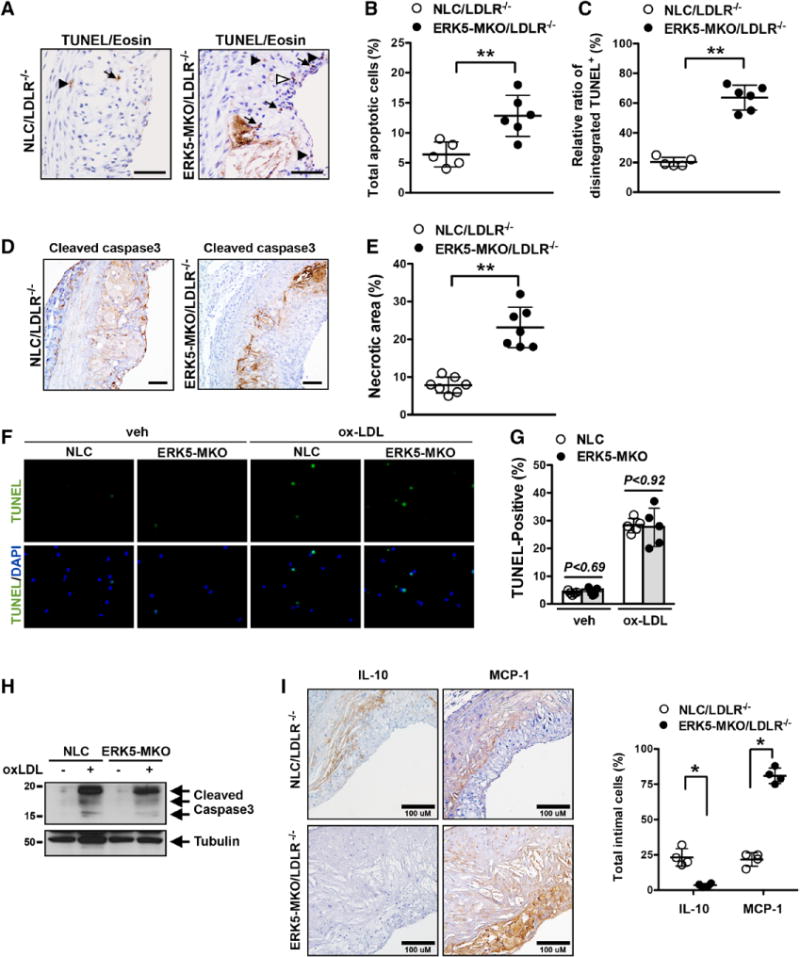
Increased apoptotic cell accumulation and necrotic core formation in ERK-MKO/low-density lipoprotein receptor (LDLR)−/− mice. A through C, Sections of proximal aortas from each group were labeled by terminal deoxynucleotidyl transferase–mediated dUTP nick end labeling (TUNEL) to detect apoptotic cells and counterstained with eosin to detect nuclei. Total TUNEL-positive (TUNEL+) cells were subdivided into intact (arrows) and disintegrated (sum of fragmented [open arrowhead] and degraded [closed arrowhead]) cells. Bars, 50 μm. B, Graph shows the percentage of TUNEL-positive cells (TUNEL+ cells/total cells counted) in the lesion area. More than 200 cells were counted in each section (n=5–6 per genotype). **P<0.01. C, The percentage of disintegrated TUNEL-positive cells (disintegrated TUNEL+ cells/total TUNEL+ cells) in the lesion area (n=5–6 per genotype). **P<0.01. D, Cleaved caspase 3 staining in the lesion area. Bars, 40 μm. E, Area occupied by the necrotic core (acellular lipid core) is shown as percentage of total lesion area. Data are expressed as mean±SD (n=7 per genotype); **P<0.01. F, Apoptosis was induced by incubation with oxidized low-density lipoprotein (ox-LDL; 100 μg/mL) or phosphate-buffered saline vehicle (veh) for 24 hours in peritoneal macrophages isolated from ERK5-MKO or nontransgenic littermate control (NLC) mice and detected by TUNEL staining. G, Percentage of TUNEL-positive cells. Data are mean±SD (n=5 per genotype). H, Cleaved caspase-3 expression induced by oxidized low-density lipoprotein in peritoneal macrophages isolated from ERK5-MKO or NLC mice. I, Area of atherosclerotic plaques in sections of the proximal aorta was stained with an antibody against monocyte chemotactic protein-1 (MCP-1; M1 phenotype) or interleukin-10 (IL-10; M2 phenotype), and values represent the number of MCP-1 or IL-10 cells/% of total intimal lesion area. Data are mean±SD (n=4 per genotype); **P<0.01. Comparison between 2 independent groups was subjected to Wilcoxon rank sum test.
Advanced plaques lead to plaque rupture.2–4 We analyzed collagen contents and fibrous cap thickness of advanced lesions at the level of aortic valves. Mice were fed a high-cholesterol diet for 16 weeks, and histological sections were examined after Masson trichrome staining. We found a 30% decrease in collagen content (Figure 8A and 8B) and a 45% decrease in fibrous cap thickness of lesions (Figure 8C and 8D) in ERK5-MKO/LDLR−/− compared with NLC/LDLR−/− mice. Because the thickness of fibrous caps was not reduced in Mfg-e8 and Thbs1 knockout mice,2,10 we examined the expression and localization of Mfg-e8 in atherosclerotic lesions of mice fed a high-cholesterol diet for 8 and 16 weeks (Figure 8E). Mfg-e8 was highly expressed in the plaque of the 8-week samples of NLC/LDLR−/− mice compared with ERK5-depleted mice and the 16-week samples of both genotypes. Mfg-e8–positive cells were also positive for Mac3 (a macrophage marker) but not for a smooth muscle cell marker (α-smooth muscle actin) in NLC/LDLR−/− mice. Although Mac3 staining was increased in the 16-week samples of ERK5-MKO/LDLR−/− mice, Mfg-e8 expression was reduced in the same area (Figure 8E), suggesting that ERK5 deficiency decreased Mfg-e8 expression in macrophages.
Figure 8.
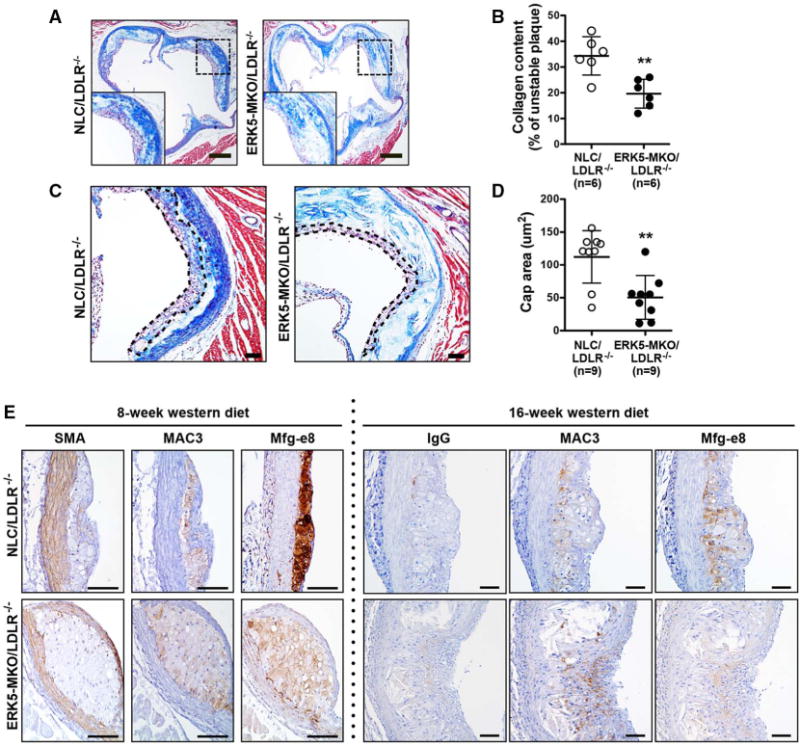
Collagen content, fibrous cap thickness, and opsonin expression in atherosclerotic plaques in ERK-MKO mice. A and C, Masson trichrome staining for collagen (blue) in the lesions of nontransgenic littermate control (NLC)/low-density lipoprotein receptor (LDLR)−/− and ERK5-MKO/LDLR−/− mice. Bars, 60 μm. B, Collagen in the lesion areas is expressed as the ratio of collagen (blue)/total intimal lesion area. Data are mean±SD (n=9 per genotype); **P<0.01. C, The area outlined by dotted lines is the fibrous cap, and the distance between dotted lines was measured as the thickness of fibrous caps. The fibrous cap area (purple and blue) is composed of smooth muscle cells, macrophages, foam cells, and collagen. Bars, 100 μm. D, Fibrous cap thickness is quantified in the advanced lesions. Data are mean±SD (n=9 per genotype); **P<0.01. Bars, 60 μm. E, Expression and localization of Mfg-e8 in advanced atherosclerotic lesions after feeding of Western diet for 8 and 16 weeks. Sections from the proximal aortas of each group were stained by control IgG or antibodies against smooth muscle actin (SMA), Mac-3, or Mfg-e8. Bars, 50 μm. Comparison between 2 independent groups was subjected to Wilcoxon rank sum test.
Discussion
During the past decade, evidence has accumulated supporting the hypothesis that atherosclerotic plaque formation is an inflammatory process. However, there is little evidence that anti-inflammatory agents are useful for the prevention of cardiovascular diseases, including atherosclerosis.22,23 In contrast, beneficial effects of statins on preventing coronary events, which are independent of its effect on plasma lipid levels, have been recognized.5 Although statins have been suggested to inhibit inflammation24 and macrophage proliferation,25 the mechanism of such effects of statins is unknown. In this study, we found that statins increased ERK5 kinase activity in macrophages and increased their phagocytic capacity. This effect was accompanied by increased expression of efferocytosis-related genes such as opsonins and molecules involved in eat-me and find-me signaling. Thus, statins appear to activate these signaling cascades that are a part of the normal defense mechanism of macrophages, which is activated when macrophages come in contact with ACs, targets of macrophage efferocytosis. These “off-target” beneficial effects of statins are mediated by macrophage ERK5, as demonstrated by our studies with the use of a macrophage-specific ERK5 knockout mouse model.
It has been reported that a nuclear receptor, PPARδ, works as a sensor of dying cells and orchestrates phagocytic responses.12 Because we have reported that ERK5 can regulate the transcriptional activity of PPARs,13 we initially hypothesized that ERK5 may regulate phagocytosis through altering PPAR expression or activation. In this study, we found a significant decrease in PPARδ mRNA in ERK5-MKO macrophages, but a less robust reduction in its protein level was noted in these cells. A small but significant reduction in PPARδ expression in the intima was also detected in vivo by immunocytochemistry (P<0.0377 compared with NLC/LDLR−/−; Figure X in the online-only Data Supplement). It has been suggested that activation of PPARs by ligands can increase PPAR expression in a positive feedback manner.26,27 It is possible that this small reduction in PPARδ expression is due to the inhibition of PPAR transcriptional activity in ERK5-deleted macrophages. Because depletion of PPARδ by siRNA inhibits CA-MEK5–mediated Thbs1 and Mfg-e8 promoter activity, ERK5-mediated PPARδ transcriptional activity may also be involved in some way in this regulation (Figure 2E and 2F). In PPARδ−/− mice, the expression of only opsonins but not eat-me receptors was downregulated.11 However, our study shows that ERK5 regulates the expression of not only opsonins but also other efferocytosis-related gene sets, including eat-me and find-me molecules, indicating a more comprehensive role of ERK5 than PPARδ in regulating efferocytosis.
Deficiency in macrophage Mfg-e8 or Thbs1 has been shown to cause accumulation of ACs in the necrotic core, resulting in formation of large necrotic cores such as those found in advanced lesions in LDLR−/− and apolipoprotein E−/− mice.2,10 In agreement with these reports, we found that macrophage ERK5 depletion in LDLR−/− mice resulted in accelerated formation of atherosclerotic lesions containing large necrotic cores with many more ACs compared with NLC/LDLR−/− mice (Figures 5 and 6). Interestingly, however, we found less collagen content and a thinner fibrous cap in the atherosclerotic plaque of ERK5-MKO/LDLR−/− mice compared with NLC/LDLR−/− mice (Figure 8A through 8D). These plaque phenotypes are different from the reported phenotypes of Mfg-e8 and Thbs1 knockout mice.9,10 Our study may suggest that depletion of macrophage ERK5 results in more advanced and vulnerable plaques than those in Mfg-e8 and Thbs1 knockout mice. This effect, however, cannot be explained solely by the role of ERK5 in regulating opsonin expression. As shown in Figure 3, ERK5 regulates not only opsonin expression but also eat-me and find-me signaling-related molecules and M1/M2 polarization. To express this in a different way, our study indicates that ERK5 is a more global regulator of macrophage efferocytosis, which may explain the superior effect of statins on inhibiting coronary events compared with other anti-inflammatory reagents.
ERK5 can affect various macrophage functions that are dissimilar, such as proliferation28 and inflammation.29 It is well known that a signaling molecule can cause 2 opposite effects on the basis of its different compartmentalization, interacting partners, and posttranslational modifications. For example, SUMOylated cytosolic p53 is proapoptotic, whereas non-SUMOylated nuclear p53 is antiapoptotic.30 As for ERK5, it is proproliferative under colony-stimulating factor 1 stimulation,28 but, as we have shown in this study, activation of ERK5 by statin inhibits macrophage proliferation.6,19 Furthermore, ERK5 activation by adenovirus of constitutively active form of MEK5α could not upregulate macrophage proliferation (Figure XI in the online-only Data Supplement), suggesting that ERK5 activation is necessary but not sufficient for increasing macrophage proliferation.
In summary, we have shown that macrophage ERK5 is important not only for AC-induced efferocytosis but also for statin-induced clearance of ACs. Activation of ERK5 increases the expression of a broad range of antiatherogenic molecules such as opsonins and eat-me and find-me signaling molecules in macrophages and also promotes their M2 polarization state. These multifaceted effects of ERK5 activation may explain the superior effect of statins, which robustly activates macrophage ERK5, on preventing coronary events compared with other anti-inflammatory agents.31 We suggest that our new findings on the role of macrophage ERK5 in efferocytosis will provide a new therapeutic strategy for reducing atherosclerosis and vulnerable plaque formation in advanced plaques.
Supplementary Material
CLINICAL PERSPECTIVE.
The crucial role of inflammation during the process of atherosclerosis has been well established. However, the recent unsuccessful clinical trials in which anti-inflammatory agents were used for suppressing cardiovascular events suggest the complexity of this process, and we may need to consider additional factors. Now emerging evidence indicates efferocytosis (phagocytotic clearance) by macrophages playing an important role in reducing atherosclerotic plaque formation. Although statins can increase efferocytosis, the mechanism is unknown. In this study, we have shown that macrophage ERK5 activation is essential not only for efferocytosis induced by the presence of apoptotic cells but also for statin-induced clearance of apoptotic cells. Activation of ERK5 increases the expression of a broad range of antiatherogenic molecules such as opsonins and “eat-me” and “find-me” signaling molecules in macrophages and also promotes their M2 polarization state. Thus, statins appear to activate these signaling cascades that are a part of the normal defense mechanism of macrophages, which is activated when macrophages come in contact with apoptotic cells, targets of macrophage efferocytosis. These “off-target” beneficial effects of statins are mediated by macrophage ERK5, as we demonstrated using a macrophage-specific ERK5 knockout mouse model. These multifaceted effects of ERK5 activation may explain the superior effect of statins, which robustly activate macrophage ERK5, on preventing coronary events compared with other anti-inflammatory agents. Our findings reported here provide a new therapeutic strategy for controlling atherosclerosis and vulnerable plaque formation.
Acknowledgments
We thank the University of Rochester School of Medicine and Dentistry Flow Cytometry Core for technical support, Cathy Tournier for kindly providing foxed ERK5 mice, and Carolyn J. Giancursio for technical assistance.
Sources of Funding
This work is supported by grants from the National Institutes of Health to Dr Abe (HL-108551, HL-064839, and HL-102746) and from the American Heart Association to Drs Fujiwara (11GRNT5850001) and Heo (12SDG11690003).
Footnotes
Disclosures
None.
The online-only Data Supplement is available with this article at http://circ.ahajournals.org/lookup/suppl/doi:10.1161/CIRCULATIONAHA.113.005991/-/DC1.
References
- 1.Seimon TA, Wang Y, Han S, Senokuchi T, Schrijvers DM, Kuriakose G, Tall AR, Tabas IA. Macrophage deficiency of p38alpha MAPK promotes apoptosis and plaque necrosis in advanced atherosclerotic lesions in mice. J Clin Invest. 2009;119:886–898. doi: 10.1172/JCI37262. [DOI] [PMC free article] [PubMed] [Google Scholar]
- 2.Thorp E, Tabas I. Mechanisms and consequences of efferocytosis in advanced atherosclerosis. J Leukoc Biol. 2009;86:1089–1095. doi: 10.1189/jlb.0209115. [DOI] [PMC free article] [PubMed] [Google Scholar]
- 3.Tabas I. Macrophage death and defective inflammation resolution in atherosclerosis. Nat Rev Immunol. 2010;10:36–46. doi: 10.1038/nri2675. [DOI] [PMC free article] [PubMed] [Google Scholar]
- 4.Lauber K, Blumenthal SG, Waibel M, Wesselborg S. Clearance of apoptotic cells: getting rid of the corpses. Mol Cell. 2004;14:277–287. doi: 10.1016/s1097-2765(04)00237-0. [DOI] [PubMed] [Google Scholar]
- 5.Kones R. Primary prevention of coronary heart disease: integration of new data, evolving views, revised goals, and role of rosuvastatin in management: a comprehensive survey. Drug Des Devel Ther. 2011;5:325–380. doi: 10.2147/DDDT.S14934. [DOI] [PMC free article] [PubMed] [Google Scholar]
- 6.Morimoto K, Janssen WJ, Fessler MB, McPhillips KA, Borges VM, Bowler RP, Xiao YQ, Kench JA, Henson PM, Vandivier RW. Lovastatin enhances clearance of apoptotic cells (efferocytosis) with implications for chronic obstructive pulmonary disease. J Immunol. 2006;176:7657–7665. doi: 10.4049/jimmunol.176.12.7657. [DOI] [PubMed] [Google Scholar]
- 7.Ravichandran KS. Find-me and eat-me signals in apoptotic cell clearance: progress and conundrums. J Exp Med. 2010;207:1807–1817. doi: 10.1084/jem.20101157. [DOI] [PMC free article] [PubMed] [Google Scholar]
- 8.Hatano N, Sugiyama M, Watanabe T, Atomi Y. Opsonin receptor expression on peritoneal exudative and circulatory neutrophils in murine acute pancreatitis. Pancreas. 2001;23:55–61. doi: 10.1097/00006676-200107000-00008. [DOI] [PubMed] [Google Scholar]
- 9.Ait-Oufella H, Kinugawa K, Zoll J, Simon T, Boddaert J, Heeneman S, Blanc-Brude O, Barateau V, Potteaux S, Merval R, Esposito B, Teissier E, Daemen MJ, Lesèche G, Boulanger C, Tedgui A, Mallat Z. Lactadherin deficiency leads to apoptotic cell accumulation and accelerated atherosclerosis in mice. Circulation. 2007;115:2168–2177. doi: 10.1161/CIRCULATIONAHA.106.662080. [DOI] [PubMed] [Google Scholar]
- 10.Moura R, Tjwa M, Vandervoort P, Van Kerckhoven S, Holvoet P, Hoylaerts MF. Thrombospondin-1 deficiency accelerates atherosclerotic plaque maturation in ApoE−/− mice. Circ Res. 2008;103:1181–1189. doi: 10.1161/CIRCRESAHA.108.185645. [DOI] [PubMed] [Google Scholar]
- 11.Mukundan L, Odegaard JI, Morel CR, Heredia JE, Mwangi JW, RicardoGonzalez RR, Goh YP, Eagle AR, Dunn SE, Awakuni JU, Nguyen KD, Steinman L, Michie SA, Chawla A. PPAR-delta senses and orchestrates clearance of apoptotic cells to promote tolerance. Nat Med. 2009;15:1266–1272. doi: 10.1038/nm.2048. [DOI] [PMC free article] [PubMed] [Google Scholar]
- 12.Abderrahmani A, Cheviet S, Ferdaoussi M, Coppola T, Waeber G, Regazzi R. ICER induced by hyperglycemia represses the expression of genes essential for insulin exocytosis. EMBO J. 2006;25:977–986. doi: 10.1038/sj.emboj.7601008. [DOI] [PMC free article] [PubMed] [Google Scholar]
- 13.Woo CH, Massett MP, Shishido T, Itoh S, Ding B, McClain C, Che W, Vulapalli SR, Yan C, Abe J. ERK5 activation inhibits inflammatory responses via peroxisome proliferator-activated receptor delta (PPARdelta) stimulation. J Biol Chem. 2006;281:32164–32174. doi: 10.1074/jbc.M602369200. [DOI] [PubMed] [Google Scholar]
- 14.Gutkind JS. Regulation of mitogen-activated protein kinase signaling networks by G protein-coupled receptors. Sci STKE. 2000;2000:re1. doi: 10.1126/stke.2000.40.re1. [DOI] [PubMed] [Google Scholar]
- 15.Akaike M, Che W, Marmarosh NL, Ohta S, Osawa M, Ding B, Berk BC, Yan C, Abe J. The hinge-helix 1 region of peroxisome proliferator-activated receptor gamma1 (PPARgamma1) mediates interaction with extracellular signal-regulated kinase 5 and PPARgamma1 transcriptional activation: involvement in flow-induced PPARgamma activation in endothelial cells. Mol Cell Biol. 2004;24:8691–8704. doi: 10.1128/MCB.24.19.8691-8704.2004. [DOI] [PMC free article] [PubMed] [Google Scholar]
- 16.Woo CH, Abe J. SUMO: a post-translational modification with therapeutic potential? Curr Opin Pharmacol. 2010;10:146–155. doi: 10.1016/j.coph.2009.12.001. [DOI] [PMC free article] [PubMed] [Google Scholar]
- 17.Scott RS, McMahon EJ, Pop SM, Reap EA, Caricchio R, Cohen PL, Earp HS, Matsushima GK. Phagocytosis and clearance of apoptotic cells is mediated by MER. Nature. 2001;411:207–211. doi: 10.1038/35075603. [DOI] [PubMed] [Google Scholar]
- 18.Breitkopf K, Sawitza I, Westhoff JH, Wickert L, Dooley S, Gressner AM. Thrombospondin 1 acts as a strong promoter of transforming growth factor beta effects via two distinct mechanisms in hepatic stellate cells. Gut. 2005;54:673–681. doi: 10.1136/gut.2004.042911. [DOI] [PMC free article] [PubMed] [Google Scholar]
- 19.Ohnesorge N, Viemann D, Schmidt N, Czymai T, Spiering D, Schmolke M, Ludwig S, Roth J, Goebeler M, Schmidt M. Erk5 activation elicits a vasoprotective endothelial phenotype via induction of Kruppel-like factor 4 (KLF4) J Biol Chem. 2010;285:26199–26210. doi: 10.1074/jbc.M110.103127. [DOI] [PMC free article] [PubMed] [Google Scholar]
- 20.Ozer K, Adanali G, Siemionow M. Late effects of TNF-alpha-induced inflammation on the microcirculation of cremaster muscle flaps under intravital microscopy. J Reconstr Microsurg. 2002;18:37–45. doi: 10.1055/s-2002-19708. [DOI] [PubMed] [Google Scholar]
- 21.Lima FB, Bethea CL. Ovarian steroids decrease DNA fragmentation in the serotonin neurons of non-injured rhesus macaques. Mol Psychiatry. 2010;15:657–668. doi: 10.1038/mp.2009.97. [DOI] [PMC free article] [PubMed] [Google Scholar]
- 22.Roubille C, Martel-Pelletier J, Davy JM, Haraoui B, Pelletier JP. Cardiovascular adverse effects of anti-inflammatory drugs. Antiinflamm Antiallergy Agents Med Chem. 2013;12:55–67. doi: 10.2174/1871523011312010008. [DOI] [PubMed] [Google Scholar]
- 23.Quinn CE, Hamilton PK, Lockhart CJ, McVeigh GE. Thiazolidinediones: effects on insulin resistance and the cardiovascular system. Br J Pharmacol. 2008;153:636–645. doi: 10.1038/sj.bjp.0707452. [DOI] [PMC free article] [PubMed] [Google Scholar]
- 24.Albert MA, Danielson E, Rifai N, Ridker PM, PRINCE Investigators Effect of statin therapy on C-reactive protein levels: the Pravastatin Inflammation/CRP Evaluation (PRINCE): a randomized trial and cohort study. JAMA. 2001;286:64–70. doi: 10.1001/jama.286.1.64. [DOI] [PubMed] [Google Scholar]
- 25.Senokuchi T, Matsumura T, Sakai M, Yano M, Taguchi T, Matsuo T, Sonoda K, Kukidome D, Imoto K, Nishikawa T, Kim-Mitsuyama S, Takuwa Y, Araki E. Statins suppress oxidized low density lipoprotein-induced macrophage proliferation by inactivation of the small G protein-p38 MAPK pathway. J Biol Chem. 2005;280:6627–6633. doi: 10.1074/jbc.M412531200. [DOI] [PubMed] [Google Scholar]
- 26.Lytle C, Tod TJ, Vo KT, Lee JW, Atkinson RD, Straus DS. The peroxisome proliferator-activated receptor gamma ligand rosiglitazone delays the onset of inflammatory bowel disease in mice with interleukin 10 deficiency. Inflamm Bowel Dis. 2005;11:231–243. doi: 10.1097/01.mib.0000160805.46235.eb. [DOI] [PubMed] [Google Scholar]
- 27.Spiegelman BM. PPAR-gamma: adipogenic regulator and thiazolidinedione receptor. Diabetes. 1998;47:507–514. doi: 10.2337/diabetes.47.4.507. [DOI] [PubMed] [Google Scholar]
- 28.Rovida E, Spinelli E, Sdelci S, Barbetti V, Morandi A, Giuntoli S, Dello Sbarba P. ERK5/BMK1 is indispensable for optimal colony-stimulating factor 1 (CSF-1)-induced proliferation in macrophages in a Src-dependent fashion. J Immunol. 2008;180:4166–4172. doi: 10.4049/jimmunol.180.6.4166. [DOI] [PubMed] [Google Scholar]
- 29.Alder JK, Georgantas RW, 3rd, Hildreth RL, Kaplan IM, Morisot S, Yu X, McDevitt M, Civin CI. Kruppel-like factor 4 is essential for inflammatory monocyte differentiation in vivo. J Immunol. 2008;180:5645–5652. doi: 10.4049/jimmunol.180.8.5645. [DOI] [PMC free article] [PubMed] [Google Scholar]
- 30.Heo KS, Lee H, Nigro P, Thomas T, Le NT, Chang E, McClain C, ReinhartKing CA, King MR, Berk BC, Fujiwara K, Woo CH, Abe J. PKCζ mediates disturbed flow-induced endothelial apoptosis via p53 SUMOylation. J Cell Biol. 2011;193:867–884. doi: 10.1083/jcb.201010051. [DOI] [PMC free article] [PubMed] [Google Scholar]
- 31.Antonopoulos AS, Margaritis M, Lee R, Channon K, Antoniades C. Statins as anti-inflammatory agents in atherogenesis: molecular mechanisms and lessons from the recent clinical trials. Curr Pharm Des. 2012;18:1519–1530. doi: 10.2174/138161212799504803. [DOI] [PMC free article] [PubMed] [Google Scholar]
Associated Data
This section collects any data citations, data availability statements, or supplementary materials included in this article.