Abstract
Dysregulation of hepcidin, a key iron regulating hormone, is important in the pathogenesis of iron overload in patients with myelodysplatic syndrome (MDS). However, most studies of hepcidin levels are complicated by concomitant RBC transfusions. To evaluate the relationship between iron metabolism and erythropoiesis, we measured serum levels of hepcidin, growth-differentiation factor-15 (GDF15) and other markers of erythropoiesis in 107 subjects with MDS not receiving RBC transfusions. Patients with MDS had significantly higher levels of hepcidin than normals. However, their hepcidin–ferritin ratio was markedly decreased compared to normals (P < 0.001) and varied substantially between MDS subtypes (P = 0.011). GDF15 levels positively correlated with percent of bone marrow erythroblasts (P < 0.001), soluble transferrin receptor (sTfR) (P = 0.018), and also with transferrin saturation (ISAT) (P = 0.038). The hepcidin–ferritin ratio negatively correlated with serum erythropoietin (EPO) levels (P < 0.001), and also with GDF15 levels (P = 0.014). Colony forming cells (CFC) were evaluated in 70 subjects. Those with serum ferritin (SF) levels <500 ng/ml had significantly more BFU-E than subjects with SF≥ 500 ng/L (P = 0.007), but numbers of granulocyte/macrophage-colony-forming cells (CFU-GM) were similar (P = 0.190). Our data indicate serum hepcidin levels are inappropriately low in patients MDS not receiving RBC transfusions. GDF15 levels correlated with low hepcidin levels and may contribute to iron overload in this setting. Iron overload may in turn suppress erythropoiesis by imparing the proliferative capacity of the erythroid progenitor cells.
Keywords: Myelodysplastic syndromes, Iron metabolism, Hematopoiesis
1. Introduction
Myelodysplastic syndromes (MDS) are heterogeneous clonal hematopoietic stem cell disorders characterized by dysplastic and ineffective hematopoiesis, blood cytopenias, severe anemia and a variable risk of progression to acute myleoid leukemia (AML) [1]. Eighty percent of patients with MDS have hemoglobin levels less than 100g/L at diagnosis and most of them will become RBC transfusion-dependent [2]. Although extensive RBC transfusions are thought to be the dominant cause of iron overload in MDS patients, many patients have iron overload soon after diagnosis and even before receiving RBC transfusions [3].
Most information regarding iron homeostasis in patients with MDS is from patients receiving RBC transfusions [4]. In contrast, iron homeostasis in patients with MDS not receiving RBC transfusions is not well-studied. We took advantage of the more conservative RBC transfusions policy in China to study this issue.
Previous data suggest that dysregulation of hepcidin, a key regulator of iron absorption and recycling, may play an important role in the pathogenesis of iron overload in patients with MDS. Hepcidin binds to ferroportin causing internalization and degradation of iron, which results in cessation of iron release from cells [5]. Hepcidin production is regulated by iron and erythropoiesis. Iron excess stimulates hepcidin production, whereas iron deficiency and increased erythropoiesis suppresses hepcidin production [6].
Iron accumulation in patients with MDS is self-sustaining because ineffective erythropoiesis stimulates intestinal iron absorption. The molecular nature of signal underlying this process is thought to be secretion of growth-differentiation factor-15 (GDF15) by mature erythroblasts, which results in suppression of hepcidin production by liver cells [7]. GDF-15, a member of the transforming growth factor-β super-family [8], was produced by erythroblasts in diseases with ineffective erythropoiesis such as congenital dyserythropoietic anemia, pyruvate kinase deficiency and thalassemias [7,9–11]. However, GDF15 levels in patients with MDS are not extensively studied and its role in regulating hepcidin is controversial [7].
To evaluate the relationship between iron burden and erythropoiesis in patients with MDS not receiving RBC transfusions, we studied levels of hepcidin, GDF15, soluble transferrin receptor [sTfR], erythropoietin [EPO] and serum ferritin (SF) in this population.
2. Subjects and methods
2.1. Subjects
The study was approved by the Ethics Committee of the Institute of Hematology, Chinese Academy of Medical Sciences and Peking Union Medical College according to the guidelines of the Declaration of Helsinki. 107 adults with MDS diagnosed between April, 2011 and March, 2013 at the Institute of Hematology and Blood Disease Hospital, Chinese Academy of Medical Sciences (CAMS) were included. To be enrolled in this study, patients had to be untreated and previously without any RBC transfusions. Individuals with any hematological and malignant diseases other than MDS, those with hepatic and/or renal diseases, decompensated heart disease and active infection were excluded. MDS subtypes were classified according to World Health Organization (WHO) and stratified for prognosis according to International Prognostic Scoring System (IPSS) [12,13]. There were 66 males. Median age was 50 years (range, 16–96 years). Forty healthy individuals with a rigorous definition of normal iron state as previously described were used as controls [14,15].
2.2. Biochemical assays
Serum hepcidin were determined using a commercial ELISA kit following manufacturer's protocol (DRG Instruments, Marburg, Germany). GDF15 serum levels were measured with the DuoSet enzyme-linked immunosorbent assay development kit for human GDF15 (R&D Systems, Minneapolis, MN, USA). SF and EPO were determined by immunoradiometric assay. sTfR was quantified using an immunonephelometric method.
2.3. In vitro colony forming cells (CFC) assay
1 × 10E5 bone marrow mononuclear cells (BMNC) were cultured in semi-solid Methocult GF medium (StemCell Technologies, MethoCult™ GFH4434) and incubated at 37 °C. Each sample was analyzed in triplicate. Erythroid colony forming unit (CFU-E) colonies of at least eight cells were counted on the seventh day of culture, erythroid burst-forming unit (BFU-E) colonies of ≤ 3 sub-clusters or 1 cluster containing >300 cells and granulocyte-macrophage colony-forming unit (CFU-GM) colonies of >40 cells were scored after 14 days of culture. Normal ranges at our laboratory per 10E5 BMNC were: CFU-GM, 14–29, CFU-E, 68–93 and BFU-E 25–37.
2.4. Statistical methods
Comparison of numerical variables between groups used a nonparametric approach (Mann–Whitney test or Kruskal–Wallis ANOVA). Distribution of categorical variables in different groups was compared with Fisher exact-test (when computationally feasible) or the χ2 test. Iron parameter correlations were calculated using the Spearman correlation. Results are expressed as means ± SD. P-values less than 0.05 (two-sided) were considered statistically significant.
3. Results
3.1. GDF15 and hepcidin levels in the whole MDS group
Clinical and biochemical characteristics of the whole MDS group including cytogenetic data were summarized in Table 1. Table 2 showed the main characteristics and iron biochemical parameters including serum hepcidin and GDF15 of the whole MDS population as compared with the control group. Patients with MDS had significantly higher levels of SF, GDF-15 and EPO. There was a weak to moderate positive correlation between GDF15 levels and percent of bone marrow erythroblasts (r = 0.485; P < 0.001), sTfR (r = 0.285; P = 0.018), and iron saturation ratio (ISAT) (r = 0.242; P = 0.038) (Fig. 1A–C). In addition, a moderate negative correlation was observed between GDF15 and transferrin levels (TRF) (r = −0.315; P = 0.008) (Fig. 1D). Unexpectedly, the mean serum hepcidin levels in the MDS cohort were significantly higher than the controls (P < 0.001). However, the hepcidin–ferritin ratio was markedly decreased in patients with MDS (P < 0.001; Table 2).
Table 1.
Clinical and biochemical characteristics of 107 MDS patients.
| MDS patients (n = 107) | |
|---|---|
| WBC(×109/L) | 2.7(0.6–9.4) |
| HB (g/dL) | 8.1(6.0–10.8) |
| PLT(×109/L) | 59(7–395) |
| ALT (IU/L) | 19(1–73) |
| AST(IU/L) | 20(1–71) |
| Creatinine (μmol/L) | 82(49–98) |
| CRP (mg/L) | 3.0(1.0–8.7) |
| Cytogenetics | |
| Low (N) | 59 |
| Intermediate (N) | 24 |
| High (N) | 15 |
| No data (N) | 9 |
| IPSS | |
| Low risk (N) | 8 |
| Int-1 (N) | 60 |
| Int-2 (N) | 24 |
| High (N) | 6 |
| No data (N) | 9 |
Abbreviations: WBC, white blood count; HB, hemoglobin; PLT, platelet level; ALT, Alanine Transaminase; AST, Aspartate Transaminase; CRP, C-reactive protein; IPSS, International Prognostic Scoring System.
Table 2.
Characteristics of persons with MDS and normals.
| MDS (n = 107) | Controls (n = 40) | P | |
|---|---|---|---|
| Age (year) | 50 (16–96) | 40 (16–77) | <0.001 |
| Sex (Male/Female) | 66/41 | 18/22 | 0.102 |
| SF(ng/ml) | 450 (60–3637) | 66 (19–115) | <0.001 |
| EPO (mU/ml) | 96. 6 (2.2–3784.2) | 13.8 (9.9–17.5) | <0.001 |
| Hepcidin (ng/ml) | 81.7(4.5–400.4) | 55.9(9.0–333.9) | <0.001 |
| GDF15 (pg/ml) | 1432 (336–22559) | 463 (91–1694) | <0.001 |
| Hepcidin–ferritin ratio | 0.18 (0.01–4.90) | 0.46 (0.1–14.20) | <0.001 |
Abbreviations: SF, serum ferritin; EPO, erythropoietin; GDF15, growth-differentiation factor-15.
Fig. 1.
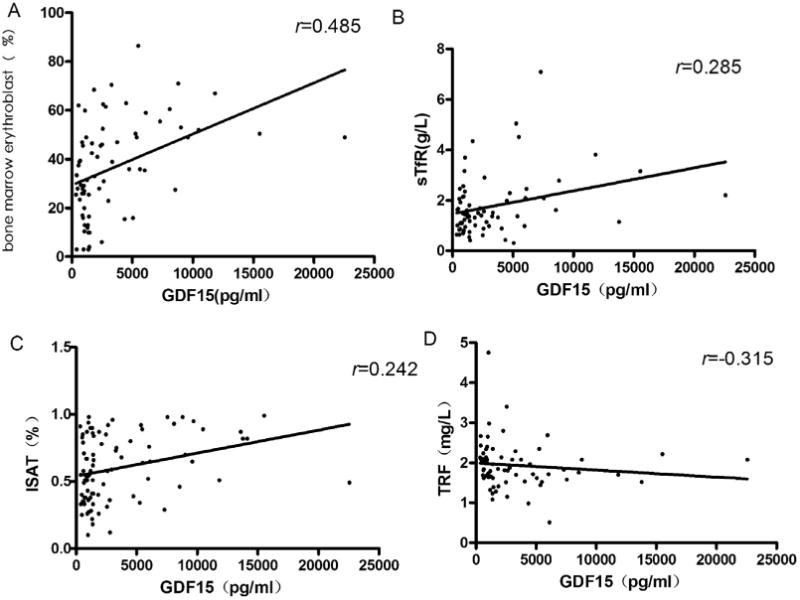
Correlations between GDF15 levels and percent of bone marrow erythroblasts, soluble transferring receptor, transferrin saturation and serum transferrin. (A) Relationship between GDF15 and bone marrow erythroblasts; (B) Relationship between GDF15 and soluble transferrin receptor level; (C) Relationship between GDF15 and iron transferrin saturation; (D) Relationship between GDF15 and serum transferrin.
3.2. MDS patients stratified according to different WHO subtypes
The hepcidin–ferritin ratio varied substantially among different WHO subgroups (P = 0.011; Fig. 2A), with the lowest ratio in patients with refractory anemia with ring sideroblasts (RARS). These patients have the greatest iron overload with the highest SF and ISAT among the MDS subtypes (P = 0.028 and P = 0.004; Fig. 2B and C). GDF15 levels also varied among MDS categories (P = 0.005; Fig. 2D), with the highest levels in subjects with RARS and the lowest levels in the refractory anemia with excess blasts (RAEB) and refractory cytopenia with multilineage dysplasia (RCMD) cohorts.
Fig. 2.
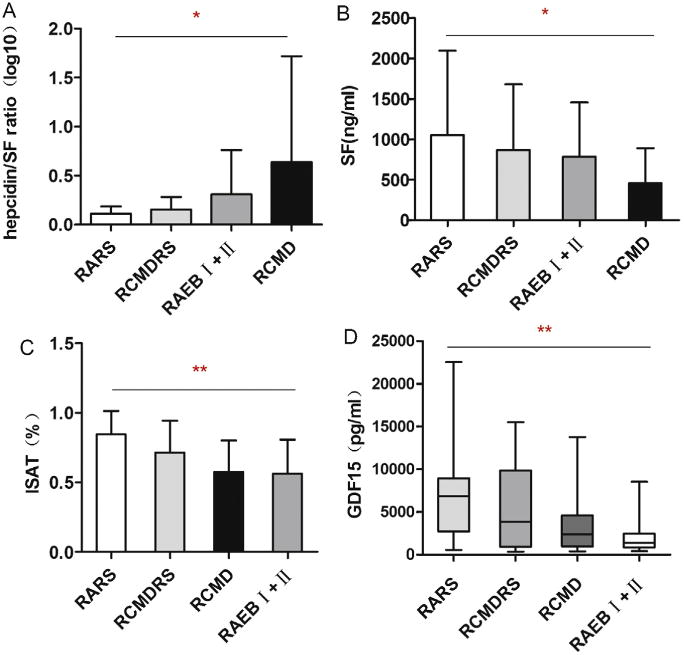
Heterogeneity of hepcidin–ferritin ratio, serum ferritin, transferrin saturation and GDF15 levels in different WHO MDS subtypes. (A) Hepcidin– ferritin ratio according to WHO MDS subtypes; (B) Serum ferritin in different WHO MDS subtypes; (C) Iron transferrin saturation in different WHO MDS subtypes; (D) GDF15 levels in different WHO MDS subtypes. *P<0.05; **P<0.01.
3.3. Homeostatic control of hepcidin by erythropoietic activity
Significant increases in GDF15, EPO and SF of the entire MDS cohort were of special interest, because these parameters were previously reported to be associated with suppression of hepcidin in diseases with iron overload. Correlation analyses were performed to study interdependence between hepcidin, GDF15, haematological and serum iron measurements. No significant correlation was detected between hepcidin and SF or serum iron levels. GDF15 levels were not significantly correlated with serum hepcidin levels, but a weak negative correlation was observed between GDF15 and the hepcidin–ferritin ratio (r = −0.279; P = 0.014; Fig. 3A). Furthermore, there was a moderate negative correlation between the hepcidin–ferritin ratio and EPO levels in patients with MDS (r = −0.449; P < 0.001; Fig. 3B).
Fig. 3.
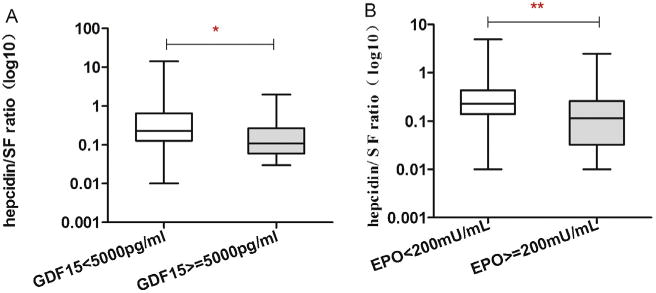
Correlations between parameters of erythropoesis and iron overload in persons with MDS. (A) Relationship between hepcidin–ferritin ratio with serum GDF15 levels; (B) Relationship between hepcidin–ferritin ratio with serum EPO levels. *P<0.05; **P<0.01.
Multivariate linear regression models were performed to evaluate the independent determinants of the hepcidin–ferritin ratio in persons with MDS not receiving RBC transfusions, including WHO MDS subtypes, EPO, GDF15 levels and others (Table 3). Of note, the hepcidin–ferritin ratio was independently associated with GDF15 levels and WHO MDS subtypes (P = 0.029 and P = 0.006).
Table 3.
Multivariate analysis considering hepcidin-ferritin ratio as dependent variable.
| Coefficient | P | |
|---|---|---|
| Age | −0.085 | 0.476 |
| EPO | −0.129 | 0.287 |
| sTfR | −0.130 | 0.308 |
| WHO MDS subtypes | −0.390 | 0.006 |
| GDF15 | −0.292 | 0.029 |
Abbreviations: EPO, erythropoietin; sTfR, soluble transferrin receptor; WHO, World Health Organization; GDF15, growth-differentiation factor-15.
3.4. The effect of iron burden on erythropiesis in MDS patients
The 70 subjects with BFU-E and CFU-GM data were divided into two cohorts based on their SF levels. 43 had SF levels <500 ng/ml and 27 had SF levels ≥500 ng/ml. There were no significant differences in age (P = 0.35), WHO MDS subtypes (P = 0.43), cytogenetic risk groups (P = 0.26) or IPSS (P = 0.22; Table 4). Subjects with lower SF levels had significantly more BFU-E (median 14 [range 2–69] versus 10 [range, 0–35]) than subjects with higher SF levels (P = 0.007; Fig. 4A). In contrast, there was no difference in CFU-GM (median 15 (4–59) versus 14 (1–50); P = 0.190; Fig. 4B).
Table 4.
General characteristics of 70 MDS patients with normal and elevated ferritin values.
| SF < 500 ng/ml (N = 43) | SF ≥ 500 ng/ml (N = 27) | P | |
|---|---|---|---|
| Sex (Male) | 16 | 21 | 0.001 |
| Age (year) | 48 (24–84) | 50 (19–79) | 0.350 |
| WHO MDS subtypes (N) | 0.431 | ||
| 5q-Syndrome | 1 | 0 | |
| RA/-RS | 6 | 3 | |
| RCMD/-RS | 23 | 11 | |
| RAEBI/II | 13 | 12 | |
| Unclassified | 0 | 1 | |
| IPSS (N) | 0.221 | ||
| Low | 4 | 1 | |
| Int-1 | 27 | 13 | |
| Int-2 | 8 | 11 | |
| High | 1 | 1 | |
| No data | 3 | 1 | |
| IPSS cytogenetics (N) | 0.259 | ||
| Low | 27 | 13 | |
| Intermediate | 9 | 7 | |
| High | 4 | 6 | |
| No data | 3 | 1 |
Abbreviations: RA: refractory anemia; RCMD: refractory cytopenia with multilineage dysplasia; SF: serum ferritin; WHO: World Health Organization; RARS: refractory anemia with ring sideroblasts; RCMDRS: RCMD with ring sideroblasts; RAEB-I: refractory anemia with excess blasts-II; RAEB-II: refractory anemia with excess blasts-II; IPSS: ‘International Prognostic Scoring System; Int: intermediate.
Fig. 4.
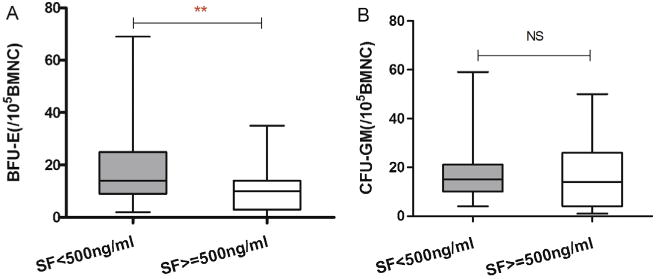
(A) Proliferation of BFU-E in persons with SF < 500 ng/ml (N = 43) and SF ≥ 500 ng/ml (N = 27); (B) Proliferation of CFU-GM in persons with SF < 500 ng/ml (N = 43) and SF ≥ 500 ng/ml (N = 27). *P < 0.05; NS, not significant.
4. Discussion
Since most of the information regarding iron homeostasis in patients with MDS derived from subjects receiving RBC transfusions, we took advantage of policy in China to evaluate the relationship between iron metabolism and erythropoiesis in 107 untreated MDS patients without RBC transfusions. To the best of our knowledge, this is the largest study on hepcidin levels in MDS without RBC transfusion so far. Although the male–female-ratio between patients with MDS and controls differs, the difference did not reach the statistical significance (P = 0.102). Our findings indicate that SF levels were increased in patients with MDS without RBC transfusions, suggesting that patients with MDS have developed iron overload before receiving RBC transfusions, which is consistent with our prior study [16]. Similar to patients with MDS receiving RBC transfusions, patients with MDS not receiving RBC transfusions had significantly higher serum hepcidin levels compared to the controls [4] and the hepcidin–ferritin ratio was markedly decreased compared to normals. These findings suggest that serum hepcidin levels are inappropriately low and hepcidin response to iron overload is blunted in patients with MDS before RBC transfusions, which may contribute to increased intestinal iron uptake and iron overload early in the disease.
Patients with MDS with no RBC transfusions had significantly higher GDF15 levels than controls. A similar increase has already been reported in patients with ineffective erythropoiesis such as β-thalassemia, CDA Iand CDA II [7,9,10]. Similarly high GDF15 levels have also been reported in patients with RARS [20], but not in other MDS subtypes. Moreover, GDF15 levels positively correlated with percent of bone marrow erythroblasts and sTfR, suggesting GDF15 levels could reflect the magnitude of ineffective erythropoiesis in MDS not receiving RBC transfusions. Our data indicate a positive correlation between GDF15 levels and ISAT levels, indicating GDF15 involved in iron overload in patients with MDS.
Consitent with previous findings [4,17], the hepcidin–ferritin ratio differed in different WHO MDS subtypes paralleling the clinical and pathological heterogenetity of MDS. The hepcidin–ferritin ratio in persons with RARS was lowest of all subtypes, which is consistent with a profound abnormality in its iron regulation. This may be related to the high incidence of SF3B1 mutations [18,19] in persons with RARS, which might also explain the highest levels of SF and ISAT in different WHO MDS categories.
GDF15 has been identified as a negative regulator of hepcidin expression in patients with β-thalassaemia and in isolated human hepatocytes [7]. In contrast to data from Santini and co-workers [4], we found increased GDF15 levels were associated with the ratio of hepcidin–ferriten, supporting the hypothesis GDF15 is a negative regulator of iron absorption under conditions of increased erythropoiesis in patients with MDS. This inconsistency might because Santini and co-workers studied subjects with and without RBC transfusions, whereas we studied only those without RBC transfusions. Furthermore, in our study hepcidin levels were inversely correlated with EPO levels, indicating down-regulation of hepcidin is proportional to increased erythropoiesis. The inverse relationship between hepcidin and EPO levels raises the question whether EPO directly regulates hepcidin expression as reported [21]. Although giving EPO to mice results in down-regulation of hepcidin and increased iron absorption [22], hepcidin expression is not suppressed when erythropoiesis is inhibited pharmacologically. These data indicate EPO is not directly involved in hepcidin regulation [23].
A hypothesis that could explain the the relationship between iron metabolism and erythropoiesis in patients with MDS not receiving RBC transfusions is that tissue hypoxia triggers EPO production, which increases erythropoiesis accompanied by increased serum GDF15 levels [23]. This notion is consistent with that a previous study reported by Liu [23]. GDF15 or other signals such as TWSG1, act together to inappropriatedly inhibit hepcidin expression in patients with MDS [24]. These low hepcidin levels result in increased iron absorption and increasd release of stored iron, the consequence of which is high transferrin saturation and iron overload (Fig. 5).
Fig. 5.
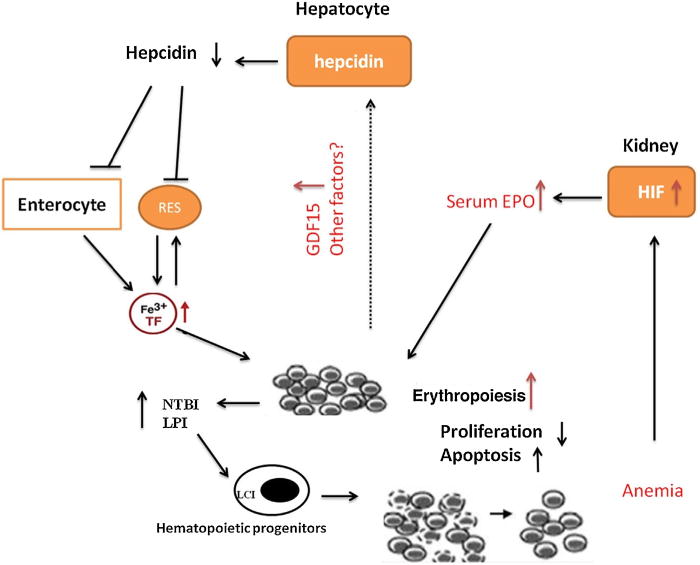
Proposed model for erythropoiesis and iron regulation in patients with MDS not receiving RBC transufions.
Iron overload can cause damage to the heart, liver and endocrine glands [25]. It is unknown whether iron accumulation in the bone marrow affects hematopoiesis. Although the gender distribution differs in patients between SF ≥500 ng/ml and lower than 500 ng/ml in the present study, the difference has no statistically impact on both BFU-E and CFU-E in the CFU cohorts (P = 0.576 and P = 0.906). Comparing the numbers of BFU-E in patients with SF ≥500 ng/ml and lower than 500 ng/ml, we demonstrated that in patients with elevated ferritin values the numbers of BFU-E were significantly reduced (P = 0.007), while CFU-GM counts showed no differences between the two groups (P = 0.190). Our data indicate that moderate-severe iron overload could serverely suppress erythropoiesis by imparing the proliferative capacity of the erythroid progenitor cells, characterizing by less number of BFU-E. Furthermore, iron overload had more influence on erythroid than on myeloid progenitor cells. One implication from the colony assays experiments is that early iron chelation therapy could improve this ineffective erythropiesis by decreasing intra- and extra-cellular toxic iron species and resultant oxidative stress [26].
In summary, the above findings indicate that serum hepcidin levels are inappropriately low and relative deficiency in patients with MDS not receiving RBC transfusions. The present study also revealed that GDF15 levels, a measure of ineffective erythropoiesis, which might alone or act with other signals such as TWSG1 to inappropriatedly inhibit hepcidin expression in patients with MDS, which may contribute to the iron overload in MDS patients. Further studies are required to bring to light the underlying mechanism of the relationship between GDF-15 and hepcidin production in MDS. The consequence of the iron overload in the bone marrow may in turn aggravate preexisting ineffective erythropoiesis by imparing the proliferative capacity of the erythroid progenitor cells.
Acknowledgments
Supported in part by National Natural Science Funds (No. 81070403, 81270585, 81200349), Tianjin Key Natural Science Funds (12JCZDJC23900), National Public Health Grand Research Foundation (No. 201202017) and SRFDP (No. 20121106130005). RPG acknowledges support from the NIHR Biomedical Research Centre funding scheme.
Footnotes
Conflict of interest: R.P.G. is a part-time employee of Celgene Corp., Summit, NJ. The remaining authors declare no competing financial interests.
Contributions. Z.J. X.: the conception and design of the study, drafting the article, and final approval of the version to be submitted; R. C: acquisition of data, analysis and interpretation of data, and drafting the article; R. P. G, G. H: drafting the article; G.Q.Z., T.J.Z., Z.F.X., T.J.Q., L.W.F., H.L.Z., L.J.P., S.Q.Q. and Y.Z. supplied acquisition of data supplied acquisition of data.
References
- 1.Tefferi A, Vardiman JV. Myelodysplastic syndromes. N Eng J Med. 2009;361:1872–5. doi: 10.1056/NEJMra0902908. [DOI] [PubMed] [Google Scholar]
- 2.Sanz GF, Sanz MA, Vallespi T, Cañizo MC, Torrabadella M, García S, et al. Two progression models and a scoring system for predicting survival and planning treatment in myelodysplastic syndromes: a multivariate analysis of prognostic factors in 370 patients. Blood. 1989;74:395–408. [PubMed] [Google Scholar]
- 3.Cortelezzi A, Cattaneo C, Cristiani S, Duca L, Sarina B, Deliliers GL, et al. Non-transferrin-bound iron in myelodysplastic syndromes: a marker of ineffective erythropoiesis? Hematol J. 2000;1:153–8. doi: 10.1038/sj.thj.6200028. [DOI] [PubMed] [Google Scholar]
- 4.Santini V, Girelli D, Sanna A, Martinelli N, Duca L, Campostrini N, et al. Hepcidin levels and their determinants in different types of myelodysplastic syndromes. PLoS One. 2011;6:e23109. doi: 10.1371/journal.pone.0023109. [DOI] [PMC free article] [PubMed] [Google Scholar]
- 5.Nemeth E, Tuttle MS, Powelson J, Vaughn MB, Donovan A, Ward DM, et al. Hepcidin regulates cellular iron efflux by binding to ferroportin and inducing its internalization. Science. 2004;306:2090–3. doi: 10.1126/science.1104742. [DOI] [PubMed] [Google Scholar]
- 6.Ganz T, Nemeth E. Hepcidin and disorders of iron metabolism. Annu Rev Med. 2011;62:347–60. doi: 10.1146/annurev-med-050109-142444. [DOI] [PubMed] [Google Scholar]
- 7.Tanno T, Bhanu NV, Oneal PA, Goh SH, Staker P, Lee YT, et al. High levels of GDF15 in thalassemia suppress expression of the iron regulatory protein hepeidin. Nat Med. 2007;13:1096–101. doi: 10.1038/nm1629. [DOI] [PubMed] [Google Scholar]
- 8.Eling TE, Baek SJ, Shim M, Lee CH. NSAID activated gene (NAG-1), a modulator of tumorigenesis. J Biochem Mol Biol. 2006;39:649–55. doi: 10.5483/bmbrep.2006.39.6.649. [DOI] [PubMed] [Google Scholar]
- 9.Tamary H, Shalev H, Perez-Avraham G, Zoldan M, Levi I, Swinkels DW, et al. Elevated growth differentiation factor 15 expressionin patients with congenital dyserythropoietic anemia type I. Blood. 2008;112:5241–4. doi: 10.1182/blood-2008-06-165738. [DOI] [PMC free article] [PubMed] [Google Scholar]
- 10.Casanovas G, Swinkels DW, Altamura S, Schwarz K, Laarakkers CM, Gross HJ, et al. Growth differentiation factor 15 in patients with congenital dyserythropoietic anaemia (CDA) type II. J Mol Med (Berl) 2011;89:811–6. doi: 10.1007/s00109-011-0751-5. [DOI] [PubMed] [Google Scholar]
- 11.Finkenstedt A, Bianchi P, Theurl I, Vogel W, Witcher DR, Wroblewski VJ, et al. Regulation of iron metabolism through GDF15 and hepcidin in pyruvate kinase deficiency. Br J Haematol. 2009;144:789–93. doi: 10.1111/j.1365-2141.2008.07535.x. [DOI] [PubMed] [Google Scholar]
- 12.Swerdlow SH, Campo E, Harris NL, et al. WHO classification of tumors of haematopoietic and lymphoid tissues. 4th. Lyon: IARC; 2008. [Google Scholar]
- 13.Greenberg P, Cox C, LeBeau M, Fenaux P, Morel P, Sanz G, et al. International scoring system for evaluating prognosis in myelodysplastic syndromes. Blood. 1997;89:2079–88. [PubMed] [Google Scholar]
- 14.Bozzini C, Campostrini N, Trombini P, Nemeth E, Castagna A, Tenuti I, et al. Measurement of urinary hepcidin levels by SELDI-TOF-MS in HFE hemochromatosis. Blood Cells Mol Dis. 2008;40:347–52. doi: 10.1016/j.bcmd.2007.10.001. [DOI] [PubMed] [Google Scholar]
- 15.Swinkels DW, Girelli D, Laarakkers C, Kroot J, Campostrini N, Kemna EH, et al. Advances in quantitative hepcidin measurements by time-of flight mass spectrometry. PLoS One. 2008;3:e2706. doi: 10.1371/journal.pone.0002706. [DOI] [PMC free article] [PubMed] [Google Scholar]
- 16.Nie L, Li L, Yang L, Xiao Z. HFE genotype and iron metabolism in Chinese patients with myelodysplastic syndromes and aplastic anemia. Ann Hematol. 2010;89:1249–53. doi: 10.1007/s00277-010-1016-z. [DOI] [PubMed] [Google Scholar]
- 17.Zipperer E, Post JG, Herkert MS, Kündgen A, Fox F, Haas R, et al. Serum hepcidin measured with an improved ELISA correlates with parameters of iron metabolism in patients with myelodysplastic syndrome. Ann Hematol. 2013 Jul 11; doi: 10.1007/s00277-013-1839-5. Epub ahead of print. [DOI] [PubMed] [Google Scholar]
- 18.Cui R, Gale RP, Xu Z, Qin T, Fang L, Zhang H, et al. Clinical importance of SF3B1 mutations in Chinese with myelodysplastic syndromes with ring sideroblasts. Leuk Res. 2012;36:1428–33. doi: 10.1016/j.leukres.2012.08.015. [DOI] [PubMed] [Google Scholar]
- 19.Ambaglio I, Malcovati L, Papaemmanuil E, Laarakkers CM, Della Porta MG, Gallì A, et al. Inappropriately low hepcidin levels in patients with myelodysplastic syndrome carrying a somatic mutation of SF3B1. Haematologica. 2013;98:420–3. doi: 10.3324/haematol.2012.077446. [DOI] [PMC free article] [PubMed] [Google Scholar]
- 20.Ramirez JM, Schaad O, Durual S, Cossali D, Docquier M, Beris P, et al. Growth diferentiation factor 15 production is necessary for normal erythroid diferentiation and is increased in refractory anaemia with ring sideroblasts. Br J Haematol. 2009;144:251–62. doi: 10.1111/j.1365-2141.2008.07441.x. [DOI] [PubMed] [Google Scholar]
- 21.Pinto JP, Ribeiro S, Pontes H, Thowfeequ S, Tosh D, Carvalho F, et al. Erythropoietin mediates hepcidin expression in hepatocytes through EPOR signaling and regulation of C/EBPalpha. Blood. 2008;111:5727–33. doi: 10.1182/blood-2007-08-106195. [DOI] [PMC free article] [PubMed] [Google Scholar]
- 22.Nicolas G, Chauvet C, Viatte L, Danan JL, Bigard X, Devaux I, et al. The gene encoding the iron regulatory peptide hepcidin is regulated by anemia, hypoxia, and inflammation. J Clin Invest. 2002;110:1037–44. doi: 10.1172/JCI15686. [DOI] [PMC free article] [PubMed] [Google Scholar]
- 23.Liu Q, Davidoff O, Niss K, Haase VH. Hypoxia inducible factor regulates hepcidin via erythropoietin-induced erythropoiesis. J Clin Invest. 2012;122:4635–44. doi: 10.1172/JCI63924. [DOI] [PMC free article] [PubMed] [Google Scholar]
- 24.Tanno T, Porayette P, Sripichai O, Noh SJ, Byrnes C, Bhupatiraju A, et al. Identification of TWSG1 as a second novel erythroid regulator of hepcidin expression in murine and human cells. Blood. 2009;114:181–6. doi: 10.1182/blood-2008-12-195503. [DOI] [PMC free article] [PubMed] [Google Scholar]
- 25.Gattermann N, Rachmilewitz EA. Iron overload in MDS-pathophysiology, diagnosis, and complications. Ann Hematol. 2011;90:1–10. doi: 10.1007/s00277-010-1091-1. [DOI] [PubMed] [Google Scholar]
- 26.Ghoti H, Fibach E, Merkel D, Perez-Avraham G, Grisariu S, Rachmilewitz EA. Changes in parameters of oxidative stress and free iron biomarkers during treatment with deferasirox in iron-over loaded patients with myelodysplastic syndromes. Haematologica. 2010;95:1433–4. doi: 10.3324/haematol.2010.024992. [DOI] [PMC free article] [PubMed] [Google Scholar]


