

Abstract
The biosynthesis of the organometallic H cluster of [Fe–Fe] hydrogenase requires three accessory proteins, two of which (HydE and HydG) belong to the radical S-adenosylmethionine enzyme superfamily. The third, HydF, is an Fe–S protein with GTPase activity. The [4Fe–4S] cluster of HydF is bound to the polypeptide chain through only the three, conserved, cysteine residues present in the binding sequence motif CysXHisX(46–53) HisCysXXCys. However, the involvement of the two highly conserved histidines as a fourth ligand for the cluster coordination is controversial. In this study, we set out to characterize further the [4Fe–4S] cluster of HydF using Mössbauer, EPR, hyperfine sublevel correlation (HYSCORE), and resonance Raman spectroscopy in order to investigate the influence of nitrogen ligands on the spectroscopic properties of [4Fe–4S]2+/+ clusters. Our results show that Mössbauer, resonance Raman, and EPR spectroscopy are not able to readily discriminate between the imidazole-coordinated [4Fe–4S] cluster and the non-imidazole-bound [4Fe–4S] cluster with an exchangeable fourth ligand that is present in wild-type HydF. HYSCORE spectroscopy, on the other hand, detects the presence of an imidazole/histidine ligand on the cluster on the basis of the appearance of a specific spectral pattern in the strongly coupled region, with a coupling constant of approximately 6 MHz. We also discovered that a His-tagged version of HydF, with a hexahistidine tag at the N-terminus, has a [4Fe–4S] cluster coordinated by one histidine from the tag. This observation strongly indicates that care has to be taken in the analysis of data obtained on tagged forms of metalloproteins.
Keywords: HydF, Metalloenzyme, Iron sulfur cluster, EPR, Mössbauer, Hyperfine sublevel correlation
Introduction
There are more and more examples of [4Fe–4S] clusters with three iron atoms coordinated by cysteines and one by the nitrogen atom of a histidine residue (either Nɛ or Nδ). This type of coordination was demonstrated in the case of wild-type enzymes such as the membrane-bound nitrate reductase from Escherichia coli, [1] respiratory complex I [2], and in both [Ni–Fe] hydrogenase [3] and [Fe–Fe] hydrogenase [4]. Nevertheless, evidence for such coordination has been provided exclusively by X-ray crystallography, and no characteristic spectroscopic signatures have been identified so far. An obvious reason for this resides in the complexity of the electron transfer systems in which clusters with histidinyl coordination have been observed; hydrogenases, nitrate reductase, and complex I all contain a mixture of different clusters and redoxactive centers which are extremely difficult to differentiate spectroscopically. Only in the case of nitrate reductase could the [4Fe–4S] cluster proximal to the molybdenum cofactor active site (FS0), a cubane with one histidine ligand, be observed by EPR spectroscopy. At low temperature it has an EPR signal in the g = 5 region, characteristic of a [4Fe–4S]+ cluster with an S = 3/2 state [1]. However, EPR spectroscopy alone is not sufficient to assign the S = 3/2 feature to nitrogen ligation, since [4Fe–4S]+ clusters with all-cysteinyl ligation [5] or with one oxygenic ligand [6] can also exhibit S = 3/2 ground states. One should note that, in contrast, a number of [2Fe–2S] clusters ligated by one or two histidines could be studied by EPR, electron–nuclear double resonance, and Raman resonance spectroscopy [7–11]. Another approach is to introduce histidinyl ligation of a [4Fe–4S] cluster by site-directed mutagenesis, in place of a cysteine residue. This has been achieved in only one case, the DNA repair enzyme MutY [12]. However, the iron–histidine complex in MutY was found to be labile and the cluster prone to decompose into the S = 1/2 [3Fe–4S]+ cluster form, observable by EPR spectroscopy [12].
Additionally, very few functional studies have addressed the role of histidinyl ligation to [4Fe–4S] clusters. In general, clusters with histidinyl ligation do not seem to be very different from those with only cysteine ligands. For example, in [Ni–Fe] hydrogenases, the two cubanes, one with all-cysteine coordination and the other with one histidine ligand, have the same reduction potential despite their distinct coordination. This is also the case for the [Fe–Fe] hydrogenases. Furthermore, the cysteine-to-histidine MutY mutant exhibited the same enzyme activity as the wild-type protein. In contrast, a recent study showed that a histidine-to-cysteine mutation, converting a (His)(Cys)3 into a (Cys)4 coordination in the case of the distal [4Fe–4S] cluster of [Ni–Fe] hydrogenase, had a decisive effect on the rates of intramolecular and intermolecular electron transfer. However, only slight modification was observed in the cluster redox potentials of the enzyme [13].
During our investigation of enzymes involved in the maturation of [Fe–Fe] hydrogenases in Thermotoga maritima, we found that one member of the assembly machinery, HydF, was a GTPase containing a single [4Fe–4S]2+/+ cluster [14]. This cluster is bound to the polypeptide chain through only the three, conserved, cysteine residues and contains an exchangeable coordination site to which an imidazole molecule can bind, as unambiguously shown by hyperfine sublevel correlation (HYSCORE) spectroscopy [14]. We reasoned that this new protein, with a hitherto unique [4Fe–4S]-imidazole complex, and no interference with other clusters, would be an ideal model to investigate the spectroscopic properties of a cluster with a histidyl coordination. In the present study, we also discovered that a His-tagged version of HydF, with a hexahistidine tag at the N-terminus, had its [4Fe–4S] cluster coordinated by one histidine from the tag, thus providing us with an additional model to characterize. Thus, we set out to characterize further the [4Fe–4S] cluster of HydF using Mössbauer, EPR, HYSCORE, and resonance Raman spectroscopy in order to investigate the influence of nitrogen ligands on the spectroscopic properties on [4Fe–4S]2+/+ clusters. Our results show that although Mössbauer and resonance Raman spectroscopy do not clearly differentiate between the imidazole-coordinated cluster and the non-imidazole-bound [4Fe–4S]2+ cluster, EPR spectroscopy shows a new low-field feature attributable to an S = 3/2 system in the presence of an imidazole ligand. Finally, HYSCORE spectroscopy proved a reliable spectroscopic method to identify an imidazole or histidyl ligand to a [4Fe–4S] cluster.
Materials and methods
General
All chemicals used were purchased from Sigma-Aldrich and used as received unless otherwise stated. Protein purity was assessed by gel electrophoresis by loading samples on Any kD™ Mini-Protean® TGX precast gels (Bio-Rad) with Precision Plus Protein™ standards (Bio-Rad). Migration was achieved on a Mini-Protean apparatus (Bio-Rad) at 200 V for 30 min. Protein concentrations were determined with the Bio-Rad protein assay, using bovine serum albumin as a standard. Aerobic UV–visible absorption spectra were recorded with a Cary 1Bio spectrophotometer (Varian), and anaerobic measurements were made with a fiber-optic-fitted UvikonXL spectrophotometer (BioTek Instruments). Iron quantification and sulfur quantification were done according to the methods of Fish [15] and Beinert [16], respectively. Mass spectrometry and N-terminal sequencing analyses were performed by the mass spectrometry and the peptide analysis facilities of the Institut de Biologie Structurale (Grenoble, France).
Cloning of His-tagged HydF from T. maritima
HydF from T. maritima (TmHydF) was obtained as previously described [14]. Furthermore, the NdeI/HindIII fragment was also subcloned into a derivative of a pT7-7 vector for overexpression of N-terminal hexahistidine-tagged proteins, leading to p6H-TmHydF. Additionally, histidine residues H304 and H352 (see Fig. S1 for the sequence alignments) were mutated to cysteine using the two-stage QuikChange mutagenesis protocol with Pfu-Turbo HotStart polymerase (Stratagene), the p6H-TmHydF plasmid as the template, and their respective primers (Table S1).
TmHydF expression and purification
As T. maritima genes use numerous rare codons which code for arginine, isoleucine, or leucine residues, Escherichia coli BL21-CodonPlus(DE3)-RIL cells (Stratagene) were used for overexpression of the wild-type TmHydF (WT-TmHydF) as well as the His-tagged protein (6H-TmHydF) and its mutants.
Cells transformed with the p6H-TmHydF plasmid were grown in Miller’s modified LB medium supplemented with ampicillin and chloroamphenicol at 310 K until the optical density at 600 nm reached 1, and protein expression was induced by addition of isopropyl β-D-thiogalactopyranoside to a final concentration of 0.5 mM. For 15N labeling, a minimal medium complemented with 15NH4Cl was used. After 5 h, the cells were pelleted and stored at 193 K until use. For purification, the cells were thawed in the presence of lysozyme (0.6 mg ml−1) and 0.5 % Triton X-100 before centrifugation at 180,000g for 1 h at 277 K. DNA was removed by centrifugation at 10,000g after precipitation with 2 % streptomycin sulfate, and the cell-free extract was loaded onto a nickel nitrilotriacetic acid (Ni–NTA) column equilibrated with 20 mM tris(hydroxymethyl)aminomethane (Tris)–HCl buffer pH 8.0, 200 mM NaCl. After the column had been extensively washed with the equilibration buffer, it was washed with the equilibration buffer containing 20 mM imidazole and then the protein was eluted from the column with 20 mM Tris–HCl buffer pH 8.0, 200 mM NaCl, 500 mM imidazole. Elution fractions containing the 6H-TmHydF protein were pooled and the imidazole concentration was lowered by multiple concentration/dilution steps on a YM-30 membrane. The protein was then aliquoted, flash-frozen, and stored at 193 K. In the case of the as-isolated form of the protein, the same protocol as described above was used but the cell lysis and Ni–NTA column chromatography were performed in an anaerobic atmosphere.
A purification protocol has already been reported for WT-TmHydF; however, the following revised procedure was found to increase the yield significantly. Cells transformed with the p6H-TmHydF plasmid were grown in Miller’s modified LB medium supplemented with ampicillin and chloroamphenicol at 310 K, until the optical density at 600 nm reached 0.5, and protein expression was induced by addition of isopropyl β-D-thiogalactopyranoside to a final concentration of 0.5 mM. After 5 h, the cells were pelleted and stored at 193 K until use. For purification, the cells were thawed in the presence of lysozyme (0.6 mg ml−1) and 0.5 % Triton X-100 and discontinuously sonicated for 15 min. Cellular extracts were then centrifuged at 250,000g for 90 min at 277 K and the resulting supernatant was heated at 348 K for 12 min. Precipitated E. coli proteins were eliminated by centrifugation at 7,000g for 10 min at 293 K. Ammonium sulfate was slowly added to the supernatant at 277 K to a final concentration of 65 % (w/v). The cloudy solution was stirred for 30 min and centrifuged at 7,000g for 10 min at 277 K, and the supernatant was discarded. The resulting off-white pellet was redissolved in a 50 mM Tris–HCl buffer pH 8, 150 mM NaCl, 1 M ammonium sulfate buffer (buffer A) under stirring. The first chromatographic step was performed on a butyl Sepharose 4 FF column (GE Healthcare, flow rate 0.8 ml min−1). After the column had been washed with buffer A, removing all nucleic acids and remaining E. coli contaminants, WT-TmHydF was eluted with a gradient from 100 % buffer A to 100 % buffer B (50 mM Tris–HCl, pH 8, 150 mM NaCl). The remaining ammonium sulfate was then removed on a HiPrep 26/10 desalting column (GE Healthcare) by elution with buffer B, and the protein was concentrated using Amicon 30-kDa centrifugal filters (Millipore). The apo form of WT-TmHydF was generated by overnight treatment of the protein with 10 mM EDTA under reducing conditions (2 mM sodium dithionite) in order to remove any residual metal ions. Apo-WT-TmHydF was then purified on a Superdex S-75 column (GE Healthcare) using buffer B as described above (flow rate 0.5 ml min−1). Elution fractions containing the WT-TmHydF protein were pooled and concentrated using Amicon 30-kDa centrifugal filters. The protein was finally aliquoted, flash-frozen, and stored at 193 K.
In vitro reconstitution
Fe–S cluster reconstitution of apo-HydF was conducted under strictly anaerobic conditions in a Jacomex NT glove box with less than 2 ppm O2. After incubation of apo-HydF (150 μM) with a tenfold molar excess of dithiothreitol for 10 min, a sixfold molar excess of ferrous ammonium sulfate [(NH4)2Fe(SO4)2·6H2O], or alternatively a sixfold molar excess of 57Fe(SO4) when preparing samples for Mössbauer spectroscopy, was added, followed by addition of a sixfold molar excess of L-cysteine and a catalytic amount of the E. coli cysteine desulfurase CsdA (1–2 % molar equivalent). Evolution of protein reconstitution was monitored by recording UV–visible spectra every 10 min until the absorbance at 410 nm reached a plateau. Holo-HydF was then desalted on a NAP-25 cartridge and concentrated with Amicon Ultra 10-kDa centrifugal filters (Millipore). In those cases when a His-tag was present in the protein, the solution was also treated with a sixfold molar excess of EDTA in order to remove unspecific iron prior to the desalting step. Additionally, in the case of WT-TmHydF, reconstitutions were performed in which the amount of ferrous salt and cysteine was varied between sixfold and12-fold molar excess in order to study the effect of increasing the amount of cysteine and iron used in the reconstitution step.
Electron paramagnetic resonance
X-band EPR spectra were recorded with a Bruker ESP 300D spectrometer equipped with an Oxford Instruments ESR 900 flow cryostat. Protein samples were anaerobically reduced with ten molar equivalents of sodium dithionite before freezing. Spin quantifications of the S = 1/2 resonances were assessed by comparing the double integrals with those of a 1 mM CuEDTA solution at the same temperature, as previously described [17], using non-power-saturating conditions for both the sample and the standard.
HYSCORE spectroscopy
HYSCORE experiments were performed using a Bruker Elexsys E-580 X-band pulsed spectrometer with a Bruker ER4118X dielectric resonator and a continuous-flow helium cryostat (Oxford Instruments CF935) controlled by an Oxford Instruments ITC 503 temperature controller. Experiments were performed at 10 K using the standard four-pulse sequence (π/2–τ–π/2–t1–π–t2–π/2–echo) with a nominal pulse width of 16 ns for π/2 pulses and 32 ns for π pulses, a τ value of 132 ns, and a shot repetition rate of 1 kHz. Unwanted echoes were removed by four-step phase cycling. A 128 × 128 dataset was recorded with times t1 and t2 incremented in 24-ns steps from an initial value of 200 ns. This dataset was processed using Xepr (Bruker). The background decay in both dimensions was subtracted using a linear fit, followed by apodization with a Hamming window and zero-filling to 2,048 points in each dimension. The two-dimensional Fourier transform magnitude spectrum was calculated and presented as a contour plot. The isotropic hyperfine coupling constant of interacting nitrogen was obtained from the double quantum–double quantum correlation signal using the standard relation
| (1) |
where vN is the nuclear Zeeman frequency, aN is isotropic hyperfine coupling constant, K is the quadrupole coupling constant, and η is the asymmetry parameter [18].
Mössbauer spectroscopy
Samples were prepared as described earlier. The imidazole-containing samples were generated by incubating the freshly reconstituted protein with a 25-fold excess of imidazole for 20 min before flash-freezing. Mössbauer spectra were recorded at 4.2 K, either using a low-field Mössbauer spectrometer equipped with a Janis SVT-400 cryostat or using a strong-field Mössbauer spectrometer equipped with an Oxford Instruments Spectromag 4000 cryostat containing an 8-T split-pair superconducting magnet. Both spectrometers were operated in a constant acceleration mode in transmission geometry. The isomer shifts are referenced against that of a metallic iron foil at room temperature. Analysis of the data was performed with the program WMOSS (WEB Research, Edina, MN, USA).
Resonance Raman spectroscopy
6H-TmHydF and WT-TmHydF were reconstituted as described earlier and concentrated to approximately 2 mM in [4Fe–4S]2+ clusters using anaerobic Amicon ultrafiltration with a YM30 membrane. Resonance Raman spectra were recorded at 17 K using frozen droplets of sample mounted on the cold finger of a Displex CSA-202E closed cycle refrigerator (Air Products, Allentown, PA, USA) as previously described [19], using a simple anaerobic cell for low-temperature Raman spectroscopy, and a Ramanor U1000 scanning spectrometer (Instruments, Edison, NJ, USA) coupled with a Sabre argon ion laser (Coherent, Santa Clara, CA, USA).
Results
Cloning and isolation of the HydF protein
Several recombinant forms of TmHydF have been isolated. The apo form of WT-TmHydF was obtained via a modified literature procedure as described in “Materials and methods” [14]. To facilitate purification, a His-tagged version of the protein, 6H-TmHydF, was also generated, and two mutants (H304C-6H-TmHydF and H352C-6H-TmHydF) of the latter protein were also cloned and isolated. The aerobic purification of 6H-TmHydF using a Ni–NTA column results in the isolation of a pure apoprotein that migrates as a single band on a denaturing polyacrylamide gel and which was identified as the 6H-TmHydF protein by N-terminal sequencing and mass spectrometry (data not shown). The facile and fast purification of the tagged protein also allowed us to isolate it under strict anaerobic conditions following the same protocol (as-isolated 6H-TmHydF, hereafter referred to as 6H-TmHydF-AS), which allows conservation of the cluster (see later).
A [4Fe–4S] cluster in TmHydF
Primary sequence alignment analysis of HydF proteins from different HydF-containing organisms reveals the conservation of three cysteine residues located in the C-terminal region, indicating the capacity to bind an iron–sulfur cluster, and indeed our initial study on reconstituted TmHydF, as well as later studies on as-isolated forms, has shown that HydF incorporates a [4Fe–4S] cluster [14, 20–22]. In this study, the iron–sulfur cluster content was determined for both reconstituted and as-isolated samples, the latter being obtained through anaerobic purification in order to preserve the native iron–sulfur clusters. Enzymatic reconstitution performed by treating TmHydF and 6H-TmHydF with a sixfold molar excess of ferrous iron and cysteine in the presence of dithiothreitol and a cysteine desulfurase generates a [4Fe–4S] cluster in both cases. The reconstituted protein exhibits a UV–visible spectrum which displays a broad absorption band around 410 nm (ɛ ≈ 17,000 M−1 cm−1 in the case of reconstituted WT-TmHydF (WT-TmHydF-RC), in agreement with the brown color of the protein and similar to S–Fe charge transfer bands generally observed in [4Fe–4S] cluster containing proteins. The presence of a single [4Fe–4S] cluster is also in agreement with iron and sulfide quantification. Under standard reconstitution conditions, the protein accumulates 3.9 ± 0.4 Fe and 3.7 ± 0.2 sulfide ions per monomer for WT-TmHydF-RC. When a larger excess of cysteine and Fe2+ ions are introduced in the reaction in an attempt to form additional clusters, the amount of iron increases to 7.7 ± 0.4 Fe per monomer; however, the amount of sulfide found increases only marginally (4.4 ± 0.4). Thus, the iron and sulfide quantification measurements are in agreement with the formation of a single [4Fe–4S] cluster per monomer, the increase in the amount of iron observed when a large excess is used during the reconstitution most likely being due to unspecific binding of iron to the protein. Excess iron is also observed in the case of reconstituted 6H-TmHydF (6H-TmHydF-RC), for which 5.2 ± 0.4 Fe per monomer was observed. That HydF has the potential to bind two clusters has been a matter of discussion [20–22]. Our study shows that, at least under the specific reconstitution conditions used here, this is unlikely to be the case.
The anaerobically purified 6H-TmHydF-AS protein was not subjected to a cluster reconstitution, as iron and sulfide quantification, 2.5 Fe and 3.0 S2− per monomer, as well as its EPR spectrum (see later) showed the presence of a single protein-bound cluster.
Spectroscopic characterization of TmHydF
EPR spectroscopy
The presence of a [4Fe–4S] cluster in TmHydF is further supported by the observation of an axial EPR signal, g|| ~ 2.05 and g⊥ ~ 1.90, when the proteins are reduced with an excess of sodium dithionite at pH 8.0 (Fig. 1). 6H-TmHydF-AS, 6H-TmHydF-RC, and WT-TmHydF-RC displayed almost identical signals in this region (Fig. 1). These S=1/2 signals have microwave power and temperature saturation properties characteristic of a reduced [4Fe–4S]+ center. However, the His-tagged samples exhibit an additional broad low-field resonance at g ~ 5.4, indicative of a rhombic S = 3/2 [4Fe–4S]+ cluster with E/D ~ 0.3, that is not observable in the WT-TmHydF-RC sample. Using ɛ410 ≈ 17,000 M−1 cm−1 to assess the [4Fe–4S]2+ cluster concentration prior to reduction, we found that spin quantifications of the S = 1/2 component in both His-tagged samples accounted for 0.20 ± 0.05 spins per cluster, compared with 0.7 ±0.1 spins per cluster in WT-TmHydF. In light of the redox potentials for the [4Fe–4S]2+/+ couples reported below, incomplete reduction coupled with a major fraction of the reduced clusters exhibiting an S = 3/2 ground state is likely to be responsible for the low S=1/2 spin quantifications of reduced 6H-TmHydF. A similar intense S = 3/2 signal has also been observed for the native protein in the presence of imidazole [14].
Fig. 1.
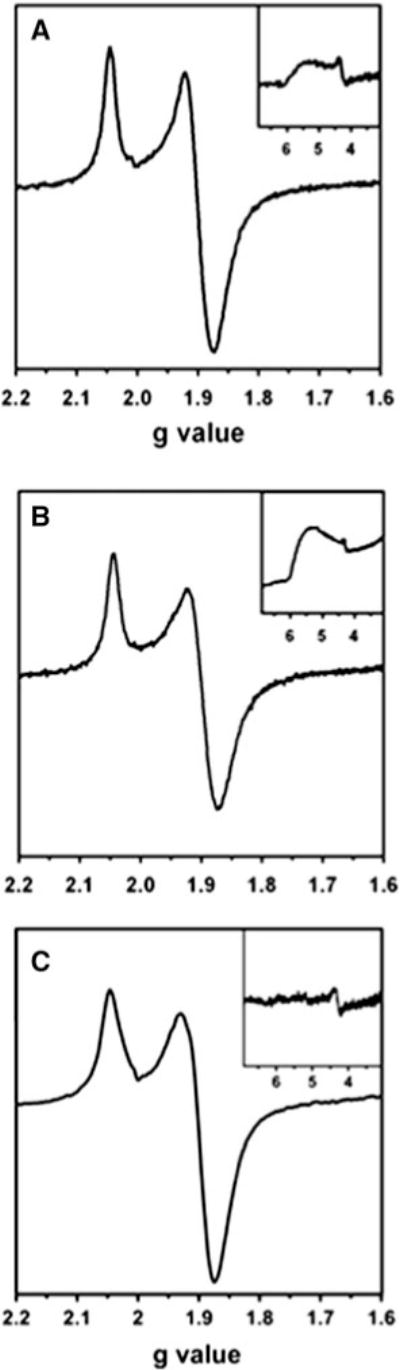
X-band EPR spectra of dithionite-reduced HydF proteins from Thermotoga maritima (TmHydF). a Anaerobically purified asisolated His-tagged protein, 6H-TmHydF-AS. b Reconstituted His-tagged protein, 6H-TmHydF-RC. c Reconstituted wild-type protein, WT-TmHydF-RC. Modulation amplitude 1 mT, T = 10 K, microwave power 1 mW. The insets show the low-field signal recorded at 4 K and with a microwave power of 4 mW
HYSCORE spectroscopy
HYSCORE spectroscopy is a two-dimensional pulsed EPR technique which allows detection of hyperfine coupling of nuclei with a low gyromagnetic moment in nonoriented systems. In the case of a strong coupling between an S = 1/2 cluster with an I = 1 nuclear spin nucleus such as 14N, it is possible to observe a characteristic pattern in the (−, +) quadrant with so-called double quantum-double quantum correlation features. Such features have been observed in only a few cases, such as proteins in which histidine is ligated to a [2Fe–2S] cluster [7, 8], some radical S-adenosylmethionine proteins, with the IspH protein treated with pyridine derivatives, and in the case of HydF treated with imidazole [14, 23–26].
The HYSCORE spectrum of the reduced WT-TmHydF presented no cross-coupling peaks except those corresponding to distant 13C atoms present in natural abundance and 1H atoms, thus excluding a nitrogen atom in the coordination sphere of the cluster (Fig. 2a). The HYSCORE spectrum of reduced 6H-TmHydF-RC, on the other hand, was drastically different (Fig. 2b). The latter contained a complex pattern of peaks in the (−, +) quadrant characteristic of a strongly coupled nitrogen atom. In particular, it was possible to observe a pair of double quantum–double quantum correlation peaks at (2.4, 7.0) and (7.0, 2.4) MHz, respectively, corresponding to a hyperfine coupling constant a of 3.8 MHz and a quadrupolar coupling constant K of 1 MHz. This spectrum is similar to that of a WT-TmHydF preparation treated with imidazole (Fig. 2c). To characterize further this cluster ligation, an 15N-labeled 6H-TmHydF sample was prepared and reconstituted, and the HYSCORE spectrum obtained shows only two small correlation ridges centered at (3.8, 1.0) and (1.0, 3.8) MHz, in agreement with a strongly coupled 15N atom (I = 1/2) (Fig. 2d). Thus, these results show that when a histidine-containing tag is present on the protein, the iron–sulfur cluster on the TmHydF protein acquires a nitrogen ligand not present in the wild-type protein.
Fig. 2.
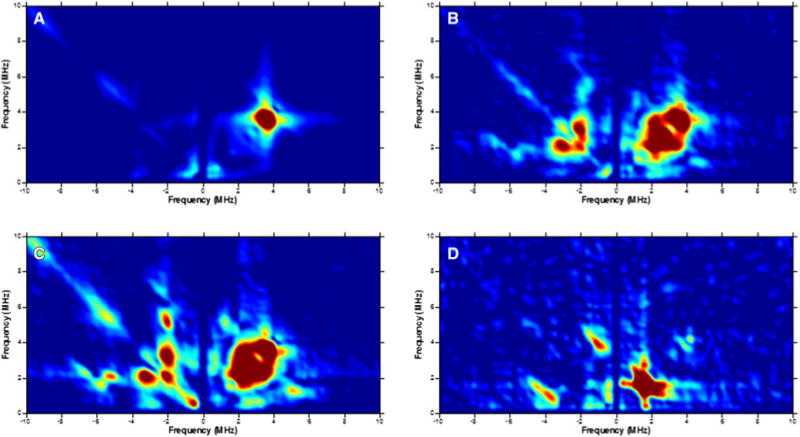
Hyperfine sublevel correlation spectra at 9.71 GHz and g⊥ ∼ 1.90 of WT-TmHydF (a), 6H-TmHydF (b), WT-TmHydF plus imidazole (c), and 15N-labeled 6H-TmHydF (d). The spectra in b and d exhibit a very similar pattern characteristic of a strongly coupled 14N nucleus with a pair of double quantum–double quantum correlation peaks at (2.4, 7.0) and (7.0, 2.4) MHz, respectively, corresponding to a hyperfine coupling constant a of 3.8 MHz and a quadrupolar coupling constant K of 1 MHz. The spectrum of 15N-labeled 6H-TmHydF (d) with two small correlation ridges centered at (3.8, 1.0) and (1.0, 3.8) MHz is characteristic of a strongly coupled 15N nucleus (I = 1/2) and thus confirms this assignment. No pattern in the (−, +) quadrant in particular double quantum–double quantum correlation peaks from a strongly coupled 14N nucleus is observed for the wild-type protein (a)
To rule out the possibility of the tag inducing a structural change to the protein resulting in the coordination of one of the two highly conserved histidine residues in the C-terminal end of the protein (and relatively close to the conserved cysteine residues proposed to ligate the cluster), namely, H304 and H352 for TmHydF, the two corresponding histidine-to-cysteine single His-tagged mutants were generated. The EPR spectra of both reconstituted single mutants were essentially unchanged compared with the EPR spectrum of the parent 6H-TmHydF-RC shown in Fig. 1c, with identical S = 1/2 and S = 3/2 signals (data not shown). HYSCORE spectra of the H304C-6H-TmHydF-RC and H352C-6H-TmHydF-RC mutants were recorded and were found to be similar to the HYSCORE spectrum of 6H-TmHydF-RC (Fig. S2). Hence, the nitrogen ligand of the [4Fe–4S] cluster detectable in the 6H-TmHydF is not derived from either H304 or H352.
Mössbauer spectroscopy and resonance Raman spectroscopy
To further characterize the iron–sulfur cluster present in the protein, WT-TmHydF-RC was investigated by both Mössbauer spectroscopy and resonance Raman spectroscopy. Additionally, both 6H-TmHydF-RC and the imidazole-treated WT-TmHydF-RC were subjected to the same analysis in order to assess how nitrogen ligation influences the Mössbauer and resonance Raman properties of the cluster. The Mössbauer spectrum of WT-TmHydF-RC without imidazole (Fig. 3, top spectrum) displays a major asymmetric doublet accounting for 77 % of total iron, which is well simulated as the superposition of two equal intensity doublets with the following parameters: δ1 = 0.46 mm s−1, ΔEQ1 = 1.23 mm s−1, δ2 = 0.44 mm s−1, and ΔEQ2 = 0.96 mm s−1 (green line in Fig. 3). These values are typical for [4Fe–4S]2+ clusters composed of two valence-delocalized [Fe2S2]+ pairs and do not differ from those obtained for [4Fe–4S]2+ clusters with all-cysteinyl ligation [27]. Additionally, a magnetically split signal can be simulated with parameters reported for [4Fe–4S]+ clusters [28] (red line in Fig. 3). This signal accounts for about 16 % of total iron. Ultimately, a small contribution (7 %) from adventitious Fe2+ (δ = 1.40 mm s−1, ΔEQ = 3.27 mm s−1) has to be added in order to account for the absorption at +3 mm s−1. The addition of imidazole results in very limited changes to the spectrum (Fig. 3, bottom spectrum). The solid line is an attempt to fit it with the same species as for the spectrum above. The only mismatch is a shoulder at +2 mm s−1 and a slight overestimation of the high-energy line of the [4Fe–4S]2+ doublet. If this were attributed to a differentiated iron site in the [4Fe–4S]2+ cluster, such a site would not represent more than 4 % of total iron, and the corresponding [4Fe–4S]2+ cluster would not represent more than 23 % of all [4Fe–4S]2+ clusters. We conclude that imidazole ligation does not significantly alter either of the valence-delocalized pairs in the [4Fe–4S]2+ cluster.
Fig. 3.
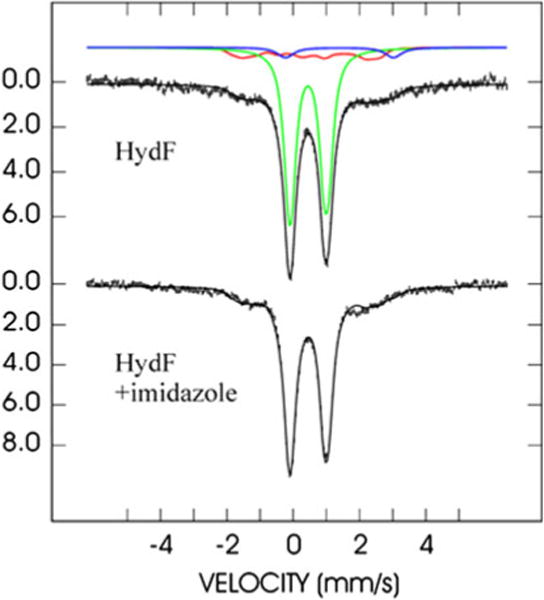
Mössbauer spectra of WT-TmHydF-RC and imidazole-treated WT-TmHydF-RC recorded at 4.2 K in a magnetic field of 600 G applied parallel to the direction of the γ-rays. The experimental spectra are represented with vertical error bars. The solid black lines overlaid with the experimental data are theoretical simulations with parameters mentioned in the text. Their breakdown into individual components is represented by colored solid lines: [4Fe–4S]2+ cluster in green, [4Fe–4S]+ cluster in red, and adventitious Fe2+ in blue
The resonance Raman spectra of WT-TmHydF-RC and 6H-TmHydF-RC are both characteristic of the presence of a [4Fe–4S]2+ center and are similar (Fig. 4). Resonance Raman spectroscopy has proven to be very sensitive to replacement of a single cysteinate ligand by serinate or aspartate in [2Fe–2S]2+ and [4Fe–4S]2+ clusters [6, 29–31] and to the presence of one or two histidyl ligands in place of cysteinate ligands in [2Fe–2S]2+ clusters [11, 32, 33]. In contrast, here, the frequencies and relative intensities of the dominant symmetric breathing mode of the [4Fe–4S] cubane (336 cm−1) and the asymmetric stretching of the Fe–S(Cys) modes (353 and 366 cm−1) are essentially the same in both WT-TmHydF-RC and 6H-TmHydF-RC and are similar to values obtained for clusters with all-cysteinyl ligation [34]. Moreover, the low frequencies of these bands, compared with those of [4Fe–4S]2+ centers with single serinate or aspartate ligands, argue against an oxygenic ligand as the displaceable ligand in WT-TmHydF. There are, however, some significant differences in the weakly enhanced bands in the low-frequency region below 310 cm−1, which are associated primarily with asymmetric stretching modes of the [4Fe–4S] cubane. For WT-TmHydF-RC, the bands in this region have frequencies similar to those of all-cysteine-ligated [4Fe–4S] ferredoxins, but this is not the case for 6H-TmHydF-RC. On the basis of the results for [2Fe–2S]2+ centers with one or two histidyl ligands, the anomalous spectrum observed for 6H-TmHydF-RC in this region probably reflects extensive mixing of Fe–S stretching with Fe–N(His) stretching, which is expected to have a fundamental frequency in the 220–280-cm−1 region. Thus, the vibrational consequences of histidinyl or imidazole ligation in place of a cysteinate ligand in a [4Fe–4S]2+ cluster appear to be much less pronounced than those observed with an oxygenic ligand because of the effective mass of imidazole being more comparable to that of sulfur than to that of oxygen. Hence, resonance Raman spectroscopy cannot be used to provide a reliable assessment of histidyl ligation of a [4Fe–4S]2+ cluster.
Fig. 4.
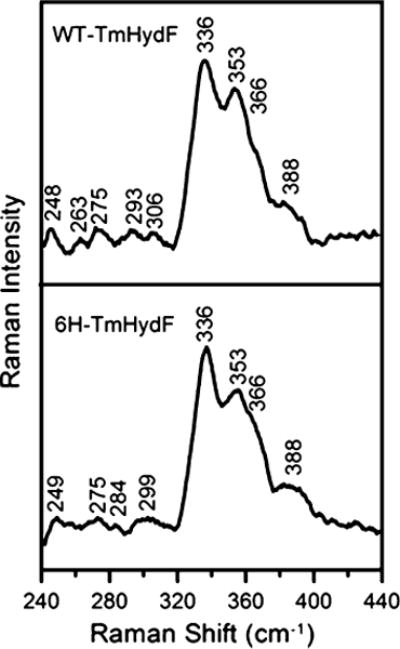
Resonance Raman spectra of WT-TmHydF-RC and 6H-TmHydF-RC. The spectra were recorded at 17 K using frozen droplets (approximately 2 mM in [4Fe–4S]2+ clusters) with 458-nm laser excitation and 7-cm−1 resolution. Bands originating from the frozen buffer solution have been subtracted from both spectra
Discussion
HydF provides a convenient model for finding the specific spectroscopic tools that would allow identification of histidine coordination to a [4Fe–4S] cluster. Previous results, confirmed here, have shown that in vitro enzymatic reconstitution of the apoprotein from T. maritima with iron, cysteine, and cysteine desulfurase generates a single [4Fe–4S]2+ cluster chelated by three cysteines and displaying an exchangeable coordination site. Moreover, the results reported herein on samples obtained following anaerobic purification, thereby circumventing the need for in vitro reconstitution, support the notion that this holds true also in vivo. In the native state the ligand occupying this site is unknown, but a nitrogen-based ligand is excluded on the basis of the HYSCORE spectroscopy findings. The same situation is found in HydF from Thermotoga neapolitana, but in the case of HydF from Clostridium acetobutylicum a histidine is claimed to be the fourth ligand of the cluster [35]. However, in the light of the results presented herein, this claim may need to be reevaluated, since the last preparation contained a Strep-tag II (an eight amino acid oligopeptide featuring a histidine residue) and no control was reported regarding the possibility that the histidinyl ligation could originate from the tag (see below). In the case of TmHydF, we have shown that the exchangeable site can be occupied by an exogenous imidazole ligand so that a defined [4Fe–4S]–imidazole complex becomes available [14]. An accessible iron coordination site suggests that it might be involved in substrate binding and transfer during hydrogenase maturation. In agreement with this, we recently established that HydF containing its [4Fe–4S] cluster is able to bind a diiron synthetic complex, mimicking the active site of HydA, via a bridging cyanide ligand, and to eventually use it to activate apo-HydA [36].
During the course of this study we also discovered a second model for such cluster coordination, since the cluster of a His-tagged HydF preparation was shown to be coordinated by a histidine present in the added tag, as unambiguously shown by the HYSCORE spectroscopic characterization reported herein. This shows that, whereas tags may facilitate purification, they may also participate in metal coordination in metalloenzymes, and one should be careful to systematically check such a possibility. Moreover, it is noteworthy that in the case of HydF from T. neapolitana which was also His-tagged, no evidence for histidinyl ligation could be obtained by HYSCORE spectroscopy [37].
The two models, with either imidazole or the His-tag bound to the cluster, were submitted to EPR, HYSCORE, Mössbauer, and resonance Raman spectroscopy, and their spectroscopic properties were compared with those of the wild-type untagged HydF protein, so this study provides the first full spectroscopic characterization of the HydF protein. Furthermore, comparison of these spectroscopic parameters with those of all-cysteine-ligated [4Fe–4S] clusters from the literature allows a more complete evaluation of the consequences of histidinyl/imidazole ligation at a unique iron site. The outcomes of this study are the following.
First, clear evidence for imidazole/histidine binding to the reduced cluster was provided by HYSCORE spectroscopy (Fig. 2). The values obtained for the 14N hyperfine coupling constants (imidazole 4.8 MHz, His-tag 3.8 MHz), derived from the specific double quantum–double quantum correlation peaks in the (−, +) quadrant of the spectrum, cannot be compared with those of other [4Fe–4S]+ clusters with imidazole or histidinyl ligation at a unique site, since there is so far no report of a similar HYSCORE study of such a system. However, these values are in the range of the values obtained in the case of clusters in which nitrogens directly bind to iron centers. For example, in Rieske-type [2Fe–2S] proteins aiso(14N) of the coordinated histidine nitrogens is 4.3–5.5 MHz [7], in the [4Fe–4S] enzyme MoaA (which also has a unique fourth iron), aiso(14N) of N1 of the substrate guanosine 5′-triphosphate bound to the fourth iron is 3.6 MHz [38], in the case of radical S-adenosylmethionine enzymes, HYSCORE studies have reportedaiso(14N values in the range 5.6–6.5 MHz [24, 26], and finally in the enzyme IspH with one pyridine derivative coordinated to one iron of its [4Fe–4S] cluster, aiso(14N) is 7.4 MHz [23]. Recently, the presence of a histidine ligand of the cluster of HydF from C. acetobutylicum tagged with Strep-tag II was concluded from HYSCORE experiments [aiso(14N) = 4.2 MHz] [37]. We thus suggest that HYSCORE spectroscopy be used for identifying a histidinyl ligation in Fe–S proteins, with aiso(14N) ≈ 6 MHz as characteristic of the presence of an Fe–N bond.
Second, the EPR spectrum of the [4Fe–4S]–histidine complex in 6H-TmHydF displayed an intense signal at g ~ 5.4 characteristic of an S = 3/2 [4Fe–4S]+ cluster, accounting for a large proportion of the iron present in the protein (Fig. 1). However, this cannot be used as an indicator of histidyl ligation, as there are many examples of S = 3/2 [4Fe–4S]+ clusters with all-cysteinyl ligation or with a single serine or aspartate ligand [5, 6].
Third, imidazole or histidine binding to the [4Fe–4S]2+ cluster has a minimal effect on the Mössbauer and resonance Raman spectra of HydF, rendering Mössbauer spectroscopy and resonance Raman spectroscopy ineffective for reliably detecting histidine coordination to a [4Fe–4S] cluster in a protein (Figs. 3, 4).
In conclusion, the spectroscopic characterization of a protein containing a [4Fe–4S] cluster ligated by three cysteines and a single nitrogen atom (from imidazole or histidine) indicates that evidence for nitrogen ligation cannot be obtained from the resonance Raman and Mössbauer spectra in the oxidized state. We propose that of the spectroscopic techniques used here (resonance Raman, Mössbauer, EPR, and HYSCORE spectroscopy), only HYSCORE spectroscopy of the protein in the reduced state provides signals which can be unambiguously assigned to nitrogen ligation. In the case of HydF, HYSCORE spectroscopy demonstrated that a histidine residue from a His-tag served as a ligand of the [4Fe–4S]+ cluster. Indeed, this observation raises the possibility that a His-tag, which is commonly used for protein purification purposes, may adventitiously coordinate metal centers. Consequently care needs to be taken to exclude coordination by a histidine of the His-tag when a metalloenzyme is purified as a polyhistidine-tagged protein.
Supplementary Material
Acknowledgments
G.B. gratefully acknowledges support from the Bengt Lundqvist Minnesfond, FORMAS (contract number 213-2010-563), and the Swedish Royal Academy of Sciences. EPR and resonance Raman studies were supported by a grant from the National Institutes of Health (GM62524 to M.K.J.).
Footnotes
Electronic supplementary material The online version of this article (doi:10.1007/s00775-013-1062-9) contains supplementary material, which is available to authorized users.
Contributor Information
Gustav Berggren, Laboratoire de Chimie et Biologie des Métaux, Équipe «Biocatalyse», Institut de Recherches en Technologies et Sciences pour le Vivant, iRTSV-LCBM/Biocat, UMR 5249 CEA/CNRS/UJF, CEA/Grenoble, 17, rue des Martyrs, Grenoble, France.
Ricardo Garcia-Serres, Laboratoire de Chimie et Biologie des Métaux, Équipe “Physicochimie des Métaux en Biologie”, Institut de Recherches en Technologies et Sciences pour le Vivant, iRTSV-LCBM/pmb, UMR 5249 CEA/CNRS/UJF, CEA/Grenoble, Grenoble, France.
Xavier Brazzolotto, Laboratoire de Chimie et Biologie des Métaux, Équipe «Biocatalyse», Institut de Recherches en Technologies et Sciences pour le Vivant, iRTSV-LCBM/Biocat, UMR 5249 CEA/CNRS/UJF, CEA/Grenoble, 17, rue des Martyrs, Grenoble, France.
Martin Clemancey, Laboratoire de Chimie et Biologie des Métaux, Équipe “Physicochimie des Métaux en Biologie”, Institut de Recherches en Technologies et Sciences pour le Vivant, iRTSV-LCBM/pmb, UMR 5249 CEA/CNRS/UJF, CEA/Grenoble, Grenoble, France.
Serge Gambarelli, Laboratoire “Résonance Magnétique”, Université Joseph Fourier, Grenoble 1/CEA/Institut Nanoscience et Cryogénie/SCIB, UMR-E3, Grenoble, France.
Mohamed Atta, Laboratoire de Chimie et Biologie des Métaux, Équipe «Biocatalyse», Institut de Recherches en Technologies et Sciences pour le Vivant, iRTSV-LCBM/Biocat, UMR 5249 CEA/CNRS/UJF, CEA/Grenoble, 17, rue des Martyrs, Grenoble, France.
Jean-Marc Latour, Laboratoire de Chimie et Biologie des Métaux, Équipe “Physicochimie des Métaux en Biologie”, Institut de Recherches en Technologies et Sciences pour le Vivant, iRTSV-LCBM/pmb, UMR 5249 CEA/CNRS/UJF, CEA/Grenoble, Grenoble, France.
Heather L. Hernández, Department of Chemistry and Center for Metalloenzyme Studies, University of Georgia, Athens, GA 30602, USA
Sowmya Subramanian, Department of Chemistry and Center for Metalloenzyme Studies, University of Georgia, Athens, GA 30602, USA.
Michael K. Johnson, Department of Chemistry and Center for Metalloenzyme Studies, University of Georgia, Athens, GA 30602, USA
Marc Fontecave, Email: marc.fontecave@cea.fr, Laboratoire de Chimie et Biologie des Métaux, Équipe «Biocatalyse», Institut de Recherches en Technologies et Sciences pour le Vivant, iRTSV-LCBM/Biocat, UMR 5249 CEA/CNRS/UJF, CEA/Grenoble, 17, rue des Martyrs, Grenoble, France; Collége de France, 11 place Marcellin-Berthelot, Paris, France.
References
- 1.Rothery RA, Bertero MG, Cammack R, Palak M, Blasco F, Strynadka NCJ, Weiner JH. Biochemistry. 2004;43:5324–5333. doi: 10.1021/bi049938l. [DOI] [PubMed] [Google Scholar]
- 2.Ohnishi T, Nakamaru-Ogiso E. Biochim Biophys Acta. 2008;1777:703–710. doi: 10.1016/j.bbabio.2008.04.032. [DOI] [PMC free article] [PubMed] [Google Scholar]
- 3.Volbeda A, Charon MH, Piras C, Hatchikian EC, Frey M, Fontecillacamps JC. Nature. 1995;373:580–587. doi: 10.1038/373580a0. [DOI] [PubMed] [Google Scholar]
- 4.Peters JW, Lanzilotta WN, Lemon BJ, Seefeldt LC. Science. 1998;282:1853–1858. doi: 10.1126/science.282.5395.1853. [DOI] [PubMed] [Google Scholar]
- 5.Lindahl PA, Day EP, Kent TA, Orme-Johnson WH, Munck E. J Biol Chem. 1985;260:1160–1173. [PubMed] [Google Scholar]
- 6.Conover RC, Kowal AT, Fu W, Park JB, Aono S, Adams MWW, Johnson MK. J Biol Chem. 1990;265:8533–8541. [PubMed] [Google Scholar]
- 7.Gurbiel RJ, Doan PE, Gassner GT, Macke TJ, Case DA, Ohnishi T, Fee JA, Ballou DP, Hoffman BM. Biochemistry. 1996;35:7834–7845. doi: 10.1021/bi960380u. [DOI] [PubMed] [Google Scholar]
- 8.Gurbiel RJ, Ohnishi T, Robertson DE, Daldal F, Hoffman BM. Biochemistry. 1991;30:11579–11584. doi: 10.1021/bi00113a013. [DOI] [PubMed] [Google Scholar]
- 9.Gurbiel RJ, Batie CJ, Sivaraja M, True AE, Fee JA, Hoffman BM, Ballou DP. Biochemistry. 1989;28:4861–4871. doi: 10.1021/bi00437a051. [DOI] [PubMed] [Google Scholar]
- 10.Dicus MM, Conlan A, Nechushtai R, Jennings PA, Paddock ML, Britt RD, Stoll S. J Am Chem Soc. 2010;132:2037–2049. doi: 10.1021/ja909359g. [DOI] [PMC free article] [PubMed] [Google Scholar]
- 11.Li HR, Mapolelo DT, Dingra NN, Naik SG, Lees NS, Hoffman BM, Riggs-Gelasco PJ, Huynh BH, Johnson MK, Outten CE. Biochemistry. 2009;48:9569–9581. doi: 10.1021/bi901182w. [DOI] [PMC free article] [PubMed] [Google Scholar]
- 12.Messick TE, Chmiel NH, Golinelli MP, Langer MR, Joshua-Tor L, David SS. Biochemistry. 2002;41:3931–3942. doi: 10.1021/bi012035x. [DOI] [PubMed] [Google Scholar]
- 13.Dementin S, Belle V, Bertrand P, Guigliarelli B, Adryanczyk-Perrier G, De Lacey AL, Fernandez VM, Rousset M, Leger C. J Am Chem Soc. 2006;128:5209–5218. doi: 10.1021/ja060233b. [DOI] [PubMed] [Google Scholar]
- 14.Brazzolotto X, Rubach JK, Gaillard J, Gambarelli S, Atta M, Fontecave M. J Biol Chem. 2006;281:769–774. doi: 10.1074/jbc.M510310200. [DOI] [PubMed] [Google Scholar]
- 15.Fish WW. Methods Enzymol. 1988;158:357–364. doi: 10.1016/0076-6879(88)58067-9. [DOI] [PubMed] [Google Scholar]
- 16.Beinert H. Anal Biochem. 1983;131:373–378. doi: 10.1016/0003-2697(83)90186-0. [DOI] [PubMed] [Google Scholar]
- 17.Aasa R, Vanngard T. J Magn Reson. 1975;19:308–315. [Google Scholar]
- 18.Tyryshkin AM, Dikanov SA, Reijerse EJ, Burgard C, Huttermann J. J Am Chem Soc. 1999;121:3396–3406. [Google Scholar]
- 19.Drozdzewski PM, Johnson MK. Appl Spectrosc. 1988;42:1575–1577. [Google Scholar]
- 20.Czech I, Stripp S, Sanganas O, Leidel N, Happe T, Haumann M. FEBS Lett. 2011;585:225–230. doi: 10.1016/j.febslet.2010.11.052. [DOI] [PubMed] [Google Scholar]
- 21.Shepard EM, McGlynn SE, Bueling AL, Grady-Smith CS, George SJ, Winslow MA, Cramer SP, Peters JW, Broderick JB. Proc Natl Acad Sci USA. 2010;107:10448–10453. doi: 10.1073/pnas.1001937107. [DOI] [PMC free article] [PubMed] [Google Scholar]
- 22.Kuchenreuther JM, Britt RD, Swartz JR. PLoS ONE. 2012;7:e45850. doi: 10.1371/journal.pone.0045850. [DOI] [PMC free article] [PubMed] [Google Scholar]
- 23.Wang WX, Li JK, Wang K, Smirnova TI, Oldfield E. J Am Chem Soc. 2011;133:6525–6528. doi: 10.1021/ja2008455. [DOI] [PMC free article] [PubMed] [Google Scholar]
- 24.Chandor A, Douki T, Gasparutto D, Gambarelli S, Sanakis Y, Nicolet Y, Ollagnier-De-Choudens S, Atta M, Fontecave M. C R Chim. 2007;10:756–765. [Google Scholar]
- 25.Gambarelli S, Luttringer F, Padovani D, Mulliez E, Fontecave M. Chembiochem. 2005;6:1960–1962. doi: 10.1002/cbic.200500182. [DOI] [PubMed] [Google Scholar]
- 26.Perche-Letuvee P, Kathirvelu V, Berggren G, Clemancey M, Latour JM, Maurel V, Douki T, Armengaud J, Mulliez E, Fontecave M, Garcia-Serres R, Gambarelli S, Atta M. J Biol Chem. 2012;287:41174–41185. doi: 10.1074/jbc.M112.405019. [DOI] [PMC free article] [PubMed] [Google Scholar]
- 27.Cammack R, Dickson DPE, Johnson CE. In: Iron–sulfur proteins Academic. Lovenberg W, editor. New York: 1977. pp. 283–330. [Google Scholar]
- 28.Middleton P, Dickson DPE, Johnson CE, Rush JD. Eur J Biochem. 1978;88:135–141. doi: 10.1111/j.1432-1033.1978.tb12430.x. [DOI] [PubMed] [Google Scholar]
- 29.Moulis JM, Davasse V, Golinelli MP, Meyer J, Quinkal I. J Biol Inorg Chem. 1996;1:2–14. [Google Scholar]
- 30.Meyer J, Fujinaga J, Gaillard J, Lutz M. Biochemistry. 1994;33:13642–13650. doi: 10.1021/bi00250a014. [DOI] [PubMed] [Google Scholar]
- 31.Brereton PS, Duderstadt RE, Staples CR, Jonhson MK, Adams MWW. Biochemistry. 1999;38:10594–10605. doi: 10.1021/bi990671d. [DOI] [PubMed] [Google Scholar]
- 32.Kuila D, Schoonover JR, Dyer RB, Batie CJ, Ballou DP, Fee JA, Woodruff WH. Biochim Biophys Acta. 1992;1140:175–183. doi: 10.1016/0005-2728(92)90007-o. [DOI] [PubMed] [Google Scholar]
- 33.Tirrell TF, Paddock ML, Conlan AR, Smoll EJ, Nechushtai R, Jennings PA, Kim JE. Biochemistry. 2009;48:4747–4752. doi: 10.1021/bi900028r. [DOI] [PMC free article] [PubMed] [Google Scholar]
- 34.Czernuszewicz RS, Macor KA, Johnson MK, Gewirth A, Spiro TG. J Am Chem Soc. 1987;109:7178–7187. [Google Scholar]
- 35.Joshi N, Shepard EM, Byer AS, Swanson KD, Broderick JB, Peters JW. FEBS Lett. 2012;586:3939–3943. doi: 10.1016/j.febslet.2012.09.028. [DOI] [PubMed] [Google Scholar]
- 36.Berggren G, Adamska A, Lambertz C, Simmons TR, Esselborn J, Atta M, Gambarelli S, Mouesca JM, Reijerse E, Lubitz W, Happe T, Artero V, Fontecave M. Nature. 2013;499:66–69. doi: 10.1038/nature12239. [DOI] [PMC free article] [PubMed] [Google Scholar]
- 37.Berto P, Di Valentin M, Cendron L, Vallese F, Albertini M, Salvadori E, Giacometti GM, Carbonera D, Costantini P. Biochim Biophys Acta. 2012;1817:2149–2157. doi: 10.1016/j.bbabio.2012.09.004. [DOI] [PubMed] [Google Scholar]
- 38.Lees NS, Hanzelmann P, Hernandez HL, Subramanian S, Schindelin H, Johnson MK, Hoffman BM. J Am Chem Soc. 2009;131:9184–9185. doi: 10.1021/ja903978u. [DOI] [PMC free article] [PubMed] [Google Scholar]
Associated Data
This section collects any data citations, data availability statements, or supplementary materials included in this article.