



Abstract
Background
Individuals with diabetes mellitus and pre-diabetes are at particularly high risk of incident heart failure or death, even after accounting for known confounders. Nevertheless, the extent of impairments in cardiac structure and function in elderly individuals with diabetes and pre-diabetes is not well known. We aimed to assess the relationship between echocardiographic measures of cardiac structure and function and dysglycemia
Methods and Results
We assessed measures of cardiac structure and function in 4419 participants without prevalent coronary heart disease or heart failure who attended the ARIC Visit 5 examination (2011-2013) and underwent transthoracic echocardiography (age 75±6 years; 61% female, 23% African-American). Subjects were grouped across the dysglycemia spectrum as normal (39%), pre-diabetes (31%), or diabetes (30%) based on medical history, antidiabetic medication use, and HbA1c levels. Glycemic status was related to measures of cardiac structure and function. Worsening dysglycemia was associated with increased LV mass, worse diastolic function, and subtle reduction in left ventricular systolic function (p ≤ 0.01 for all). For every 1% higher HbA1c, LV mass was higher by 3.0 grams (95% CI: 1.5-4.6 grams), E/E’ by 0.5 (95% CI: 0.4-0.7), and global longitudinal strain by 0.3% (95% CI: 0.2-0.4) in multivariable analyses.
Conclusions
In a large contemporary bi-racial cohort of elderly subjects without prevalent cardiovascular disease or heart failure, dysglycemia was associated with subtle and subclinical alterations of cardiac structure, and left ventricular systolic and diastolic function. It remains unclear whether these are sufficient to explain the heightened risk of heart failure in individuals with diabetes.
Keywords: diabetes, echocardiography, cardiomyopathy
Individuals with diabetes mellitus are at particularly high risk of cardiovascular disease, incident heart failure (HF) and death, even after accounting for known confounders1-6. While a specific cardiomyopathy characterized by diffuse myocardial fibrosis has been identified in some individuals with diabetes7-9 the extent of impairments in cardiac structure and function in elderly individuals with diabetes and pre-diabetes is not well known. Prior studies have shown that individuals with diabetes have increased left ventricular (LV) wall thickness and mass, and impaired diastolic function10,11 in the absence of overt LV systolic dysfunction12; the alterations in cardiac structure and function in less impaired glycemic states or among elderly individuals without prevalent cardiovascular disease are less well described.
To understand the relationship between dysglycemia and cardiac structure and function, we analyzed echocardiographic data from of the Atherosclerosis Risk in Communities (ARIC) Study who attended the fifth visit in 2011 to 2013 and were free of prevalent coronary heart disease or heart failure. We hypothesized that worse dysglycemia, characterized as pre-diabetes and diabetes, would be associated with greater abnormalities of cardiac structure and diastolic and systolic function prior to the development of overt cardiac disease.
Methods
Study Population
ARIC is an ongoing, prospective observational study of the natural history of atherosclerotic diseases and cardiovascular risk factors. The design and sampling of the ARIC Study has been described previously13. Briefly, individuals were recruited from 4 communities (Forsyth County, NC; Jackson, MS; Minneapolis, MN; and Washington County, MD) to participate in a prospective study of cardiovascular disease between 1987 and 1989. Of all 15,792 participants who were enrolled in ARIC at the first examination, a total of 6,533 participants attended the fifth visit between 2011 and 2013 for a standardized physical examination, interviewer-administered questionnaires, and a comprehensive echocardiographic examination14. For the present analysis, we excluded subjects of non-white or non-black race (n=18), without echocardiographic examination (n=418), with prevalent heart disease (heart failure, coronary heart disease, prior myocardial infarction, cardiac pacemaker or defibrillator in place; n=1518), or valvular disease (moderate or severe, prior valve repair or replacement; n=138).
Institutional review boards approved the study protocol at each field center. All participants provided written informed consent and study procedures were conducted in accordance with institutional guidelines regarding the protection of human subjects.
Dysglycemia Classification
Based on annual telephone interviews, comprehensive questionnaires, medication lists, and results of Visit-5 laboratory tests for glycated hemoglobin levels, participants were classified into one of three groups15,16: 1) Diabetes: known diabetes or on anti-diabetes medications, Visit 5-HbA1c ≥ 6.5%; 2) Pre-diabetes: No known diabetes, but visit 5- HbA1c between 5.7 and 6.4%; and 3) Normal: No known diabetes at visits 1 through 5 and annual follow-up data, and visit 5- HbA1c < 5.7%. We identified a group of subjects with undiagnosed diabetes defined as unknown diabetes and not on anti-diabetes medications but with elevated HbA1c. Given the small size of this group, we combined it with the diabetes group. In addition, we also categorized this cohort based on fasting glucose values at visit 5 into three groups: 1) Diabetes: known diabetes or on anti-diabetes medications, visit 5-fasting glucose ≥126 mg/dL or non-fasting glucose>200 mg/dL; 2) Pre-diabetes: No known diabetes, but visit 5-fasting glucose 100-126 mg/ dL; and 3) Normal: No known diabetes at visits 1 through 5 and annual follow-up data, and visit 5-fasting glucose level<100mg/mL.
Echocardiographic analysis
Details about the design and protocol of the ARIC visit 5 echocardiographic study, and reproducibility data, were previously published14. Briefly, all studies were prospectively acquired on Philips IE33 machines by trained sonographers according to a study specific comprehensive echocardiographic protocol. Analyses of 2-dimensional, Doppler, and tissue Doppler echocardiography were performed by expert sonographers and overread by echocardiographers in a central echo core laboratory. The current analysis focused on markers of LV structure: mean LV wall thickness, LV Mass, LV end-diastolic diameter, relative wall thickness (RWT), LV enddiastolic volume; LV diastolic function: left atrial volume and height-indexed LA volume, early mitral inflow peak velocity (E wave), early mitral annulus tissue Doppler velocity (e’) and E/e’; Systolic function: LV ejection fraction, global longitudinal strain (GLS) derived from speckle-tracking echocardiography and RV fractional area change.
Statistical analysis
Baseline characteristics were compared across categories using non-parametric trend test for continuous variables17 and Chi-square test for trend for binary variables. Echocardiographic data are presented as unadjusted and multivariable adjusted means with p-values estimated from linear regression for trend across dysglycemia categories. Adjusted models included age, gender, race, field center, BMI, body surface area, systolic blood pressure, heart rate, history of hypertension, current smoking status, chronic kidney disease status. If a significant trend across categories was detected, then pairwise comparisons of dysglycemia categories were made. We assessed sex-based interactions between echocardiographic measures and dysglycemia categories. If the p for gender interaction was less than 0.05, then sex-specific trend tests were additionally conducted. In order to flexibly assess the continuous relationship between echocardiographic measures and glycated hemoglobin (HbA1c) level among all patients (regardless of known diabetes status), restricted cubic spline regression models were used with 3 knots at the recommended 10th, 50th, and 90th percentiles18. P-values less than 0.05 were considered significant. All analyses were conducted using STATA (Version 12).
Results
Overall, 4419 ARIC Visit 5 participants who were free of prevalent heart disease (no evidence of prevalent HF, prior MI or CHD) were included in this analysis. Diabetes was prevalent in 1256 (29.0%) of those with both glucose and glycated hemoglobin measurements available (n=4334). Utilizing clinical categories of HbA1c, undiagnosed diabetes was found in 64 subjects (1.5%), and pre-diabetes in 1324 (30.6%) subjects. When classified by clinical categories of glucose levels, the prevalence of undiagnosed diabetes and pre-diabetes was 4.2% (n=183) and 38.5% (n=1667), respectively. Overall, there was agreement between the glucose-based and the HbA1c-based diagnoses in 67% of the patients (Supplemental Table 1).
Table 1 shows participants’ characteristics according to dysglycemia status defined by clinical categories of HbA1c with undiagnosed and known diabetes combined in one category. Subjects with diabetes were more likely to be African-American, have a history of hypertension, and evidence of chronic kidney disease by an estimated glomerular filtration rate less than 60 ml/min/1.73m2. Compared to subjects with diabetes or pre-diabetes, those in the normal glycemia category had lower body mass index, heart rate and hs-CRP, and higher LDL and HDL levels (Table 1).
Table 1.
Demographic and clinical characteristics of ARIC visit 5 participants according to dysglycemia status using HbA1c clinical categories
| No diabetes 1742 (39.4%) | Pre-diabetes 1355 (30.7%) | Diabetes 1322 (29.9%) | P for trend | |
|---|---|---|---|---|
| Visit center | 0.77 | |||
| Forsyth County, NC | 427 (24.5%) | 355 (26.2%) | 241 (18.2%) | |
| Jackson, MS | 200 (11.5%) | 283 (20.9%) | 355 (26.9%) | |
| Minneapolis, MN | 635 (36.5%) | 422 (31.1%) | 313 (23.7%) | |
| Washington County, MD | 480 (27.6%) | 295 (21.8%) | 413 (31.2%) | |
| Age (years) | 74.8 [71.5, 79.1] | 74.9 [71.5, 79.3] | 74.5 [71.5, 78.6] | 0.44 |
| Male gender | 682 (39.2%) | 463 (34.2%) | 519 (39.3%) | 0.86 |
| Race (AA) | 213 (12.2%) | 320 (23.64%) | 394 (29.8%) | <0.001 |
| Hypertension | 1236 (71.0%) | 1068 (78.8%) | 1206 (91.2%) | <0.001 |
| BMI (kg/m2) BSA (m2) | 26.4 [23.9, 29.8] | 27.8 [25.0, 31.2] | 29.9 [26.7, 33.6] | <0.001 |
| 1.8 [1.7, 2.0] | 1.8 [1.7, 2.0] | 1.9 [1.7, 2.1] | <0.001 | |
| Ever smoker | 1307 (59.5%) | 791 (58.4%) | 786 (59.5%) | 0.92 |
| Current smoker | 102 (6.0%) | 79 (6.0%) | 70 (5.4%) | 0.52 |
| SBP (mmHg) | 128.0 [118.0, 140.0] | 129.0 [119.0, 140.0] | 129.0 [118.0, 141.0] | 0.26 |
| DBP (mmHg) | 67.0 [60.0, 75.0] | 68.0 [62.0, 75.0] | 66.0 [59.0, 72.0] | 0.001 |
| Pulse (bpm) | 60.0 [54.0, 67.0] | 61.0 [55.0, 68.0] | 63.0 [57.0, 71.0] | <0.001 |
| QRS duration (msec) | 90.0 [84.0, 100.0] | 89.0 [82.0, 98.0] | 90.0 [82.0, 98.0] | 0.02 |
| Diabetes medications | - | - | 753 (57.1%) | By design |
| HbA1c (%) | 5.4 [5.2, 5.5] | 5.9 [5.7, 6.0] | 6.4 [5.9, 7.0] | By design |
| eGFR (ml/min/1.73m2) | 72.9 [61.8, 83.4] | 72.2 [60.7, 83.9] | 72.3 [57.9, 84.4] | 0.09 |
| eGFR< 60 ml/min/1.73m2 | 364 (20.9%) | 327 (24.2%) | 375 (28.6%) | <0.001 |
| Lipid lowering medications | 651 (37.6%) | 697 (51.7%) | 874 (66.3%) | <0.001 |
| LDL Cholesterol (mg/dl) | 112.2 [91.0, 133.8] | 108.8 [89.8, 131.6] | 92.0 [73.2, 114.6] | <0.001 |
| HDL Cholesterol (mg/dl) | 54.9 [45.9, 65.9] | 51.9 [43.9, 60.9] | 46.9 [39.9, 55.9] | <0.001 |
| hs-CRP (mg/l) | 1.7 [0.8, 3.5] | 2.1 [1.0, 4.4] | 2.1 [1.1, 4.5] | <0.001 |
| hs-CRP >3 mg/l | 532 (30.5%) | 498 (36.8%) | 522 (39.8%) | <0.001 |
| NT-pro-BNP (ng/l) | 126.9 [68.3, 224.0] | 103.3 [55.5, 196.7] | 103.3 [53.1, 201.9] | <0.001 |
Data displayed as n (%) or median [25th, 75th percentiles].
AA: African-American, BMI: Body Mass Index, BSA: Body surface area, SBP/DBP: systolic/diastolic blood pressure, bpm: beats per minute, msec: millisecond, eGFR: estimated glomerular filtration rate by CKD-EPI equation.
Left ventricular wall thickness, mass, and relative wall thickness were significantly higher in subjects with diabetes compared to those without diabetes, or pre-diabetes even after adjustment for age, gender, race, center, BMI, body surface area, systolic blood pressure, heart rate, hypertension, smoking, and chronic kidney disease (Table 2). The mean multivariable adjusted LV mass of subjects with diabetes (146 g) was higher than that of subjects with pre-diabetes (142 g) or no diabetes (143 g, p for trend = 0.03). In multivariable models, participants with pre-diabetes had higher inter-ventricular septal wall thickness and relative wall thickness compared to normal subjects. LV end-diastolic and end-systolic volumes were smaller in subjects with diabetes and pre-diabetes compared to those in the normal category likely a consequence of wall thickness being greater (Table 2).
Table 2.
Echocardiographic 'measures of cardiac structure and function by dysglycemia status using HbAlc clinical categories
| Non adjusted means ± SD | Multivariable adjusted means | |||||||||
|---|---|---|---|---|---|---|---|---|---|---|
| Variable | No DM | Pre-DM | DM | p for trend | No DM | Pre-DM | DM | P for trend | ||
| LV structure | LVEDD (cm) | 4.36 ± 0.46 | 4.31 ± 0.48* | 4.40 ± 0.50*# | 0.048 | LVEDD (cm) | 4.38 | 4.33* | 4.36 | 0.12 |
| IVS (cm)* | 1.00 ± 0.14 | 1.03 ± 0.16* | 1.06 ± 0.16*# | <0.001 | IVS (cm)* | 1.02 | 1.03* | 1.04* | <0.001 | |
| Mean wall thickness (cm) | 0.95 ± 0.12 | 0.97 ± 0.13* | 1.00 ± 0.13*# | <0.001 | Mean wall thickness (cm) | 0.97 | 0.98 | 0.99*# | <0.001 | |
| LV mass (g) | 139 ± 37 | 140 ±40* | 151 ± 42*# | 0.003 | LV mass (g) | 143 | 142 | 146*# | 0.03 | |
| LV mass/height27 | 35.4 ± 8.5 | 36.3 ± 9.2* | 38.9 ± 10.1*# | <0.001 | LV mass/height27 | 36.5 | 36.4 | 37.4*# | 0.007 | |
| RWT | 0.42 ± 0.06 | 0.43 ± 0.07* | 0.44 ± 0.08 *# | <0.001 | RWT | 0.421 | 0.428* | 0.432* | <0.001 | |
| LVH | 110 (6.4%) | 119 (8.9%)* | 141 (10.8%)*# | <0.001 | LVH | 7.3% | 8.9% | 9.6%* | 0.04 | |
| Systolic function | LVEDV (ml) | 79.9 ± 22.5 | 77.7± 22.7* | 81.6 ± 23.0# | 0.11 | LVEDV (ml) | 81.3 | 78.8* | 79.5* | 0.003 |
| LVESV (ml) | 27.6 ± 10.1 | 26.8 ± 10.5* | 28.2 ± 11.1# | 0.21 | LVESV (ml) | 28.2 | 27.2* | 27.3* | 0.005 | |
| LVEF(%) | 65.9 ±5.5 | 66.0 ± 5.6 | 66.0 ± 5.7 | 0.52 | LVEF(%) | 65.7 | 66.0 | 66.2* | 0.02 | |
| GLS (%) | −18.5 ± 2.3 | −18.1 ± 2.5* | −17.8 ± 2.4*# | <0.001 | GLS (%) | −18.4 | −18.2* | 18.0*# | <0.001 | |
| RV FAC | 0.53 ± 0.08 | 0.52 ± 0.08 | 0.52 ± 0.08* | 0.02 | RV FAC | 0.53 | 0.52 | 0.53 | 0.33 | |
| Diastolic function | LA volume (ml) | 46.1 ± 16.9 | 45.7 ± 16.7 | 47.9 ± 16.9*# | 0.005 | LA volume (ml) | 47.4 | 46.2* | 45.9* | 0.02 |
| LAV/height2.7 | 11.8 ± 4.2 | 11.8± 4.0 | 12.3 ± 4.1*# | <0.001 | LAV/height2.7 | 12.2 | 11.9* | 11.8* | 0.006 | |
| E wave (cm/s) | 65.2 ± 16.8 | 66.4 ± 17.3 | 67.0 ± 17.5* | 0.004 | E wave (cm/s) | 65 .6 | 66.1 | 66.5 | 0.26 | |
| E-A ratio | 0.87 ± 0.28 | 0.85 ± 0.26 | 0.81 ± 0.24*# | <0.001 | E-A ratio | 0.85 | 0.85 | 0.84* | 0.058 | |
| E' lateral | 7.2 ± 2.1 | 7.0 ± 2.1* | 6.9 ± 2.0* | <0.001 | E' lateral | 7.2 | 7.1 | 6.9*# | <0.001 | |
| E' septal | 5.9 ± 1.5 | 5.8 ± 1.5* | 5.6 ± 1.4*# | <0.001 | E' septal | 5.9 | 5.8 | 5.6*# | <0.001 | |
| E-E' lateral | 9.6 ± 3.4 | 10.1 ± 3.6* | 10.4 ± 3.7*# | <0.001 | E-E' lateral | 9.7 | 10.0* | 10.3*# | <0.001 | |
| E-E' septal | 11.5 ± 3.6 | 12.0 ± 3.8* | 12.5 ± 4.0*# | <0.001 | E-E' septal | 11.6 | 11.8 | 12.5*# | <0.001 | |
Model adjusted for age, gender, race, center, body surface area, BMI, systolic blood pressure, heart rate, hypertension, current smoking and chronic kidney disease.
P<0.05 compared to no dysglycemia.
P<0.05 compared to pre-diabetes.
All measures of LV diastolic function, including early to late mitral inflow velocities (E-to-A ratio), lateral and septal mitral annulus relaxation velocities, and mitral inflow to mitral relaxation velocity ratio (E over E’), were worse in subjects with diabetes in multivariable analyses (Table 2). Subjects with pre-diabetes also demonstrated worse measures of diastolic function than normal subjects, specifically, tissue Doppler derived measures. The early mitral inflow velocity to annular velocity ratio was below the accepted upper limit of normal (15 for septal and 12 for lateral) suggesting on average normal filling pressures. However, E/E’ was higher in both subjects with pre-diabetes and diabetes compared to subjects in the normal group.
LV ejection fraction was within the normal range in the majority of participants and similar across dysglycemia categories (66 ± 6%; p = 0.5). Global longitudinal strain (GLS), while also in the normal range, was worse in subjects with pre-diabetes (−18.1±2.5%) or diabetes (−17.8±2.4%) compared to subjects with no dysglycemia (−18.5±2.3%; p for trend <0.001, Table 2). Right ventricular systolic function was significantly associated with dysglycemia status in univariable analyses (p for trend = 0.02), but not in multivariable analyses (p for trend = 0.33).
Using glycated hemoglobin as continuous marker of dysglycemia in multivariable regression analyses, higher HbA1c levels were significantly associated with worse LV mass, worse markers of LV diastolic and systolic function but not RV systolic function (Figure). For every 1% higher HbA1c, LV mass was higher by 3.0 grams (95% CI: 1.5-4.6 grams), E over E’ by 0.5 (95% CI: 0.4-0.7), and GLS by 0.3% (95% CI: 0.2-0.4).
Figure.
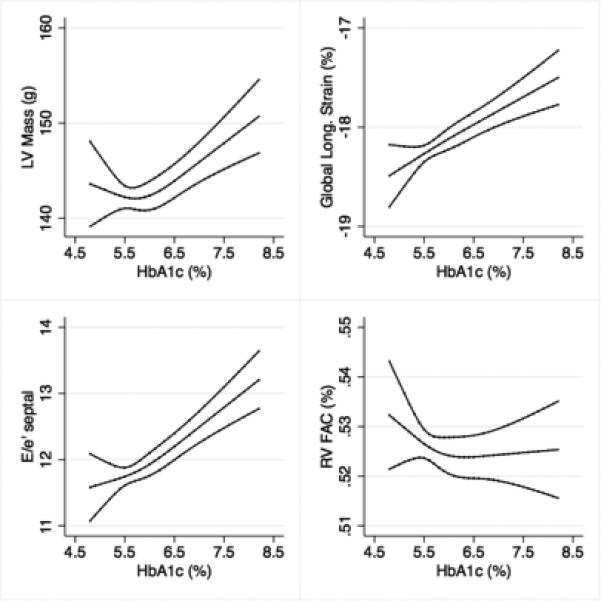
Association between Glycated Hemoglobin (HbA1c) and LV mass, LV systolic and diastolic function, and RV systolic function.
LV: left ventricular. RV FAC: Right ventricular fractional area change. Long.: Longitudinal.
The association between glycated hemoglobin (HbA1c) and echocardiographic measures of cardiac structure and function is displayed with multivariable adjusted restricted cubic splines with 3 knots at the 10th, 50th, and 90th percentiles. The model adjusted for age, gender, race, center, body surface area, BMI, systolic blood pressure, heart rate, hypertension, current smoking and chronic kidney disease. The middle line represents the cubic spline, the upper and lower lines represent the 95% confidence limits.
Race and Gender interactions
We found an interaction between dysglycemia status and gender suggesting that women with diabetes had thicker interventricular septal wall than normoglycemic women, whereas men had similar LV septal wall thickness (multivariable adjusted p for interaction 0.03) (Supplemental Table 2). This interaction was not however observed with other measures of LV structure such as mean wall thickness or relative wall thickness. There was no interaction between sex and dysglycemia categories with regards to LV ejection fraction or measures of diastolic function. An interaction (p for interaction = 0.02) for gender was observed for the relationship between HbA1c and GLS, where women demonstrated a stronger statistical relationship (linear β coefficient 0.3 (95% CI: 0.2-0.5), p<0.001) than men (linear β coefficient 0.2 (95% CI: 0.04-0.4), p=0.02).
We did not observe any statistical interaction by race for the relationship between dysglycemia categories or HbA1c levels and echo measures of cardiac structure and function (data not shown, p value for interactions >0.05).
Discussion
In this large bi-racial cohort of elderly subjects without prevalent coronary heart disease or HF, we demonstrate that both diabetes and pre-diabetes are associated with increased LV mass, worse diastolic function, and subtle reduction in left ventricular systolic function. These findings suggest that hyperglycemic states may contribute to subtle subclinical impairments in cardiac structure and function and propose a potential mechanism by which diabetes mellitus may lead to an increased risk of heart failure independently of prevalent coronary disease.
Increased LV mass and wall thickness are established risk factors for mortality and heart failure19-21. In our analyses, nearly all measures of LV wall thickness and mass, and prevalence of left ventricular hypertrophy were increased in subjects with diabetes compared to those in the normal glycemia category. Subjects with pre-diabetes showed a thicker interventricular septum, and higher relative wall thickness in multivariable adjusted analyses and similar trends in other measures that were not statistically significant. Whether the magnitude of the differences observed is sufficient to be related to worse outcomes in our cohort remains to be assessed.
The Framingham Heart Study showed that worsening glucose tolerance and insulin resistance were associated with increased LV mass and wall thickness, a finding that was more striking in women than men11,22. In our analyses, while we found that diabetes was associated with increased LV mass and wall thickness overall, this was more apparent in women only for interventricular septal wall thickness, and height-indexed LV mass. The association between HbA1c and LV mass was not modified by sex (p for interaction =0.4). The gender interaction with measures of wall thickness and LV mass was not seen in other studies such as the Strong Heart Study10 or the Cardiovascular Health Study12. More importantly, it appears that the magnitude of the association between LV mass and HbA1c although statistically significant may not be clinically important. In our analyses, the change in LV associated with a 1% increase in HbA1c was rather small (3.0 grams (95% CI: 1.5-4.6 grams)), and the average difference between subjects with diabetes and without was approximately 11 grams, similar in magnitude to findings from other studies 10,22, including an MRI based study23. Whether these small differences in LV mass can be related to future outcomes remains to be seen. For comparison, for each increment of 50 grams (per meter) in LV mass the risk of death was increased by 1.5 in men and 2.0 in women in the Framingham Heart Study19.
Alterations in diastolic function have been observed in diabetic cardiomyopathy, and have been ascribed to a number of potential mechanisms, including abnormalities of free fatty acid metabolism, impaired calcium homeostasis or increased myocytes apoptosis24,25,26 among others. The prevalence of diastolic dysfunction among subjects with diabetes has varied across studies owing to differing populations and methods of assessing diastology27-31. We show a lower early to late mitral inflow velocities ratio (E-A ratio) in subjects with diabetes compared to those with pre-diabetes or in the normal group, suggesting worse diastolic function. However, mitral inflow-based measures of diastolic function are not generally considered reliable as they are extremely load dependent and can vary unpredictably as diastolic function worsens32. More reliable measures of early diastolic annular relaxation velocities32 were lower with worsening dysglycemia without evidence that either sex or race modified these relationships. LV filling pressures, as estimated by E/e’, although mostly in the normal range, were also positively associated with dysglycemia category and HbA1c. Prior studies have shown that diabetic individuals develop heart failure subsequent to myocardial infarction at twice the rate of those without diabetes with similar heart sizes and ejection fraction33. That diastolic function appears to worsen with dysglycemia suggests a mechanism whereby individuals with diabetes may be at increased risk of HF.
In this selected study population free of prevalent coronary heart disease or heart failure and a normal LV ejection fraction, we found no association between LV ejection fraction and dysglycemia category or hemoglobin A1c. Indeed, the association between LV systolic function and dysglycemia has been inconsistent across previous studies. The Cardiovascular Health Study showed no association between severity of diabetes and LV fractional shortening12 and an early analysis from the Framingham Heart Study showed a slight decrease in fractional shortening only among men11. In a cardiac MRI study of 1603 Framingham Study Offspring participants there was no association between diabetes and MRI derived LV ejection fraction34.
Nevertheless, we found that global longitudinal strain (GLS), a more sensitive measure of systolic function than ejection fraction35,36, was related to worsening dysglycemia and increasing HbA1c for both men and women. The association between HbA1c and GLS appeared to be stronger for women than men. Other smaller studies37-40 have also demonstrated preclinical decreases in LV systolic function in patients with diabetes, possibly related to duration of diabetes or severity of nephropathy. It is important to note that our findings were independent of left ventricular hypertrophy or hypertension status as surrogates for end-organ damage from long-standing hypertension.
We also show an association between right ventricular function and diabetes status in unadjusted analyses, albeit it was not statistically significant in multivariable models. The association between HbA1c and right ventricular function was also not significant in adjusted analyses. While a handful of small studies have shown right ventricular impairments associated with diabetes41-43, there is, however, little data about the prognostic value of RV function in a non-disease state and its relationship with HF incidence. Although RV fractional area change is a validated measure of RV systolic function that has been correlated with MRI derived ejection fraction44,45 and associated with clinical outcomes46, it is possible that subclinical impairments in RV function related to dysglycemia cannot be captured by RV fractional area change measurement and may explain the lack of association in our analyses.
A number of limitations of this analysis should be noted. The cross-sectional nature of this analysis cannot establish longitudinal trends or causes, but describes associations. ARIC visit 5 was completed in 2011-2013, and thus we cannot assess the relationship between these measures of cardiac structure and function and outcomes at this time. We could only assess cardiac structure and function in ARIC 5th visit participants who were free of prevalent heart disease, and thus these results may not be generalizable to all elderly subjects. Moreover, despite excluding ARIC participants with prevalent coronary heart disease or heart failure, the prevalence of pre-diabetes or diabetes (61%) in the ARIC cohort was high compared to national prevalence numbers47 (48% among subjects older than 65 years). In an analysis performed in the Framingham Heart Study, where the mean age was less than 60 years, only 20% of the cohort had pre-diabetes or diabetes22, whereas in a Strong Heart Study analysis (n=2754, mean age 60 years) 66% had diabetes10. Our measure of dysglycemia was based on single laboratory values HbA1c levels, in addition to self-reports and/or history of medication use, and there was no glucose tolerance testing or repeated measurements performed. Although self-reported diabetes is known to be reliable and highly specific15, laboratory measures need to be replicated in the clinical setting to confirm a diagnosis. Finally, as with all observational analyses, we cannot rule out the possibility of residual confounding, especially given that hypertension was highly prevalent in our cohort (80%), and adjusting for this risk factor may not have been sufficient.
We show in a large cohort of elderly men and women free of heart disease that although most echocardiographic measures of cardiac structure and function are in the range of normal values, dysglycemia is associated with higher LV mass, worse diastolic function and worse left ventricular systolic function. These associations appear to be independent of race and sex, and remain statistically significant after multivariable adjustments but with admittedly an unknown clinical significance. Further analyses investigating whether these relationships are predictive of worse prognosis need to be performed to test whether these findings represent a potential mechanism that underlies the exceedingly high risk of heart failure and death among subjects with dysglycemia.
Supplementary Material
Acknowledgments
The authors thank the staff and participants of the ARIC study for their important contributions.
Hicham Skali and Scott Solomon had full access to all of the data in the study and take responsibility for the integrity of the data and the accuracy of the data analysis.
Sources of Funding
The Atherosclerosis Risk in Communities Study is carried out as a collaborative study supported by National Heart, Lung, and Blood Institute contracts (HHSN268201100005C, HHSN268201100006C, HHSN268201100007C, HHSN268201100008C, HHSN268201100009C, HHSN268201100010C, HHSN268201100011C, and HHSN268201100012C). This work was also supported by National Heart, Lung, and Blood Institute cooperative agreement NHLBI-HC-11-08 (Brigham and Women's Hospital), grants R00-HL-107642 (SC), K08-HL-116792 (AMS), 5T32HL007374-34 (NB); and a grant from the Ellison Foundation (SC).
Footnotes
Disclosures
None.
References
- 1.Kannel WB, Hjortland M, Castelli WP. Role of diabetes in congestive heart failure: the Framingham study. Am J Cardiol. 1974;34:29–34. doi: 10.1016/0002-9149(74)90089-7. [DOI] [PubMed] [Google Scholar]
- 2.Kannel WB, McGee DL. Diabetes and glucose tolerance as risk factors for cardiovascular disease: the Framingham study. Diabetes Care. 1979;2:120–126. doi: 10.2337/diacare.2.2.120. [DOI] [PubMed] [Google Scholar]
- 3.Murcia AM, Hennekens CH, Lamas GA, Jiménez-Navarro M, Rouleau JL, Flaker GC, Goldman S, Skali H, Braunwald E, Pfeffer MA. Impact of diabetes on mortality in patients with myocardial infarction and left ventricular dysfunction. Arch Intern Med. 2004;164:2273–2279. doi: 10.1001/archinte.164.20.2273. [DOI] [PubMed] [Google Scholar]
- 4.MacDonald MR, Petrie MC, Varyani F, Ostergren J, Michelson EL, Young JB, Solomon SD, Granger CB, Swedberg KB, Yusuf S, Pfeffer MA, McMurray JJV, CHARM Investigators Impact of diabetes on outcomes in patients with low and preserved ejection fraction heart failure: an analysis of the Candesartan in Heart failure: Assessment of Reduction in Mortality and morbidity (CHARM) programme. Eur Heart J. 2008;29:1377–1385. doi: 10.1093/eurheartj/ehn153. [DOI] [PubMed] [Google Scholar]
- 5.Aguilar D, Solomon SD, Køber L, Rouleau JL, Skali H, McMurray JJV, Francis GS, Henis M, O'Connor CM, Diaz R, Belenkov YN, Varshavsky S, Leimberger JD, Velazquez EJ, Califf RM, Pfeffer MA. Newly diagnosed and previously known diabetes mellitus and 1-year outcomes of acute myocardial infarction: the VALsartan In Acute myocardial iNfarcTion (VALIANT) trial. Circulation. 2004;110:1572–1578. doi: 10.1161/01.CIR.0000142047.28024.F2. [DOI] [PubMed] [Google Scholar]
- 6.Hunt SA, Abraham WT, Chin MH, Feldman AM, Francis GS, Ganiats TG, Jessup M, Konstam MA, Mancini DM, Michl K, Oates JA, Rahko PS, Silver MA, Stevenson LW, Yancy CW. 2009 focused update incorporated into the ACC/AHA 2005 Guidelines for the Diagnosis and Management of Heart Failure in Adults: a report of the American College of Cardiology Foundation/American Heart Association Task Force on Practice Guidelines: developed in collaboration with the International Society for Heart and Lung Transplantation. Circulation. 2009;119:e391–479. doi: 10.1161/CIRCULATIONAHA.109.192065. [DOI] [PubMed] [Google Scholar]
- 7.Fein FS, Sonnenblick EH. Diabetic cardiomyopathy. Progress in Cardiovascular Diseases. 1985;27:255–270. doi: 10.1016/0033-0620(85)90009-x. [DOI] [PubMed] [Google Scholar]
- 8.Pappachan JM, Varughese GI, Sriraman R, Arunagirinathan G. Diabetic cardiomyopathy: Pathophysiology, diagnostic evaluation and management. World J Diabetes. 2013;4:177–189. doi: 10.4239/wjd.v4.i5.177. [DOI] [PMC free article] [PubMed] [Google Scholar]
- 9.Rubler S, Dlugash J, Yuceoglu YZ, Kumral T, Branwood AW, Grishman A. New type of cardiomyopathy associated with diabetic glomerulosclerosis. Am J Cardiol. 1972;30:595–602. doi: 10.1016/0002-9149(72)90595-4. [DOI] [PubMed] [Google Scholar]
- 10.Devereux RB, Roman MJ, Paranicas M, O'Grady MJ, Lee ET, Welty TK, Fabsitz RR, Robbins D, Rhoades ER, Howard BV. Impact of diabetes on cardiac structure and function: the strong heart study. Circulation. 2000;101:2271–2276. doi: 10.1161/01.cir.101.19.2271. [DOI] [PubMed] [Google Scholar]
- 11.Galderisi M, Anderson KM, Wilson PW, Levy D. Echocardiographic evidence for the existence of a distinct diabetic cardiomyopathy (the Framingham Heart Study). Am J Cardiol. 1991;68:85–89. doi: 10.1016/0002-9149(91)90716-x. [DOI] [PubMed] [Google Scholar]
- 12.Lee M, Gardin JM, Lynch JC, Smith VE, Tracy RP, Savage PJ, Szklo M, Ward BJ. Diabetes mellitus and echocardiographic left ventricular function in free-living elderly men and women: The Cardiovascular Health Study. Am Heart J. 1997;133:36–43. doi: 10.1016/s0002-8703(97)70245-x. [DOI] [PubMed] [Google Scholar]
- 13.The Atherosclerosis Risk in Communities (ARIC) Study: design and objectives. The ARIC investigators Am J Epidemiol. 1989;129:687–702. [PubMed] [Google Scholar]
- 14.Shah AM, Cheng S, Skali H, Wu J, Mangion JR, Kitzman D, Matsushita K, Konety S, Butler KR, Fox ER, Cook N, Ni H, Coresh J, Mosley TH, Heiss G, Folsom AR, Solomon SD. Rationale and design of a multicenter echocardiographic study to assess the relationship between cardiac structure and function and heart failure risk in a biracial cohort of community-dwelling elderly persons: the atherosclerosis risk in communities study. Circ Cardiovasc Imaging. 2014;7:173–181. doi: 10.1161/CIRCIMAGING.113.000736. [DOI] [PMC free article] [PubMed] [Google Scholar]
- 15.Schneider ALC, Pankow JS, Heiss G, Selvin E. Validity and reliability of self-reported diabetes in the atherosclerosis risk in communities study. Am J Epidemiol. 2012;176:738–743. doi: 10.1093/aje/kws156. [DOI] [PMC free article] [PubMed] [Google Scholar]
- 16.American Diabetes Association Standards of medical care in diabetes--2014. Diabetes Care. 2014;37(Suppl 1):S14–80. doi: 10.2337/dc14-S014. [DOI] [PubMed] [Google Scholar]
- 17.Cuzick J. A Wilcoxon-type test for trend. Stat Med. 1985;4:87–90. doi: 10.1002/sim.4780040112. [DOI] [PubMed] [Google Scholar]
- 18.Harrell FE. Regression Modeling Strategies: With Applications to Linear Models, Logistic Regression, and Survival Analysis. Springer; 2001. [Google Scholar]
- 19.Levy D, Garrison RJ, Savage DD, Kannel WB, Castelli WP. Prognostic implications of echocardiographically determined left ventricular mass in the Framingham Heart Study. N Engl J Med. 1990;322:1561–1566. doi: 10.1056/NEJM199005313222203. [DOI] [PubMed] [Google Scholar]
- 20.Liao Y, Cooper RS, McGee DL, Mensah GA, Ghali JK. The relative effects of left ventricular hypertrophy, coronary artery disease, and ventricular dysfunction on survival among black adults. JAMA. 1995;273:1592–1597. [PubMed] [Google Scholar]
- 21.Ho JE, Lyass A, Lee DS, Vasan RS, Kannel WB, Larson MG, Levy D. Predictors of new- onset heart failure: differences in preserved versus reduced ejection fraction. Circ Heart Fail. 2013;6:279–286. doi: 10.1161/CIRCHEARTFAILURE.112.972828. [DOI] [PMC free article] [PubMed] [Google Scholar]
- 22.Rutter MK, Parise H, Benjamin EJ, Levy D, Larson MG, Meigs JB, Nesto RW, Wilson PWF, Vasan RS. Impact of glucose intolerance and insulin resistance on cardiac structure and function: sex-related differences in the Framingham Heart Study. Circulation. 2003;107:448–454. doi: 10.1161/01.cir.0000045671.62860.98. [DOI] [PubMed] [Google Scholar]
- 23.Bertoni AG, Goff DC, D'Agostino RB, Liu K, Hundley WG, Lima JA, Polak JF, Saad MF, Szklo M, Tracy RP, Siscovick DS. Diabetic cardiomyopathy and subclinical cardiovascular disease: the Multi-Ethnic Study of Atherosclerosis (MESA). Diabetes Care. 2006;29:588–594. doi: 10.2337/diacare.29.03.06.dc05-1501. [DOI] [PubMed] [Google Scholar]
- 24.Seferović PM, Milinković I, Ristić AD, Seferović Mitrović JP, Lalić K, Jotić A, Kanjuh V, Lalić N, Maisch B. Diabetic cardiomyopathy: ongoing controversies in 2012. Herz. 2012;37:880–886. doi: 10.1007/s00059-012-3720-z. [DOI] [PubMed] [Google Scholar]
- 25.Boudina S, Abel ED. Diabetic cardiomyopathy, causes and effects. Rev Endocr Metab Disord. 2010;11:31–39. doi: 10.1007/s11154-010-9131-7. [DOI] [PMC free article] [PubMed] [Google Scholar]
- 26.Aronow WS. Diabetic Cardiomyopathy in the Elderly. Curr Cardiovasc Risk Rep. 2013;7:490–494. [Google Scholar]
- 27.Galderisi M. Diastolic Dysfunction and Diabetic Cardiomyopathy. J Am Coll Cardiol. 2006;48:1548–1551. doi: 10.1016/j.jacc.2006.07.033. [DOI] [PubMed] [Google Scholar]
- 28.Dinh W, Lankisch M, Nickl W, Scheyer D, Scheffold T, Kramer F, Krahn T, Klein RM, Barroso MC, Füth R. Insulin resistance and glycemic abnormalities are associated with deterioration of left ventricular diastolic function: a cross-sectional study. Cardiovasc Diabetol. 2010;9:63. doi: 10.1186/1475-2840-9-63. [DOI] [PMC free article] [PubMed] [Google Scholar]
- 29.Zabalgoitia M, Ismaeil MF, Anderson L, Maklady FA. Prevalence of diastolic dysfunction in normotensive, asymptomatic patients with well-controlled type 2 diabetes mellitus. Am J Cardiol. 2001;87:320–323. doi: 10.1016/s0002-9149(00)01366-7. [DOI] [PubMed] [Google Scholar]
- 30.Boyer JK, Thanigaraj S, Schechtman KB, Pérez JE. Prevalence of ventricular diastolic dysfunction in asymptomatic, normotensive patients with diabetes mellitus. Am J Cardiol. 2004;93:870–875. doi: 10.1016/j.amjcard.2003.12.026. [DOI] [PubMed] [Google Scholar]
- 31.Liu JE, Palmieri V, Roman MJ, Bella JN, Fabsitz R, Howard BV, Welty TK, Lee ET, Devereux RB. The impact of diabetes on left ventricular filling pattern in normotensive and hypertensive adults: the Strong Heart Study. J Am Coll Cardiol. 2001;37:1943–1949. doi: 10.1016/s0735-1097(01)01230-x. [DOI] [PubMed] [Google Scholar]
- 32.Nagueh SF, Appleton CP, Gillebert TC, Marino PN, Oh JK, Smiseth OA, Waggoner AD, Flachskampf FA, Pellikka PA, Evangelista A. Recommendations for the evaluation of left ventricular diastolic function by echocardiography. J Am Soc Echocardiogr. 2009;22:107–133. doi: 10.1016/j.echo.2008.11.023. [DOI] [PubMed] [Google Scholar]
- 33.Solomon SD, St John Sutton M, Lamas GA, Plappert T, Rouleau JL, Skali H, Moye L, Braunwald E, Pfeffer MA. Survival and Ventricular Enlargement SAVE Investigators. Ventricular remodeling does not accompany the development of heart failure in diabetic patients after myocardial infarction. Circulation. 2002;106:1251–1255. doi: 10.1161/01.cir.0000032313.82552.e3. [DOI] [PubMed] [Google Scholar]
- 34.Velagaleti RS, Gona P, Chuang ML, Salton CJ, Fox CS, Blease SJ, Yeon SB, Manning WJ, O'Donnell CJ. Relations of insulin resistance and glycemic abnormalities to cardiovascular magnetic resonance measures of cardiac structure and function: the Framingham Heart Study. Circ Cardiovasc Imaging. 2010;3:257–263. doi: 10.1161/CIRCIMAGING.109.911438. [DOI] [PMC free article] [PubMed] [Google Scholar]
- 35.Chandra S, Skali H, Blankstein R. Novel techniques for assessment of left ventricular systolic function. Heart Fail Rev. 2011;16:327–337. doi: 10.1007/s10741-010-9219-x. [DOI] [PubMed] [Google Scholar]
- 36.Shah AM, Solomon SD. Myocardial deformation imaging: current status and future directions. Circulation. 2012;125:e244–8. doi: 10.1161/CIRCULATIONAHA.111.086348. [DOI] [PubMed] [Google Scholar]
- 37.Fang ZY, Yuda S, Anderson V, Short L, Case C, Marwick TH. Echocardiographic detection of early diabetic myocardial disease. J Am Coll Cardiol. 2003;41:611–617. doi: 10.1016/s0735-1097(02)02869-3. [DOI] [PubMed] [Google Scholar]
- 38.Ng ACT, Delgado V, Bertini M, van der Meer RW, Rijzewijk LJ, Shanks M, Nucifora G, Smit JWA, Diamant M, Romijn JA, de Roos A, Leung DY, Lamb HJ, Bax JJ. Findings from Left Ventricular Strain and Strain Rate Imaging in Asymptomatic Patients With Type 2 Diabetes Mellitus. Am J Cardiol. 2009;104:1398–1401. doi: 10.1016/j.amjcard.2009.06.063. [DOI] [PubMed] [Google Scholar]
- 39.Ernande L, Rietzschel ER, Bergerot C, De Buyzere ML, Schnell F, Groisne L, Ovize M, Croisille P, Moulin P, Gillebert TC, Derumeaux G. Impaired Myocardial Radial Function in Asymptomatic Patients with Type 2 Diabetes Mellitus: A Speckle-Tracking Imaging Study. Journal of the American Society of Echocardiography. 2010;23:1266–1272. doi: 10.1016/j.echo.2010.09.007. [DOI] [PubMed] [Google Scholar]
- 40.Nakai H, Nakai H, Takeuchi M, Takeuchi M, Nishikage T, Nishikage T, Lang RM, Lang RM, Otsuji Y, Otsuji Y. Subclinical left ventricular dysfunction in asymptomatic diabetic patients assessed by two-dimensional speckle tracking echocardiography: correlation with diabetic duration. Eur J Echocardiogr. 2009;10:926–932. doi: 10.1093/ejechocard/jep097. [DOI] [PubMed] [Google Scholar]
- 41.Kosmala W, Kosmala W, Colonna P, Colonna P, Przewlocka-Kosmala M, Przewlocka- Kosmala M, Mazurek W, Mazurek W. Right Ventricular Dysfunction in Asymptomatic Diabetic Patients. Diabetes Care. 2004;27:2736–2738. doi: 10.2337/diacare.27.11.2736. [DOI] [PubMed] [Google Scholar]
- 42.Kosmala W, Kosmala W, Kosmala W, Przewlocka-Kosmala M, Przewlocka-Kosmala M, Przewlocka-Kosmala M, Mazurek W, Mazurek W, Mazurek W. Subclinical right ventricular dysfunction in diabetes mellitus--an ultrasonic strain/strain rate study. Diabetic Medicine. 2007;24:656–663. doi: 10.1111/j.1464-5491.2007.02101.x. [DOI] [PubMed] [Google Scholar]
- 43.Widya RL, van der Meer RW, Smit JWA, Rijzewijk LJ, Diamant M, Bax JJ, de Roos A, Lamb HJ. Right ventricular involvement in diabetic cardiomyopathy. Diabetes Care. 2013;36:457–462. doi: 10.2337/dc12-0474. [DOI] [PMC free article] [PubMed] [Google Scholar]
- 44.Anavekar NS, Gerson D, Skali H, Kwong RY, Yucel EK, Solomon SD. Two-dimensional assessment of right ventricular function: an echocardiographic-MRI correlative study. Echocardiography. 2007;24:452–456. doi: 10.1111/j.1540-8175.2007.00424.x. [DOI] [PubMed] [Google Scholar]
- 45.Haddad F, Doyle R, Murphy DJ, Hunt SA. Right ventricular function in cardiovascular disease, part II: pathophysiology, clinical importance, and management of right ventricular failure. Circulation. 2008;117:1717–1731. doi: 10.1161/CIRCULATIONAHA.107.653584. [DOI] [PubMed] [Google Scholar]
- 46.Zornoff LAM, Skali H, Pfeffer MA, St John Sutton M, Rouleau JL, Lamas GA, Plappert T, Rouleau JR, Moyé LA, Lewis SJ, Braunwald E, Solomon SD. SAVE Investigators. Right ventricular dysfunction and risk of heart failure and mortality after myocardial infarction. J Am Coll Cardiol. 2002;39:1450–1455. doi: 10.1016/s0735-1097(02)01804-1. [DOI] [PubMed] [Google Scholar]
- 47.Selvin E, Parrinello CM, Sacks DB, Coresh J. Trends in Prevalence and Control of Diabetes in the United States, 1988–1994 and 1999–2010. Ann Int Med. 2014;160:517. doi: 10.7326/M13-2411. [DOI] [PMC free article] [PubMed] [Google Scholar]
Associated Data
This section collects any data citations, data availability statements, or supplementary materials included in this article.