

Abstract
Objective
Vascular optical tomographic imaging (VOTI) is a novel imaging modality that is capable of detecting hemoglobin concentrations in tissue. VOTI is non-invasive, non-ionizing and does not require contrast injection. We applied this technology to diagnosing peripheral arterial disease (PAD) within lower extremities of diabetic patients with calcified arteries. This could be of substantial benefit as these patients suffer from comorbidities such as arterial incompressibility, which complicates diagnosis and monitoring.
Methods
Forty subjects (10 non-diabetic patients with PAD, 10 diabetic patients with PAD, and 20 healthy volunteers) were enrolled in a diagnostic pilot study using the VOTI system. The patients were imaged during a thigh pressure cuff occlusion.
Results
The VOTI system was capable of quantifying the blood volume changes within the foot during the thigh cuff occlusion and outputting diagnostic parameters, such as change in hemoglobin concentration, enabling the assessment of foot perfusion. This study resulted in a statistically significant difference between the healthy cohort and both the non-diabetic and the diabetic PAD cohorts (P=0.006, P=0.006). Receiver operating characteristic (ROC) curve analysis showed that PAD diagnosis could be made with over 80% sensitivity or specificity depending on the characteristic cut-off point. In addition, VOTI was capable of providing the locations of under-perfused regions within the foot and evaluating the severity of arterial disease, even within diabetic patients with calcified arteries, which are traditionally difficult to diagnose.
Conclusion
VOTI can effectively diagnose PAD independently of arterial compressibility, making it very useful for assessing vascular disease in diabetic patients.
Keywords: peripheral arterial disease, perfusion imaging, diffuse optical tomography
1. INTRODUCTION
PAD affects 8–12 million people in the United States. When linked with diabetes, PAD results in over 71,000 amputations annually. Currently 85% of lower leg amputations occur within diabetic patients. Lower extremity angioplasty or bypass surgery is performed in advanced stages when limb-threatening ischemia occurs. Accurate and timely diagnosis of PAD is crucial in preventing further health consequences.1–6
In patients with compressible vessels, detection of PAD is accomplished through calculating the ankle-brachial index (ABI). However, in patients with diabetes and renal insufficiency, ABI measurements may be falsely elevated due to arterial calcification. In such cases, pulse-volume recording (PVR) waveforms offer some help, but are unreliable in cases of low flow states and edema.1–9 Toe-brachial index (TBI) are sometimes considered in patients with calcified vessels. But a recent review of the TBI concluded that the diagnostic criteria remain ambiguous.8
Additional non-invasive imaging methods include duplex ultrasound (DUS) and computed tomography angiography (CTA). However, it can be difficult to identify lesions below the knee with DUS because of the relatively small size of the arteries, which makes this method increasingly operator dependent as it is applied more distally. If this examination is inconclusive (DUS fails to visualize up to 15% of arterial segments in the calf), CTA is employed to provide further details on the location and extent of the occlusion in the leg.9 However, CTA requires nephrotoxic contrast agents, which are not suitable for diabetic and renal disease patients.7–9
Furthermore, all these methods are indirect measurements of distal perfusion; yet it is the lack of distal perfusion in the foot that leads to ischemic ulcers and amputations. Therefore, a direct measure of foot perfusion is highly desirable. Vascular optical tomographic imaging (VOTI) has the potential to provide this measure and aid in PAD assessment.7–9
Our VOTI system uses red and near infrared (NIR) light (650<λ<900nm), similar to a pulse oximeter. The light is used to illuminate the foot at various points. The transmitted light is used to create cross-sectional images of hemoglobin concentration in the foot. These hemoglobin spatial maps can be derived, non-invasively, without contrast agents or ionizing radiation. NIR light has no adverse health effects allowing for frequent measurements in patient monitoring. VOTI penetrates deeper than laser Doppler providing better information about perfusion at the cost of lower spatial resolutions. Furthermore, this technology is independent of arterial calcification making it ideal for diagnosing diabetic PAD patients.10–23
Our group previously published results of a 3-subject case study using the VOTI system.19 A healthy volunteer, a PAD patient and a patient with PAD and diabetes were imaged during a thigh cuff occlusion. The subjects reacted differently to the cuff occlusion with respect to the amount and rate at which the blood pooled in the foot. VOTI effectively diagnosed PAD within a diabetic patient with calcified arteries, which is problematic with current diagnostic methods. In this paper, results from a 40-subject (20 healthy subjects, 10 non-diabetic PAD patients, 10 patients with PAD and diabetes) pilot study are presented to quantify VOTI’s sensitivity and specificity at detecting PAD, its ability to assess the severity of the disease and localize the perfusion response in the foot.
2. METHODS
Study Population
Forty subjects were recruited for this IRB approved diagnostic pilot study in the Division of Vascular Surgery at New York Presbyterian Hospital - Columbia University. The patients were placed into three cohorts: healthy subjects (N=20), PAD patients without diabetes (N=10) and PAD patients with diabetes (N=10). The physicians assigned the patients in one of the three cohorts based on a combination of the patients’ ABI readings, segmental ultrasound waveforms, physical symptoms and medical history.
The patients recruited were 75% male and 25% female, with a mean age of 67.5 ± 11.5 years. Of the patients recruited 10% were current smokers, and 20% had been smokers in the past. The ethnic make up was 55% Hispanic, 25% Non-Hispanic White, 10% African American, and 10% Asian American. Of the healthy subjects recruited none were smokers or had smoked habitually in the past. The healthy subjects were 80% male and 20% female, with a mean age of 35.6 ± 10.0 years. The ethnic make up was 5% Hispanic, 60% Non-Hispanic White, 5% African American, and 30% Asian American.
This pilot study attempts to differentiate between healthy and affected vasculature. Since aging reduces vasoreactivity, it is difficult to match the ages of the healthy and affected cohorts in a pilot study of this size. Furthermore, a large part of the data analysis compares the patients’ VOTI readings with their respective ABI/PVR readings, in which age is not a factor. This analysis was only completed on the affected cohorts to see how the VOTI readings correlate with current techniques.
Vascular Optical Tomography Imaging System
The subjects were imaged using a VOTI system.20 The system uses two NIR wavelengths (λ1=760 and λ2=830 nm) to illuminate the tissue with a frame rate of approximately 6 Hz. Fast hardware instrumentation enables the measuring of blood volume dynamics within the cross section of tissue, which allows us to image hemodynamics during a pressure cuff application. A total of 34 fibers encompassed the foot, forming a coronal cross-section at the mid-metatarsal level. These fibers shine light through the foot and capture the back-reflected and transmitted light (Fig. 1). The imaging takes ~10 minutes to set up and ~5 minutes to acquire the images.
Fig. 1.

VOTI system with its sandal shaped measuring probe provide cross-sectional images of hemoglobin concentrations in the foot.
The detected light intensities were inputted into an image reconstruction algorithm21 to create spatial maps of hemoglobin within the cross-section of the foot. If perfusion is low there is less hemoglobin in the foot. Hemoglobin is the major absorber of light in tissue, the higher its concentration the weaker the detected intensities. The mid-metatarsal level was chosen to assess the vessels (i.e. dorsalis pedis, plantar arteries) that supply the forefoot, which is the most common location for diabetic foot ulcers.
Imaging Protocol
A five-stage dynamics imaging protocol was employed to image the subjects. The subjects were seated upright in a chair and asked to place their foot inside the measuring probe (Fig. 1). To illicit a controlled vascular response a pressure cuff was applied to the thigh. The protocol consisted of (1) rest phase, (2) 60mmHg thigh cuff occlusion phase, (3) release and recovery phase, (4) 120mmHg thigh cuff occlusion phase, and (5) release and recovery phase. Initially, the patient was imaged at rest for one minute. Then in the second phase, a pressure cuff was inflated to 60mmHg to induce venous occlusion for one minute. The thigh cuff prevented the blood from leaving the leg through the veins, while arteries continued to supply blood to the foot. This pressure caused the blood to pool in the leg, which absorbed the light as it propagated through the foot, decreasing the intensity of the detected signal. In the third phase, the pressure is released allowing for one minute of recovery time. In the fourth phase, the thigh cuff is reapplied at 120mmHg for a one minute, inducing a greater venous occlusion. Finally, the cuff was released and the patient was imaged for one minute. This protocol was selected because it focuses on arterial flow, while avoiding the arterial compression required by blood pressure based measurements.
Feature Extraction
To derive quantitative parameters for diagnosis, we extracted regions of interest (ROI) from within the VOTI images.19 Certain pixel intensities correlated with the application of the pressure cuff around the thigh. These correlating pixels clustered together suggesting that they may correspond with vascular anatomy. We extracted the changes in the hemoglobin concentrations over time directly from these ROI. The peak of these hemoglobin time traces during the 60mmHg pressure cuff occlusion (amount of blood pooling before cuff release) was used to diagnose PAD.
Statistical Methods
The features extracted from the images were analyzed relative to a baseline (percent changes). The data is in the form of mean and standard deviations unless otherwise stated. The subjects were stratified into healthy and affected vasculature cohorts. The affected vasculature cohorts were further stratified into non-diabetic and diabetic PAD patients to determine the effect of diabetic co-morbidities. To quantify VOTI’s diagnostic ability, comparisons between groups were made using a one-way analysis of variance (ANOVA). However, ANOVA only tests the global hypothesis that all the samples were drawn from a single population. To identify the cohorts with statistically significant differences, we applied a multiple-comparison procedure called the Holm t-test. For a 95% confidence interval, and three cohorts we obtain α1 = 0.0167, α2 = 0.025, α3 = 0.05 as our significance cutoff. In addition, receiver operating characteristic (ROC) curves were created to calculate the sensitivity and specificity of the VOTI system.
To identify VOTI’s ability to assess the severity of PAD, the data was analyzed using boxplots. The boxplots provide a graphical representation of the minimum and maximum values and the quartiles of the data. This allows us to visualize the range, shape and skewness of the data. VOTI’s diagnostic features were compared to patients’ ABI values and PVR readings.
3. RESULTS
ABI Measurements
ABI readings were collected for the patients enrolled in the study. The PAD patient cohort had an average ABI of 0.64 ± 0.21 indicating moderate disease, while the diabetic PAD cohort had an average ABI of 0.95 ± 0.35, which would be misinterpreted as healthy vasculature. A statistical significance (P=0.05) is observed between the ABI readings despite both cohorts being diagnosed with PAD by the physician. This is due to arterial calcifications, which render the arteries of incompressible and falsely elevate the ABI readings.
Spatial Maps of Total Hemoglobin Change
Fig. 2 shows five representative frames during the thigh cuff stimulus for each of the cohorts. The blood begins to pool in the foot as the pressure is maintained around the thigh then leaves the foot upon release. The healthy subject exhibits more blood pooling in reaction to the thigh cuff occlusion.
Fig. 2.
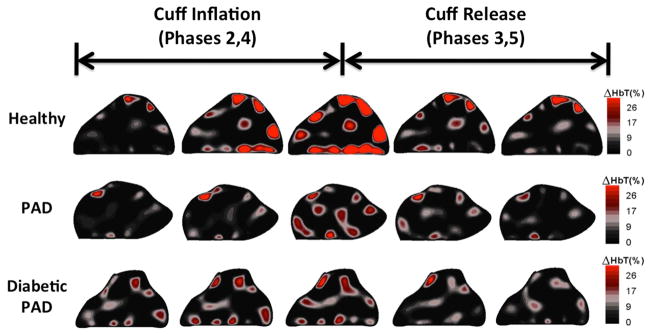
This figure shows coronal cross-sectional images from a healthy subject, PAD patient and diabetic PAD patient. The five frames shown outline the hemodynamics during the thigh cuff occlusion and release. The healthy volunteer has a greater amount of blood pooling in the leg during the occlusion as well as a faster reaction to the application and release of the thigh cuff.
Hemoglobin Time Trace
Total Hemoglobin (HbT) time traces were extracted from the ROI within the foot. The hemoglobin time traces for each of the three cohorts were then averaged together to obtain a representative signal for each cohort (Fig. 3). The standard error bars for the healthy cohort do not overlap with those of the patient cohorts. The hemoglobin change before release of the 60mmHg occlusion for the healthy subjects is almost double that of the patient cohorts (~10% vs. 5%), showing the greatest discrepancy between the cohorts. Furthermore, the hemoglobin time traces for the PAD and the diabetic PAD cohorts are very similar unlike their ABI readings.
Fig. 3.
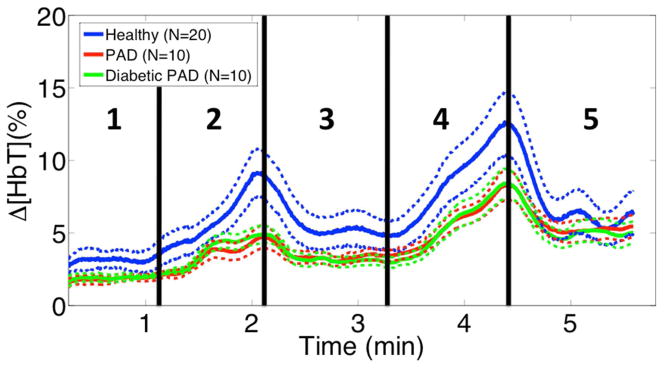
This figure shows the cohort average signals with their standard error bars. The healthy cohort average’s error bars rarely overlap with those of the PAD cohorts. Furthermore the biggest discrepancy occurs before release of the 60mmHg occlusion. There is little difference between the PAD and diabetic PAD cohorts, suggesting that VOTI is unaffected by arterial compressibility.
Diagnosis using the 60mmHg Occlusion Peak
We extracted the 60mmHg occlusion peak and created boxplots for each cohort (Fig 4). The boxplots show the median of the healthy subjects is almost double that of the PAD and diabetic PAD subjects (7.5%, 3.8%, 4.5% respectively). The largest change within the healthy cohort is 18.27%, while the PAD cohorts have a maximum of less than 9% change. The range of the healthy cohort is greater than the PAD and diabetic PAD cohorts (14.0%, 7.5%, 6.1%).
Fig. 4.

These boxplots show the distribution of Δ[HbT] at the end of the 60mmHg occlusion for each cohort. The healthy cohort has a greater minimum, maximum and quartiles than the affected cohorts, signifying more pooling in the leg. The healthy cohort has a larger range, which may be due to lifestyle choices or asymptotic circulatory problems. Also note, the affected cohorts have similar distributions despite arterial calcifications.
The healthy cohort had a mean of 9.84 ± 5.44 (%), the PAD cohort had a mean of 4.41 ± 2.02 (%) and the diabetic PAD cohort had a mean of 4.78 ± 1.93 (%). Applying a one-way ANOVA a between-group P-value of 0.003 was obtained. Using the Holm t-test, the healthy cohort showed a statistical significance from both PAD cohorts while the PAD and diabetic PAD cohorts were not different from each other (P=0.006, P=0.006, P=0.34).
A receiver operating characteristic (ROC) curve was derived using the 60mmHg peak for diagnosis (Fig. 5). This is a good classifier for PAD with an area under the ROC curve (AUC) of 0.81. Designating Δ[HbT] < 6.1% as afflicted, we achieve a Sensitivity (Se) of 0.85 and Specificity (Sp) of 0.73. The positive predictive value (PPV) is 0.81 and the accuracy of the test equals 0.80. If higher specificities are desired, the cutoff can be lowered to 5.0%, achieving a Sp of 0.87 and Se of 0.70. The PPV is 0.88 and the accuracy of the test equals 0.77.
Fig. 5.

This figure shows a ROC curve created using the Δ[HbT] before release of the 60mmHg thigh cuff occlusion. This is a good classifier with an AUC=0.81. Designating Δ[HbT] < 6.1% as afflicted, we achieve a Sensitivity of 85% and Specificity of 73%.
Severity Analysis using 60mmHg peak
To quantify VOTI’s ability to assess PAD severity, the subjects’ 60mmHg peak values were plotted against their respective ABI measurements (Fig. 6). For the non-diabetic PAD subjects, a linear trend is observed between the two parameters with an R2 = 0.84 (Fig. 6A). For the diabetic PAD cohort there is no linear relationship observed with an R2 = 0.11 (Fig. 6B). This is consistent with the discrepancies found in the PAD and diabetic PAD patients’ ABI values.
Fig. 6.
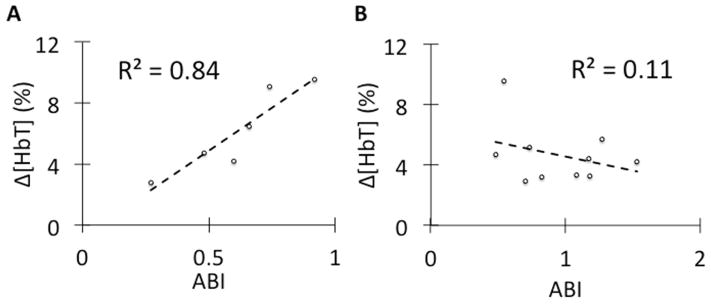
(A) This figure shows a linear relationship between the Δ[HbT] during the 60mmHg thigh cuff occlusion and the non-diabetic PAD patients’ ABI readings. This suggests that VOTI can differentiate the severity of PAD similar to the ABI measurement. (B) In diabetic PAD patients there is no relationship between ABI measurement and Δ[HbT] within diabetic PAD patients due to arterial calcification falsely elevating the ABI readings.
We compared the VOTI 60mmHg peaks with the subjects’ respective foot PVR waveforms. The technicians classified the waveforms as mild, moderate or severely diminished. Within our affected patient cohorts there were six mildly, six moderately and eight severely diminished waveforms. The healthy subjects had a mean Δ[HbT] of 9.84 ± 5.44 (%), the mildly diminished group had a mean of 5.98 ± 1.96 (%), the moderately diminished group had a mean of 4.10 ± 1.01 (%), and the severely diminished group had a mean of 3.06 ± 0.97 (%). Each of the three severity levels was significantly different from the healthy subjects (P=0.04, P=0.003, P=0.0007).
Angiosome Analysis
Angiosome theory is a topic of great interest in vascular surgery24–26. Three angiosomes are captured within the mid-metatarsal, coronal cross-section: the dorsalis pedis angiosome (DPA), the medial plantar angiosome (MPA), and the lateral plantar angiosome (LPA). Fig. 7 shows three subjects imaged using the VOTI system. In the healthy case, the calculated signals were fairly consistent within the three angiosomes, both in magnitude, as well as shape (Fig. 7A). For the subjects with affected vasculature, there were often different responses within the angiosomes (Fig. 7B), or they had diminished signals throughout their entire foot (Fig. 7C).
Fig. 7.

This figure shows the signals derived from the pixels with Δ[HbT] > 10% in each angiosome. This analysis is shown for an A) healthy, B) PAD and C) diabetic PAD subject. In the healthy subject the angiosomes behave similarly. In the PAD subject the MPA has better perfusion than the other angiosomes of the foot. In the Diabetic PAD subject, all signals are diminished suggesting a more proximal occlusion. Angiosome analysis could help physicians plan patient treatment.
4. DISCUSSION
VOTI is a non-invasive, non-ionizing, contrast-free imaging modality that uses harmless red and near-infrared light to measure changes in hemoglobin concentrations in tissue. This technology has been applied to image PAD in the foot. VOTI shows a statistically significant difference between the hemoglobin changes in healthy and affected vasculature in the foot. There is more blood pooling resulting in high Δ[HbT] in the foot during a one-minute 60mmHg venous occlusion in healthy subjects than in the PAD and the diabetic PAD cohort (P=0.006, P=0.006). For large vessel disease, the plaque build-up increases the resistance and reduces compliance of the vessels. This leads to a reduction in the blood pooling into the foot, resulting in lower Δ[HbT]. In small-vessel disease, the same effect can be caused by arterial stenosis. This analysis was also completed for 120mmHg occlusion, which was not as effective. We suspect this is due to 120mmHg causing partial arterial occlusion in patients with lower blood pressure.
Diagnostic parameters can be extracted to form a decision boundary to diagnose PAD in the lower extremities. The maximum hemoglobin concentration from the 60mmHg thigh cuff occlusion was used to classify the disease. Assessing the distribution we found considerable differences in the boxplots, which showed greater Δ[HbT] in the healthy subjects. A greater range was observed for the healthy individuals which maybe be caused by lifestyle choices (e.g. diet, smoking) or other medical conditions.
Using ROC curve analysis we found the 60mmHg Δ[HbT] peak was a good classifier of PAD with an AUC of 0.81. Using a Δ[HbT] < 6.1% as the decision boundary, VOTI obtained a Se = 0.85 with Sp = 0.73. A lower cutoff Δ[HbT] < 5.0% yields a Sp = 0.87 but lowers Se to 0.70. Varying the cutoff Δ[HbT] enables the user to choose whether sensitivity or specificity is more important in their clinical decision making.
These results indicate that a physician can effectively diagnose patients with PAD independently of arterial calcifications using VOTI, despite the ABI measurements not being accurate. In addition, the parameters extracted from the VOTI images correlate fairly well (R2=0.84) with the ABI readings for the non-diabetic PAD patients. We also observed greater Δ[HbT] in the healthy subjects than subjects with mildly, moderately and severely diminished foot PVR waveforms (P=0.04, P=0.003, P=0.0007). The results showed greater Δ[HbT] in the mildly diminished than the subjects with moderately and severely diminished waveforms. This suggests that it is not only a decision boundary, but can identify the severity of the disease. In addition, VOTI’s ability to non-invasively provide localized physiological information can greatly aid in the assessment of neuro-ischemic ulcers in diabetic PAD patients and help with over/under-treatment of arterial disease. Angiosome analysis using the VOTI system may aid in treatment planning, where a physician can intervene to improve perfusion to the most compromised areas of the foot.27 There is currently no gold standard for assessing angiosome perfusion making statistical analysis difficult. Future studies involving animal models or angiographic foot analysis in patients with distal arterial disease may help to validate angiosome analysis using VOTI.
Unlike the traditional diagnostic modalities, VOTI provides a direct measurement of the perfusion in the entire foot, serving as an end-stage measure of the effects of the lesions or stenosis on the foot. This technology can be used to non-invasively diagnose and monitor patients with PAD independent of calcification, without needing to inject contrast into the patient’s blood stream. This study provides a basis for the calculations necessary in planning a larger multi-center trial. Future studies will involve greater enrollment and control of risk factors including smoking, age, hypertension, weight and demographics to understand their effects on the VOTI results.
What does this contribute?
We present the use of a novel medical imaging technology called Vascular Optical Tomographic Imaging (VOTI) to assess peripheral arterial disease (PAD) in the foot. VOTI can non-invasively image blood volume oxy- and deoxy-hemoglobin concentrations over time, without any contrast and is independent of arterial compressibility. This makes it ideal for diagnosing and monitoring diabetic patients, which are prone to arterial calcifications and are sensitive to the nephrotoxic contrast agents. This 40-patient pilot study is the first attempt at quantitatively assessing VOTI’s performance in diagnosing PAD.
Acknowledgments
This work has been funded by grants from the National Heart, Blood, and Lung Institute (NHLBI-1R01-HL115336-01), the Society of Vascular Surgery, and the Wallace H. Coulter Foundation. M. Khalil has been supported by the National Science Foundation Graduate Research Fellowship Program and an Integrative Graduate Education and Research Training grant (NSF-0801530).
Footnotes
Conflict of Interest: None
Publisher's Disclaimer: This is a PDF file of an unedited manuscript that has been accepted for publication. As a service to our customers we are providing this early version of the manuscript. The manuscript will undergo copyediting, typesetting, and review of the resulting proof before it is published in its final citable form. Please note that during the production process errors may be discovered which could affect the content, and all legal disclaimers that apply to the journal pertain.
Contributor Information
M A. Khalil, Email: mak2183@columbia.edu, Department of Biomedical Engineering, Columbia University, NY 10027 USA, 351 Engineering Terrace, 1210 Amsterdam Avenue, Mail Code: 8904, New York, NY 10027. Phone: 1 203-508-2036, Fax: 1 212-854-8725
H. K. Kim, Email: hkk2107@columbia.edu, Department of Radiology, Columbia University, NY 10027 USA
J. W. Hoi, Email: jwh2148@columbia.edu, Department of Biomedical Engineering, Columbia University, NY 10027 USA
I. Kim, Email: ink9006@nyp.org, Department of Surgery, NY Presbyterian Hospital-Columbia University, NY 10032 USA
Rajeev Dayal, Email: rajdayal@yahoo.com, NY Presbyterian Hospital-Columbia University, NY 10032 USA. He is now with the Department of Surgery, NY Hospital Queens, NY 11355 USA.
Gautam Shrikhande, Email: gs2459@columbia.edu, Department of Surgery, NY Presbyterian Hospital-Columbia University, NY 10032 USA.
A. H. Hielscher, Email: ahh2004@columbia.edu, Departments of Biomedical Engineering, Radiology, and Electrical Engineering, Columbia University, NY, 10027 USA
References
- 1.Norgren L, Hiatt WR, Dormandy JA, Nehler MR, Harris KA, Fowkes FGR. Inter-society consensus for the management of peripheral arterial disease (TASC II) Eur J Vasc Endovasc. 2007;33:S5–S75. doi: 10.1016/j.jvs.2006.12.037. [DOI] [PubMed] [Google Scholar]
- 2.Hiatt WR. Medical treatment of peripheral arterial disease and claudication. The New England journal of medicine. 2001;344(21):1608–1621. doi: 10.1056/NEJM200105243442108. [DOI] [PubMed] [Google Scholar]
- 3.Hirsch AT, Criqui MH, Treat-Jacobson D, Regensteiner JG, Creager MA, Olin JW, Krook SH, et al. Peripheral arterial disease detection, awareness, and treatment in primary care. JAMA : the journal of the American Medical Association. 2001;286(11):1317–1324. doi: 10.1001/jama.286.11.1317. [DOI] [PubMed] [Google Scholar]
- 4.Kullo IJ, Bailey KR, Kardia SL, Mosley TH, Boerwinkle E, Turner ST. Ethnic differences in peripheral arterial disease in the NHLBI Genetic Epidemiology Network of Arteriopathy (GENOA) study. Vasc Med. 2003;8 (4):237–242. doi: 10.1191/1358863x03vm511oa. [DOI] [PubMed] [Google Scholar]
- 5.Diehm C, Kareem S, Lawall H. Epidemiology of peripheral arterial disease. VASA Zeitschrift fur Gefasskrankheiten. 2004;33(4):183–189. doi: 10.1024/0301-1526.33.4.183. [DOI] [PubMed] [Google Scholar]
- 6.Garcia LA. Epidemiology and pathophysiology of lower extremity peripheral arterial disease. Journal of endovascular therapy. 2006;13(2):II3–9. doi: 10.1177/15266028060130S204. [DOI] [PubMed] [Google Scholar]
- 7.Krnic A, Vucic N, Sucic Z. Duplex scanning compared with intra-arterial angiography in diagnosing peripheral arterial disease: three analytical approaches. VASA Zeitschrift fur Gefasskrankheiten. 2006;35(2):86–91. doi: 10.1024/0301-1526.35.2.86. [DOI] [PubMed] [Google Scholar]
- 8.Høyer C, Sandermann J, Petersen LJ. The toe-brachial index in the diagnosis of peripheral arterial disease. J Vasc Surg. 2013;58(1):231–8. doi: 10.1016/j.jvs.2013.03.044. [DOI] [PubMed] [Google Scholar]
- 9.Al-Qaisi M, King DH, Kaddoura S, Hamady M. Imaging of peripheral vascular disease. Reports in Medical Imaging. 2009;2(1):25–34. [Google Scholar]
- 10.Casavola C, Paunescu LA, Fantini S, Gratton E. Blood flow and oxygen consumption with near-infrared spectroscopy and venous occlusion: spatial maps and the effect of time and pressure of inflation. J Biomed Opt. 2000;5(3):269–276. doi: 10.1117/1.429995. [DOI] [PubMed] [Google Scholar]
- 11.Kang Y, Lee J, Kwon K, Choi C. Application of novel dynamic optical imaging for evaluation of peripheral tissue perfusion. International journal of cardiology. 2010;145(3):99–101. doi: 10.1016/j.ijcard.2008.12.166. [DOI] [PubMed] [Google Scholar]
- 12.Perry D, Bharara M, Armstrong DG, Mills J. Intraoperative fluorescence vascular angiography: during tibial bypass. Journal of diabetes science and technology. 2012;6(1):204–208. doi: 10.1177/193229681200600125. [DOI] [PMC free article] [PubMed] [Google Scholar]
- 13.Flexman ML, Khalil MA, Al Abdi R, Kim HK, Fong CJ, Desperito E, Hershman DL, Barbour RL, Hielscher AH. Digital optical tomography system for dynamic breast imaging. J Biomed Opt. 2011;16(7):076014. doi: 10.1117/1.3599955. [DOI] [PMC free article] [PubMed] [Google Scholar]
- 14.Pogue BW, Patterson MS, Jiang H, Paulsen KD. Initial Assessment of a Simple System for Frequency-Domain Diffuse Optical Tomography. Physics in medicine and biology. 1995;40(10):1709–1729. doi: 10.1088/0031-9155/40/10/011. [DOI] [PubMed] [Google Scholar]
- 15.Pogue B, Testorf M, McBride T, Osterberg U, Paulsen K. Instrumentation and design of a frequency-domain diffuse optical tomography imager for breast cancer detection. Optics express. 1997;1 (13):391–403. doi: 10.1364/oe.1.000391. [DOI] [PubMed] [Google Scholar]
- 16.Schmitz CH, Graber HL, Luo H, Arif I, Hira J, Pei Y, Bluestone A. Instrumentation and calibration protocol for imaging dynamic features in dense-scattering media by optical tomography. Appl Opt. 2000;39(34):6466–6486. doi: 10.1364/ao.39.006466. [DOI] [PubMed] [Google Scholar]
- 17.Ntziachristos V, Hielscher AH, Yodh AG, Chance B. Diffuse optical tomography of highly heterogeneous media. IEEE transactions on medical imaging. 2001;20(6):470–478. doi: 10.1109/42.929613. [DOI] [PubMed] [Google Scholar]
- 18.Hielscher AH, Bluestone AY, Abdoulaev GS, Klose AD, Lasker J, Stewart M, Netz U, Beuthan J. Near-infrared diffuse optical tomography. Dis Markers. 2002;18(5–6):313–337. doi: 10.1155/2002/164252. [DOI] [PMC free article] [PubMed] [Google Scholar]
- 19.Khalil MA, Kim HK, Kim IK, Flexman M, Dayal R, Shrikhande G, Hielscher AH. Dynamic diffuse optical tomography imaging of peripheral arterial disease. Biomedical optics express. 2012;3(9):2288–2298. doi: 10.1364/BOE.3.002288. [DOI] [PMC free article] [PubMed] [Google Scholar]
- 20.Lasker JM, Masciotti JM, Schoenecker M, Schmitz CH, Hielscher AH. Digital-signal-processor-based dynamic imaging system for optical tomography. The Review of scientific instruments. 2007;78(8):083706. doi: 10.1063/1.2769577. [DOI] [PubMed] [Google Scholar]
- 21.Kim HK, Flexman M, Yamashiro DJ, Kandel JJ, Hielscher AH. PDE-constrained multispectral imaging of tissue chromophores with the equation of radiative transfer. Biomedical optics express. 2010;1(3):812–824. doi: 10.1364/BOE.1.000812. [DOI] [PMC free article] [PubMed] [Google Scholar]
- 22.Lasker JM, Fong CJ, Ginat DT, Dwyer E, Hielscher AH. Dynamic optical imaging of vascular and metabolic reactivity in rheumatoid joints. J Biomed Opt. 2007;12(5):052001. doi: 10.1117/1.2798757. [DOI] [PubMed] [Google Scholar]
- 23.Pogue BW, Davis SC, Song X, Brooksby BA, Dehghani H, Paulsen KD. Image analysis methods for diffuse optical tomography. J Biomed Opt. 2006;11(3):33001. doi: 10.1117/1.2209908. [DOI] [PubMed] [Google Scholar]
- 24.McGregor AD. The angiosome--an in vivo study by fluorescein angiography. British journal of plastic surgery. 1992;45(3):219–221. doi: 10.1016/0007-1226(92)90081-8. [DOI] [PubMed] [Google Scholar]
- 25.Taylor GI, Palmer JH. Angiosome theory. British journal of plastic surgery. 1992;45(4):327–328. doi: 10.1016/0007-1226(92)90063-4. [DOI] [PubMed] [Google Scholar]
- 26.Suami H, Taylor GI, Pan WR. Angiosome territories of the nerves of the lower limbs. Plastic and reconstructive surgery. 2003;112(7):1790–1798. doi: 10.1097/01.PRS.0000091161.95599.D8. [DOI] [PubMed] [Google Scholar]
- 27.Ferraresi R, Centola M, Ferlini M, Da Ros R, Caravaggi C, Assaloni R, et al. Long-term Outcomes after Angioplasty of Isolated, Below-the-knee Arteries in Diabetic Patients with Critical Limb Ischaemia. Eur J Vasc Endovasc. 2009;37(3):336–342. doi: 10.1016/j.ejvs.2008.12.001. [DOI] [PubMed] [Google Scholar]