Fig. 2.

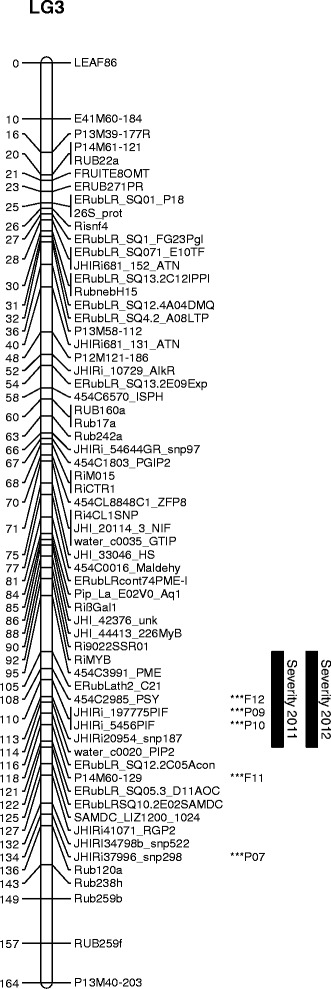
Linkage map for LG 3. The most significant markers according to the Kruskal-Wallis test are shown by *** for each binary trait, together with year and site. One-lod support intervals for the severity traits are also shown

Linkage map for LG 3. The most significant markers according to the Kruskal-Wallis test are shown by *** for each binary trait, together with year and site. One-lod support intervals for the severity traits are also shown