

Abstract
Background
Immune hyperactivation in immunodiscordant patients can induce residual HIV replication and limit CD4 T cell recovery. We assessed the impact of raltegravir intensification on CD4 T cell recovery and viral persistence.
Methods
We performed a randomized, controlled, pilot trial. Patients with CD4 T cell counts <350 cells/mm3 despite suppressive antiretroviral therapy were randomized (2 : 1) to intensify with raltegravir (intensified arm, n = 30) or to continue with the same regimen (control arm, n = 14) for 48 weeks. Then, the control individuals intensified their treatment for 24 weeks (delayed-intensification arm). We analysed changes in CD4 T cell counts, total and episomal HIV DNA in peripheral blood mononuclear cells and predictive factors for response.
Results
Raltegravir intensification induced a rapid increase in CD4 T cell counts (week 12) (P = 0.007), although this was not sustained over time. Control patients maintained constant but slow increases in CD4 T cell counts (present in the pre-study period), reaching CD4 T cell counts similar to those of patients in the intensification arm at week 48. This effect was confirmed by the analysis of the delayed-intensification arm. Proviral DNA levels remained stable in both arms over time; episomal DNA forms and ultrasensitive plasma viral load were barely detected during the study. Increases in CD4 T cell counts were associated with low baseline CD95 expression in CD4 and CD8 T cells (P = 0.020).
Conclusions
Raltegravir intensification modestly impacts viral dynamics and induces a rapid but limited gain in CD4 T cell counts in immunodiscordant patients. Residual viral replication does not seem to be the main cause of unsatisfactory CD4 T cell recovery in these patients.
Keywords: immune recovery, viral suppression, discordant patients, integrase inhibitor
Introduction
Successful highly active antiretroviral therapy (HAART) suppresses plasma HIV-1 RNA in most HIV-infected patients and favours immune recovery. However, the recovery of CD4 T cells varies between individuals. This fact could be explained by the anti-HIV potency and toxicity of antiretroviral treatment, although it seems more likely to be linked to a series of virological and immunological factors, as well as the patients' characteristics before treatment initiation.1–3
Poor immune recovery has been closely associated with clinical progression and higher mortality.4 Therefore it is of interest to investigate the primary causes and the pathogenic mechanisms that prevent a complete immune response. We recently demonstrated that the pathogenic mechanism leading to the discordant response was an increased level of intrinsic CD4 T cell apoptosis that was strongly associated with CD4 T cell hyperactivation.5,6 Since hyperactivation could be associated with residual viral replication,7 we designed the present study to assess the impact of antiretroviral intensification with raltegravir on immunological and virological parameters in subjects with an unfavourable immune response to HAART despite achievement of sustained virological suppression (Discor-Ral Study).
Methods
The study (ClinicalTrials.gov NCT00773708) was approved by the institutional review board of Germans Trias i Pujol University Hospital. We enrolled 49 HIV-1-infected subjects on suppressive HAART for at least 96 weeks with CD4 T cell counts <350 cells/mm3.8 All patients provided their written informed consent.
Participants were randomly assigned (2 : 1) to intensify their current HAART with raltegravir, 400 mg/12 h (intensified arm) or to continue with the same therapy (control arm) for 48 weeks of follow-up. Thereafter, raltegravir was added to the control arm and patients were followed until week 72 (delayed-intensification arm).
CD4/CD8 T cell counts, activation and apoptosis markers,8 plasma viral load (pVL) by standard and ultrasensitive (single copy assay, detection limit 0.5–2 copies/mL) assays, and total and episomal (2-LTR circles) HIV DNA7 were assessed. Three determinations of absolute CD4 T cell counts prior to study entry (48 week pre-study period) were also recorded to compare pre-study and study periods.
The primary objective of the study was to assess the impact of raltegravir intensification on CD4 T cell counts, the rate of CD4 T cell changes (slope coefficient) and the percentage of responder subjects (increase >50 CD4 T cells/mm3 from the mean of the pre-study and baseline values). The same endpoints were assessed after adding data from weeks 48–72 of the delayed-intensification arm.
We used two-sided Wilcoxon, Mann–Whitney, χ2, and Fisher's exact tests for comparative analyses and linear mixed models to study longitudinal changes in CD4 T cell counts (package lme4, R software). Analysis of covariance was performed to assess the differences in models between groups and within groups longitudinally. Logistic regression models were constructed to identify baseline predictors of response.
Results
The final sample comprised 44 patients: 30 in the intensified arm and 14 in the control arm. The demographic and clinical parameters are summarized in Table 1. Five patients (17%) from the intensified arm withdrew from the study for the following reasons: one voluntary decision (week 36), one protocol deviation (week 48) and three adverse events unrelated to the study medication. Seven of the 14 control patients agreed to continue the study and received raltegravir at week 48 (delayed-intensification arm).
Table 1.
Baseline patient characteristics and evolution of absolute and percentage CD4 T cells throughout the study
| Parameter | Intensified arm (n = 30) | Control arm (n = 14) | P value between groups |
|---|---|---|---|
| Baseline characteristics | |||
| Gender, male, n (%) | 12 (86.7) | 26 (85.7) | 0.932 |
| Age, years, median (IQR) | 48.5 (44.0–53.4) | 45.5 (41.8–50.8) | 0.221 |
| >55 years, n (%) | 6 (20) | 2 (14) | 0.647 |
| Hepatitis C coinfection, n (%) | 6 (20) | 7 (50) | 0.005 |
| Hepatitis B coinfection, n (%) | 2 (6.7) | 1 (7.1) | 0.148 |
| Time from diagnosis, months, median (IQR) | 171 (87–251) | 175 (57–239) | 0.678 |
| Nadir CD4 T cells, cells/mm3, median (IQR) | 90 (24–117) | 67 (14–108) | 0.435 |
| <100 CD4 cells/mm3, n (%) | 18 (60) | 10 (71.4) | 0.563 |
| Time on suppressive HAART, months, median (IQR) | 70 (42–102) | 67 (42–116) | 0.868 |
| Antiretroviral combination | 0.858 | ||
| current use of PIs, n (%) | 18 (60) | 8 (57) | |
| current use of NNRTI, n (%) | 12 (40) | 6 (43) | |
| Time on NNRTIs, months, median (IQR) | 38 (12–82) | 37 (29–62) | 0.845 |
| Time on PIs, months, median (IQR) | 49 (23–108) | 41 (23–58) | 0.711 |
| CD4 T cell countsa | |||
| Absolute CD4 T cell counts (cells/mm3), median (IQR) | |||
| baseline | 253 (208–301) | 242 (188–292) | 0.668 |
| week 12 | 285b (240–365) | 243 (193–337) | 0.200 |
| week 24 | 315b (248–354) | 252c (221–333) | 0.232 |
| week 48 | 281c (230–320) | 247c (212–411) | 0.849 |
| Percentage CD4 T cell counts (cells/mm3), median (IQR) | |||
| baseline | 19 (14–22) | 19 (15–21) | 0.761 |
| week 12 | 20b (16–25) | 19 (16–22) | 0.556 |
| week 24 | 20b (16–25) | 19 (16–26) | 0.544 |
| week 48 | 19 (15–22) | 18c (17–23) | 0.670 |
HAART, highly active antiretroviral therapy; NNRTI, non-nucleoside reverse transcriptase inhibitor; PI, protease inhibitor.
aNo differences in CD4 T cell counts were seen between groups at any timepoint.
bStatistically significant intragroup differences between that visit and baseline (P < 0.01).
cStatistically significant intragroup differences between that visit and baseline (P < 0.05).
CD4 T cell counts progressively increased in both groups, although in different ways. Median absolute CD4 T cell count significantly increased at week 12 in the intensified arm (P = 0.007); remaining stable thereafter and maintaining significantly higher levels than baseline at weeks 24, 36 and 48 (P = 0.001, P = 0.0035 and P = 0.015, respectively). CD4 T cell counts in the control arm reached significant differences at weeks 24, 36, and 48 (P = 0.016, P = 0.0096 and P = 0.041, respectively). Similar findings were observed for the percentage of CD4 T cells, with significant increases from baseline in the intensified arm at weeks 12 and 24 (P = 0.003 and P = 0.001, respectively), and at week 48 in the control arm (P = 0.015). No differences between arms were observed in absolute counts or percentages of CD4 T cells at any timepoint.
A monophasic analysis using all available timepoints per group showed positive slopes for the CD4 T cell increase from baseline to week 48 in the intensified (slope coefficient 0.5 ± 0.2; P = 0.016) and control arms (slope coefficient 0.8 ± 0.2; P = 0.0003), with no differences between arms (P = 0.608) (Figure 1a).
Figure 1.
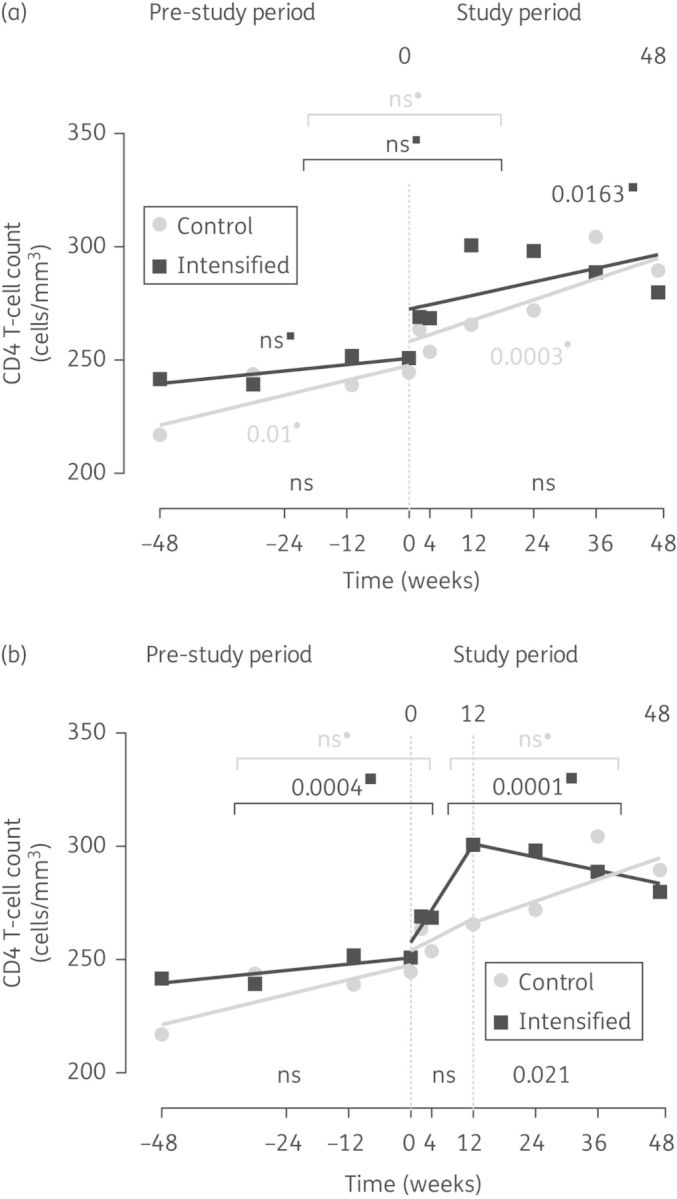
CD4 T cell dynamics. The figure shows the mean values and the slopes of CD4 T cell counts in the intensified arm (squares) and control arm (circles) during the 48 weeks before the study (pre-study period) and during the study (study period). Slopes were determined by linear mixed models using (a) a monophasic analysis or (b) a biphasic analysis. P values comparing intragroup slope coefficients between the different periods are shown in the upper part of each panel. P values indicating that slope coefficients are different from zero are shown close to each line in both panels. P values comparing slope coefficients between arms are shown in the lower part of each panel.
However, the most explanatory fit (P < 0.0001) was achieved using a two-phase model (0–12 and 12–48 weeks) (Figure 1b). In the intensified arm, this fit yielded a significant positive slope from baseline to week 12 (slope coefficient 3.6 ± 1.0; P = 0.0005) and a flat behaviour thereafter (slope coefficient –0.5 ± 0.5; P = 0.716), with significant differences between both slopes (P = 0.0001). Although the biphasic model fitted better to the dynamics of the control arm (P = 0.0085), similar slopes were found in this group for both study phases (0–12 and 12–48 weeks, P = 0.8152). The comparison of pre-study and 0–12 week study slopes revealed significant differences in the intensified arm (P = 0.0004), whereas the control group maintained similar rates of CD4 T cell increase over time (P = 0.5016; Figure 1a and b).
During the pre-study period, 23% of intensified subjects had a CD4 T cell count increase >50 cells/mm3, rising to 43% after 12 weeks of intensification (P = 0.144), while 36% and 21% of control individuals showed an increase >50 cells/mm3 in the pre-study and study periods, respectively (P = 0.923). Again, no significant differences between arms were found (P = 0.306).
After the addition of data from the seven subjects in the delayed-intensification arm to data from the intensified arm (baseline to week 24), the expanded intensified arm (intensified + delayed-intensification arms) maintained significant increases in CD4 T cell counts from baseline at weeks 12 and 24 (P = 0.003 and P < 0.0001, respectively; data not shown).
No rebounds in pVL were noted. Moreover, ultrasensitive viral load (SCA) at baseline was detected in only 20% of patients from the intensified arm and 21% from the control arm (P = 1.0) (only two samples >10 copies/mL). Then, no further determinations were performed. Total HIV DNA remained stable in both groups, showing no significant differences intra- or inter-group at any timepoint. Only three individuals in the intensified group and one individual in the control group showed detectable but low levels of episomal DNA at any timepoint (P = 0.418 between groups; Figure S1, available as Supplementary data at JAC Online).
Among the predisposing factors, only lower levels of CD95 expression in either CD4 or CD8 T cells at baseline were more probable in responders [CD95+ cells in CD4 T cells, OR = 1.1, P = 0.025; CD95+ cells in CD8 T cells, OR = 1.1, P = 0.020].
Discussion
In addition to the impaired production of new naive T cells,9 we have shown that blunted CD4 T cell recovery is associated with CD4 T cell hyperactivation and death.5,6 Ongoing viral replication could explain poor CD4 T cell recovery in some patients, as it drives T cell activation, sequesters CD4 T cells in inflamed tissues and favours unbalanced T cell production/destruction by increasing cell death. In turn, high levels of activation in CD4 T cells in immunodiscordant patients5 may favour continued de novo infection in tissues. Therefore we expected ready detection of 2-LTR circles, a surrogate marker of new infection cycles.8 However, only three subjects in the intensified arm showed detectable levels of 2-LTR circles, a similar rate to that observed in control individuals. The low CD4 T cell count in peripheral blood could account for the lack of detection of 2-LTR circles. Additionally, tissue fibrosis and low CD4 T cell density in immunodiscordant patients10 could limit the dynamics of infection, specifically by hampering cell-to-cell virus transmission,11 the most plausible mechanism involved in persistent replication during therapy. Consistently, total proviral DNA in peripheral blood mononuclear cells (PBMCs) remained stable in both study arms throughout the study, confirming data from previous intensification studies.7,12,13 Similarly, plasma ultrasensitive viral load at baseline was undetectable in most patients (80%), supporting the notion that low-level plasma viraemia is not an alternative cause of poor immune recovery.
Irrespective of virological outcome, the evidence suggests a modest effect on CD4 T cell counts after intensification with raltegravir or maraviroc in immunodiscordant patients,14,15 even though other authors dismiss the benefit of intensification strategies.16–18 In our study, an early benefit in CD4 T cell counts was observed in immunodiscordant subjects intensified with raltegravir. However, no differences were observed between groups at the end of the study. A rapid but limited CD4 T cell count increase could be explained by redistribution of memory cells from tissues, which is a limited source, since no changes in thymic output were observed8 that would result in a more sustained CD4 T cell gain. The link between higher CD4 T cell gain after intensification and lower baseline levels of CD95 expression in both CD4 and CD8 T cells may fit with this observation and suggests that immune markers could be a suitable predictor of response and a useful tool for identifying individuals who could benefit from an intensification strategy.
In summary, intensification with raltegravir induced a rapid gain and subsequent stabilization of CD4 T cell counts in some of our immunodiscordant patients without changes in virological parameters. Therefore raltegravir-susceptible residual viral replication does not seem to be the main cause of unsatisfactory CD4 T cell recovery in these patients.
Funding
This study was supported by the Spanish AIDS network ‘Red Temática Cooperativa de Investigación en SIDA’ (RD06/0006), an unrestricted grant from Merck Sharp & Dohme (MSD), and the Gala contra la sida, Barcelona 2011. J. B. is a researcher from Fundació Institut de Recerca en Ciències de la Salut Germans Trias i Pujol and is supported by the ISCIII and the Health Department of the Catalan government (Generalitat de Catalunya). M. J. B. and M. M. were supported by Agència de Gestió d'Ajuts Universitaris i de Recerca from Generalitat de Catalunya and by the European Social Fund. M. M. is participating in the Pompeu Fabra University PhD programme.
Transparency declarations
The authors have no conflicts of interest that are directly relevant to the content of this study.
Author contributions
E. N., M. M., B. C. and J. B. designed the study. E. N., A. B., J. M., A. J., P. E. and J. M. L. were in charge of recruitment and monitoring of patients. J. P. performed blood extractions and was responsible for database management. M. M. and J. B. performed the immunological determinations, and M. C. P., M. J. B. and J. M.-P. performed the virological analysis. N. P.-A. and J. P.-S. performed the statistical analysis. All the authors contributed to the writing of the manuscript.
Supplementary data
Figure S1 is available as Supplementary data at JAC Online (http://jac.oxfordjournals.org/).
Acknowledgements
We are grateful to the Discor-Ral collaborative group members; J. Toro for clinical monitoring during the study and R. Ayén, T. González, E. Grau, E. García, S. Marfil, and J. Carrillo for sample processing. We wish to thank the volunteers who participated in this study.
References
- 1.Gazzola L, Tincati C, Bellistri GM, et al. The absence of CD4+ T cell count recovery despite receipt of virologically suppressive highly active antiretroviral therapy: clinical risk, immunological gaps, and therapeutic options. Clin Infect Dis. 2009;48:328–37. doi: 10.1086/595851. [DOI] [PubMed] [Google Scholar]
- 2.Rajasuriar R, Gouillou M, Spelman T, et al. Clinical predictors of immune reconstitution following combination antiretroviral therapy in patients from the Australian HIV Observational Database. PLoS One. 2011;6:e20713. doi: 10.1371/journal.pone.0020713. [DOI] [PMC free article] [PubMed] [Google Scholar]
- 3.Torti C, Prosperi M, Motta D, et al. Factors influencing the normalization of CD4+ T-cell count, percentage and CD4+/CD8+ T-cell ratio in HIV-infected patients on long-term suppressive antiretroviral therapy. Clin Microbiol Infect. 2012;18:449–58. doi: 10.1111/j.1469-0691.2011.03650.x. [DOI] [PubMed] [Google Scholar]
- 4.Opportunistic Infections Project Team of the COHERE in EuroCoord. CD4 cell count and the risk of AIDS or death in HIV-infected adults on combination antiretroviral therapy with a suppressed viral load: a longitudinal cohort study from COHERE. PLoS Med. 2012;9:e1001194. doi: 10.1371/journal.pmed.1001194. [DOI] [PMC free article] [PubMed] [Google Scholar]
- 5.Massanella M, Negredo E, Perez-Alvarez N, et al. CD4 T-cell hyperactivation and susceptibility to cell death determine poor CD4 T-cell recovery during suppressive HAART. AIDS. 2010;24:959–68. doi: 10.1097/QAD.0b013e328337b957. [DOI] [PubMed] [Google Scholar]
- 6.Negredo E, Massanella M, Puig J, et al. Nadir CD4 T cell count as predictor and high CD4 T cell intrinsic apoptosis as final mechanism of poor CD4 T cell recovery in virologically suppressed HIV-infected patients: clinical implications. Clin Infect Dis. 2010;50:1300–8. doi: 10.1086/651689. [DOI] [PubMed] [Google Scholar]
- 7.Buzon MJ, Massanella M, Llibre JM, et al. HIV-1 replication and immune dynamics are affected by raltegravir intensification of HAART-suppressed subjects. Nat Med. 2010;16:460–5. doi: 10.1038/nm.2111. [DOI] [PubMed] [Google Scholar]
- 8.Marta Massanella M, Negredo E, Puig J, et al. Raltegravir intensification shows differing effects on CD8 and CD4 T cells in HIV infected HAART-suppressed individuals with poor CD4 T cell recovery. AIDS. 2012;26:2285–93. doi: 10.1097/QAD.0b013e328359f20f. [DOI] [PubMed] [Google Scholar]
- 9.Li T, Wu N, Dai Y, et al. Reduced thymic output is a major mechanism of immune reconstitution failure in HIV-infected patients after long-term antiretroviral therapy. Clin Infect Dis. 2011;53:944–51. doi: 10.1093/cid/cir552. [DOI] [PubMed] [Google Scholar]
- 10.Zeng M, Smith AJ, Wietgrefe SW, et al. Cumulative mechanisms of lymphoid tissue fibrosis and T cell depletion in HIV-1 and SIV infections. J Clin Invest. 2011;121:998–1008. doi: 10.1172/JCI45157. [DOI] [PMC free article] [PubMed] [Google Scholar]
- 11.Sigal A, Kim JT, Balazs AB, et al. Cell-to-cell spread of HIV permits ongoing replication despite antiretroviral therapy. Nature. 2011;477:95–8. doi: 10.1038/nature10347. [DOI] [PubMed] [Google Scholar]
- 12.Llibre JM, Buzon MJ, Massanella M, et al. Treatment intensification with raltegravir in subjects with sustained HIV-1 viraemia suppression: a randomized 48-week study. Antivir Ther. 2012;17:355–64. doi: 10.3851/IMP1917. [DOI] [PubMed] [Google Scholar]
- 13.Vallejo A, Gutierrez C, Hernandez-Novoa B, et al. The effect of intensification with raltegravir on the HIV-1 reservoir of latently infected memory CD4 T cells in suppressed patients. AIDS. 2012;26:1885–94. doi: 10.1097/QAD.0b013e3283584521. [DOI] [PubMed] [Google Scholar]
- 14.Gandhi RT, Zheng L, Bosch RJ, et al. The effect of raltegravir intensification on low-level residual viremia in HIV-infected patients on antiretroviral therapy: a randomized controlled trial. PLoS Med. 2010;7 doi: 10.1371/journal.pmed.1000321. [DOI] [PMC free article] [PubMed] [Google Scholar]
- 15.Cuzin L, Trabelsi S, Delobel P, et al. Maraviroc intensification of stable antiviral therapy in HIV-1-infected patients with poor immune restoration: MARIMUNO ANRS 145 study; J Acquir Imm Defic Syndr; 2012. pp. 557–64. [DOI] [PubMed] [Google Scholar]
- 16.Gutierrez C, Diaz L, Vallejo A, et al. Intensification of antiretroviral therapy with a CCR5 antagonist in patients with chronic HIV-1 infection: effect on T cells latently infected. PLoS One. 2011;6:e27864. doi: 10.1371/journal.pone.0027864. [DOI] [PMC free article] [PubMed] [Google Scholar]
- 17.McMahon D, Jones J, Wiegand A, et al. Short-course raltegravir intensification does not reduce persistent low-level viremia in patients with HIV-1 suppression during receipt of combination antiretroviral therapy. Clin Infect Dis. 2010;50:912–9. doi: 10.1086/650749. [DOI] [PMC free article] [PubMed] [Google Scholar]
- 18.Byakwaga H, Kelly M, Purcell DF, et al. Intensification of antiretroviral therapy with raltegravir or addition of hyperimmune bovine colostrum in HIV-infected patients with suboptimal CD4+ T cell response: a randomized controlled trial. J Infect Dis. 2011;204:1532–40. doi: 10.1093/infdis/jir559. [DOI] [PubMed] [Google Scholar]
Associated Data
This section collects any data citations, data availability statements, or supplementary materials included in this article.