

Abstract
Motivation: Microsatellites are among the most useful genetic markers in population biology. High-throughput sequencing of microsatellite-enriched libraries dramatically expedites the traditional process of screening recombinant libraries for microsatellite markers. However, sorting through millions of reads to distill high-quality polymorphic markers requires special algorithms tailored to tolerate sequencing errors in locus reconstruction, distinguish paralogous loci, rarify raw reads originating from the same amplicon and sort out various artificial fragments resulting from recombination or concatenation of auxiliary adapters. Existing programs warrant improvement.
Results: We describe a microsatellite prediction framework named HighSSR for microsatellite genotyping based on high-throughput sequencing. We demonstrate the utility of HighSSR in comparison to Roche gsAssembler on two Roche 454 GS FLX runs. The majority of the HighSSR-assembled loci were reliably mapped against model organism reference genomes. HighSSR demultiplexes pooled libraries, assesses locus polymorphism and implements Primer3 for the design of PCR primers flanking polymorphic microsatellite loci. As sequencing costs drop and permit the analysis of all project samples on next-generation platforms, this framework can also be used for direct simple sequence repeats genotyping.
Availability: http://code.google.com/p/highssr/
Contact: alexander@big.ac.cn
Supplementary Information: Supplementary data are available at Bioinformatics online.
1 INTRODUCTION
Microsatellites or simple sequence repeats (SSRs) are tandemly repeated DNA motifs 2–6 bp in length that typically harbor high levels of sequence polymorphism. This level of variability has led to widespread use of SSRs in many areas of molecular biology, including applications in forensics and paternity testing (Carracedo and Sánchez-Diz, 2004; Menotti-Raymond et al., 2005)], population genetics and conservation/management of biological resources (Luikart et al., 2003). Until recently, the major obstacle to SSR use was slow and costly de novo isolation of SSRs for each taxon being investigated. SSR marker development has typically involved fractionation of the genome, enrichment for SSR-containing fragments, construction of a clone library from the enriched fraction, Sanger sequencing of clones and informatics analysis to identify SSR-containing fragments and PCR primer sites (Zane et al., 2002). The procedure continues with the evaluation of amplification efficiency and polymorphism of each locus. Thus, it entails considerable time and investment to develop the large numbers of SSRs necessary to study patterns of diversification between populations (Cooper et al., 1999; Zhivotovsky and Feldman, 1995) or to construct genetic maps (Luikart et al., 2003).
Next-generation sequencing technologies are revolutionizing the process of SSR discovery by reducing cost and time to a fraction of what was previously needed (Abdelkrim et al., 2009; Dutta et al., 2011; Saarinen and Austin, 2010; Santana et al., 2009), but the millions of raw sequencing reads they produce necessitates in silico automation of SSR prediction and locus classification (Faircloth, 2008; Meglécz et al., 2010; You et al., 2008).
In this article, we present the HighSSR framework for SSR discovery and locus development from 454-generated raw data. HighSSR facilitates the recognition of SSR motifs, the parsing of MID tagged sequences for identification of multiplexed samples, the identification of unique SSR loci within a sample and the development of PCR primers for the recovered loci. Unlike other methods, HighSSR first predicts SSRs for all input sequences and later uses the SSRs as pivots to assemble loci. In other words, it begins by grouping reads based on their SSR motif and proceeds toward locus identification through comparisons of the more complex flanking regions. The approach greatly reduces computational time by eliminating the need for all-against-all alignments, as implemented in QDD framework (Meglécz et al., 2010), and therefore permits SSR locus identification and development from millions of reads simultaneously. It also takes advantage of a PostgreSQL database for efficient data management throughout the process.
In this article, we evaluate HighSSR using multiplexed SSR-enriched sequences collected on the Roche 454 GS-FLX platform. First (hereafter the ‘first run’), we examine two siblings of a non-model butterfly of conservation concern (Euphydryas anicia cloudcrofti) because previously reported Lepidoptera SSR primers (Palo et al., 1995; Petenian et al., 2005; Sarhan, 2006) failed for their genotyping. Next (hereafter the ‘second run’), we evaluate the performance of HighSSR in a multiplexed experiment of 60 species including mosquito, cress plant and chestnut blight fungus (Aedes aegypti, Arabidopsis thaliana and Cryphonectria parasitica, respectively) for which there are published genomes and also nine populations of Euphydryas butterfly without reference genomes.
2 SYSTEM AND METHODS
2.1 Overview
The work flow associated with HighSSR analysis using data derived from a multiplex sequencing run proceeds as follows:
Identify microsatellite containing reads using Tandem Repeats Finder (TRF) (http://tandem.bu.edu/trf/trf.advanced.submit.html; Benson, 1999).
Deposit raw reads, microsatellite predictions from Step 1 and reference genomes (optional) in a PostgreSQL database.
Assign SSRs to a canonical consensus.
Associate MID tags to respective samples using a hidden Markov model (HMM) structure.
Group reads into ‘crude clusters’ based on shared canonical consensuses and similarity in flanking regions for each organism. These are first approximations of loci. The crude clusters are stored in the database.
Refine crude clusters using a multiple alignment guide tree generated by MUSCLE (Edgar, 2004a, b) with the distance threshold between branches preset to sort potential paralogs into separate loci that are stored in the database.
Prioritize refined loci on the basis of the number of reads from which they are constructed, the length of flanking regions available for primer design and decreasing size of repeat motifs.
If multiple accessions of a taxon are included, select loci for potential polymorphism across accessions.
Design amplification primers for each locus using Primer3 (Rozen and Skaletsky, 2000).
2.2 SSR prediction and normalization
SSRs are identified and scored in raw sequencing reads with TRF (Benson, 1999), which relies on a probabilistic model. Further analysis requires that SSRs are assigned to their canonical consensuses so that microsatellites of the same type are processed unambiguously (Fig. 1). All predicted SSRs and their assignments to the canonical consensuses are stored in a PostgreSQL database.
Fig. 1.
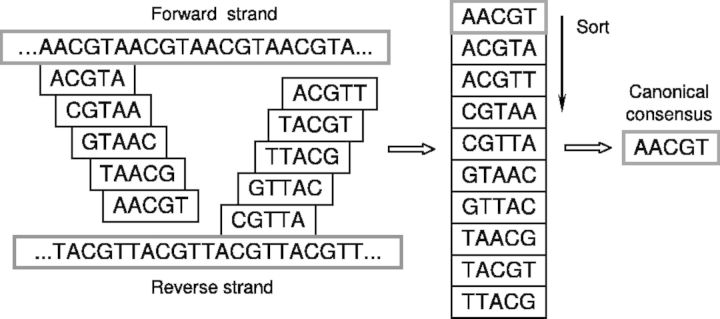
Example of finding of canonical consensus from polyrepeat (ACGTA)n. All possible consensuses for the SSR on sense and antisense strands are enumerated. After sorting, first in the list is chosen as the canonical consensus
2.3 Demultiplexing reads with a universal amplification primer
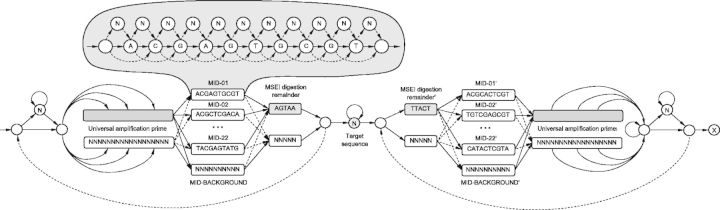
Multiplex identifiers (MIDs) are commonly used to distinguish sequences from different DNA samples pooled on the same plate region. HighSSR implements a program based on HMM to recognize the MIDs along with a universal amplification primer that was ligated to MseI restricted gDNA fragments. The remainder of the MseI recognition site provides additional evidence for target sequence localization. The structure of the adapter and target DNA sequence is shown in Figure 2.
Fig. 2.

Structure of a raw reads where target DNA sequence is surrounded by auxiliary adapters such as universal amplification primer, remnants of MSEI digestion sites and MID used to attribute a sequence to the original sample
The program establishes HMM structure (Fig. 3) and identifies sequence fragments by reconstructing the optimal threading of the sequence with the Viterbi algorithm (Viterbi, 1967). Decoded MID fragments associate target sequences to samples.
Fig. 3.
HMM structure used to recognize universal amplification primers along with the MIDs and remnants of digestion sites. Unlikely transitions are shown as dashed lines
We tested the false-positive rate of demultiplexing with the sequences from our second 454 run and unused MID sequences described in Roche TCB No. 005-2009 technical bulletin (Fig. 4). Levenshtein edit distances (Levenshtein, 1966) are recorded for each MID and adapter sequence. Constraining edit distance to be less than or equal to one significantly improves MID recognition fidelity and lowers the number of false positives (Fig. 4b). By restricting the edit distance between HMM-recognized MIDs and the target MIDs, only those sequences that can be assigned to their original sample with high confidence are retained, because mistakes in MIDs normally indicate poor overall quality of a read (Quince et al., 2009, 2011).
Number of demultiplexed reads sorted by regions and MIDs.
Number of demultiplexed reads sorted by regions and MIDs. Since MIDs listed have never been used in our experiments, here we asses false-positive rate of demultiplexing.
Fig. 4.
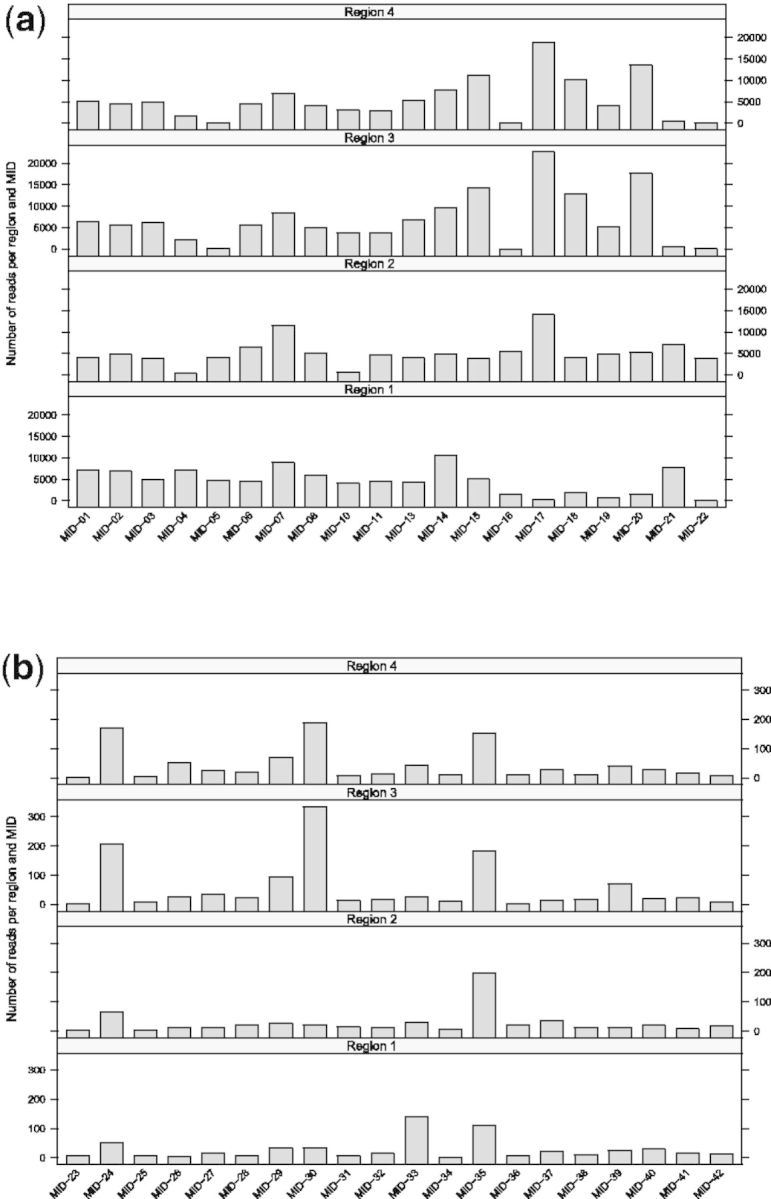
Demultiplexing performance for the second sequencing run
2.4 Crude clustering of reads and locus refinement
Sequences with the same SSR canonical consensus and the same flanking sequences are grouped into ‘crude clusters’ by the following process. SSRs originating from the same sample are first binned to groups that share the same canonical consensus. Each round of crude clustering starts with a seed SSR with both flanks ideally 50 nt in length and 30 nt at a minimum. Candidate sequences are added to the cluster one by one based on comparison with the seed sequence. Flanking sequences of the seed SSR are compared in a 7-nt sliding window to each candidate added to the group. The threshold should be set to least 30 – 7 = 23 for the number of oligonucleotides matching on a flank of a seed SSR and a crude cluster candidate SSR, following an observation that one substitution would result in 7 oligo mismatches. Clustering in each group continues iteratively until the group is exhausted, and the groups are processed sequentially, starting with the largest to free memory for further processing. Information on newly created crude clusters and participating SSRs is deposited to the database. Clustered SSRs do not participate in the subsequent clustering rounds.
Crude clusters are aligned with MUSCLE (Edgar, 2004 a, b) to identify paralogs. MUSCLE is chosen for its accuracy and speed (Edgar, 2004a). A guide tree reported by MUSCLE is used to determine whether to merge loci, beginning with the most closely associated sequences located at the top of the tree and working down to the root (Fig. 5). Two metrics of dissimilarity are used to compare the consensus sequences depending on complexity of a region (Fig. 6). In areas of high complexity, both indels and substitutions contribute to the distance between the consensus sequences. In low complexity regions (SSRs), indels are not included in the distance calculation.
Fig. 5.

Locus reconstruction based on the MUSCLE guide tree. Consensuses D and X are treated as paralogs if they are too distant. Arrows indicate what consensuses are combined according to a guide tree toward unified consensus representing a multiple alignment combining corresponding raw reads
Fig. 6.
Schematic representation of multiple sequence alignment used for locus reconstruction. The consensus is reconstructed by assigning a nucleotide at each position most common in the multiple alignment column corresponding to that position
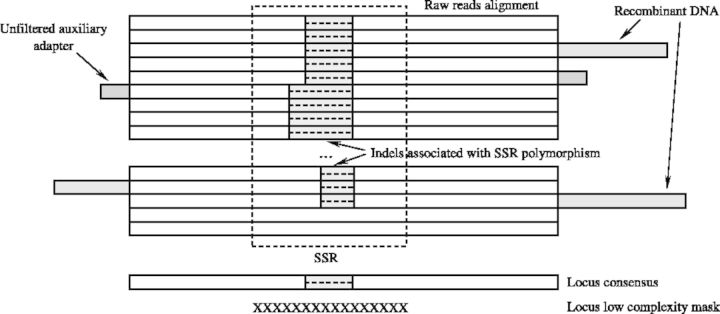
To estimate similarity between loci HighSSR generates all possible 12 nt oligos from the high complexity flanks and connects them by edges in a graph if the number of oligos shared between the loci (nodes) is more than 4. It builds a histogram representing the number of times an oligo is detected in the locus-flanking regions and approximates this distribution by a Mixture of Gaussians (MOG). A 10-component MOG is fit to the histogram using an expectation maximization algorithm (Bilmes, 1998). The program eliminates from further analysis all the oligos that are classified by maximum a posteriori to a Gaussian component with the maximum mean value. This strategy sorts out inflated homology scores associated with oligos that are ubiquitous among the target sequences (such as fragments of mobile elements) and also oligos that are parts of unfiltered auxiliary sequencing adapters. To deal with the unfiltered auxiliary adapters and recombinant DNA fragments that normally stick out of the multiple sequence alignments resulting from restriction digestion (Fig. 5), we trim flanking multiple alignment columns that are below minimum occupancy (non-gap symbols) at a threshold of 5%.
The maximum number of sequences per locus is reported. Loci are listed in decreasing order of their SSR insert size because longer SSRs are most frequently the most polymorphic markers (Buschiazzo and Gemmell, 2006). Paralogs are not reported.
2.5 Sequencing library preparation
We tested the performance of HighSSR in the analysis of two Roche 454 GS-FLX sequencer runs. SSRs were enriched as follows (modified from Glenn and Schable, 2005; Zane et al., 2002). Genomic DNA was digested with MseI, sequencing adaptors were ligated to the fragment ends (these include the universal amplification component plus diagnostic MID) and the fragments were amplified by PCR for 30 cycles. The resulting amplicons were enriched for SSRs by hybridization with a mixture of biotinylated probes ((AG)n, (TG)n, (AAC)n, (AAG)n, (AAT)n, (ACT)n, (ATC)n). We recommend enriching genomic DNA for trinucleotide (or larger) repeats because dinucleotide SSRs are subject PCR slippage (Ellegren, 2004; Perlin et al., 1995) and more difficult to score. Subsequent library preparation was performed according to the Roche protocol.
2.6 Genotyping experiments
Thirteen loci identified in the first run by HighSSR were chosen for genotyping on the criteria of exhibiting three to six nucleotide repeats and four or fewer alleles (to reduce potential complications in analysis from paralogs), and flanking regions with a high GC content. PCR conditions are described in Supplementary Materials. Amplicons were sequenced (ABI 3100) and aligned to closely matching alleles using MUSCLE (Edgar, 2004a, b) and consensus sequences were reconstructed from the corresponding HighSSR loci (Supplementary Materials).
3 RESULTS
In the first run, HighSSR reduced  million raw sequence reads to 1901 unique SSR-containing loci with a consensus size of 3–6 nt shared between two samples (Tables 1, 4 and 5). The number of reconstructed loci is substantially lower than the number of putative loci (37 072) because paralogous loci and loci with flanking sequences of low complexity are removed. Three of 13 primer pairs chosen for genotyping from the first run were verified in three individuals by Sanger sequencing as reported in Supplementary Materials.
Table 1.
SSRs for the first run with consensus size 3–6 nt
| Feature | Number |
|---|---|
| Number of raw reads | 1 335 650 |
| Number of SSR-containing reads | 1 028 072 |
| Number of crude clusters | 59 489 |
| Number of putative loci | 37 072 |
| Number of reported SSR-containing loci | 1901 |
Table 4.
Geographic location of Euphydryas samples
| Accession number | Location | Run | Number of Loci |
|---|---|---|---|
| DHC | Deerhead Canyon, NM | First | 1901 |
| C1 | Cox Canyon, NM | Second | 145 |
| C2 | Cox Canyon, NM | Second | 116 |
| D4 | Deerhead Canyon, NM | Second | 158 |
| D7 | Deerhead Canyon, NM | Second | 392 |
| HMT1 | Horseshoe Mountain, CO | Second | 10 |
| HMT2 | Horseshoe Mountain, CO | Second | 3 |
| HOP1 | Hopewell Lake, NM | Second | 47 |
| HOP2 | Hopewell Lake, NM | Second | 50 |
Table 5.
Number of SSR-containing loci predicted by HighSSR shared between Euphydryas
| C2 | D4 | D7 | HMT1 | HMT2 | HOP1 | HOP2 | DHC | |
|---|---|---|---|---|---|---|---|---|
| C1 | 4 | 4 | 7 | 1 | 0 | 4 | 3 | 10 |
| C2 | 1 | 5 | 1 | 0 | 2 | 1 | 11 | |
| D4 | 27 | 2 | 1 | 6 | 4 | 21 | ||
| D7 | 4 | 0 | 6 | 4 | 56 | |||
| HMT1 | 1 | 0 | 0 | 3 | ||||
| HMT2 | 0 | 0 | 0 | |||||
| HOP1 | 2 | 4 | ||||||
| HOP2 | 5 |
The number of sequences demultiplexed from the second run is reported in Supplementary Materials and Figure 4. Positively identified MIDs out-number false positives by two orders of magnitude. The number of predicted false positives compares directly to that predicted by Roche demultiplexing utility sffinfo with several hundred false positives per quarter plate region. Table 2 lists the number of unique loci reconstructed using HighSSR in comparison to gsAssembler for model species in the second run. For all but one sample (A. aegypti), HighSSR recovered at least five times more loci than gsAssembler (Table 2). In our experiments, we ran gsAssembler on raw reads from the same sample. Although gsAssembler can report microsatellite polymorphisms among the variants found, default assembly settings proved very rudimentary for efficient microsatellite handling. We mapped all loci recovered by HighSSR to the published genomes of A. thaliana, A. aegypti and C. parasitica (Table 3) using gsMapper with default parameters to test HighSSR’s ability to assemble complex loci and parse orthologs into separate loci. All reconstructed loci were also reciprocally mapped with BLASTN (Altschul et al., 1990 using an expectation threshold of  . Between 85% and 100% of all loci recovered by HighSSR mapped to the published genomes and 100% of the mapped regions corresponded to unique non-overlapping locations in the genome.
Table 2.
Number of loci assembled from SSR containing samples
| Accession number | Organism | Number of raw reads | Number of HighSSR loci | Number of Newbler loci |
|---|---|---|---|---|
| 121 | Arabidopsis thaliana | 2140 | 65 | 3 |
| 122 | Arabidopsis thaliana | 5349 | 257 | 39 |
| 123 | Arabidopsis thaliana | 2655 | 55 | 10 |
| 124 | Arabidopsis thaliana | 2125 | 62 | 3 |
| 65 | Arabidopsis thaliana | 1897 | 65 | 7 |
| 81 | Aedes aegypti | 6690 | 104 | 103 |
| EP146 | Cryphonectria parasitica | 2241 | 51 | 6 |
| EP155 | Cryphonectria parasitica | 3775 | 141 | 24 |
HighSSR reconstructs more loci than Roche gsAssembler (Newbler).
Table 3.
Mapping results for HighSSR assembled loci against known reference genome
| Accession number | Organism | Number of loci used | Percent mapped loci | Percent bases mapped |
|---|---|---|---|---|
| 121 | Arabidopsis thaliana | 65 | 100.0 | 98.06 |
| 122 | Arabidopsis thaliana | 254 | 98.83 | 97.22 |
| 123 | Arabidopsis thaliana | 47 | 85.45 | 81.34 |
| 124 | Arabidopsis thaliana | 60 | 96.77 | 96.22 |
| 65 | Arabidopsis thaliana | 64 | 98.46 | 96.64 |
| 81 | Aedes aegypti | 104 | 100.0 | 94.26 |
| EP146 | Cryphonectria parasitica | 51 | 100.0 | 98.84 |
| EP155 | Cryphonectria parasitica | 133 | 94.33 | 93.31 |
Majority of the HighSSR assembled loci map against the reference genome. All the loci mapped against the reference genomes in unique non-overlapping positions.
4 DISCUSSION
Programs predicting SSRs within genomic DNA can be subdivided into several categories according to their underlying approach. RepeatMasker (http://www.repeatmasker.org) and DUST/SIMPLE (Alba et al., 2002; Hancock and Armstrong, 1994) are used to mask low-complexity fragments in biological sequences to speed up genome-wide pattern-match searches. STAR (Delgrange and Rivals, 2004) and TROLL (Castelo et al., 2002) look for predefined tandem motifs in the query sequence. TRF (Benson, 1999) is a popular SSR prediction and scoring tool that is based on sound probabilistic model. TRDB (Gelfand et al., 2007), InSatdb (Archak et al., 2007), TRbase (Boby et al., 2005), VNTRfinder along with PolyPredictR (O’Dushlaine et al., 2005) and UCSC genome browser (Kent et al., 2002) use TRF as an internal microsatellite prediction engine. We also adopted TRF for SSR prediction following the observation that raw sequencing reads frequently contain sequencing artifacts and polymorphic variations.
HighSSR represents an improvement over existing programs for the discovery of SSRs from next-generation sequence files. MsatFinder (http://www.genomics.ceh.ac.uk/msatfinder/), SSRIT (Temnykh et al., 2001), MISA (Thiel et al., 2003 and SSR finder (http://www.maizemap.org/bioinformatics/SSRFINDER/SSR_Finder_Download.html) search for SSRs with regular expressions, while Sputnik (http://espressosoftware.com/pages/sputnik.jsp), ATR-hunter (Wexler et al., 2005), TandemSWAN (Boeva et al., 2006), Mreps (Kolpakov et al., 2003) and TRStalker (Pellegrini et al., 2010) search for SSRs based on repeat size. None of the these report summary statistics and locus information. Imperfect SSR Finder (http://ssr.nwisrl.ars.usda.gov/), SciRoKo (Kofler et al., 2007), IMEx (Mudunuri and Nagarajaram, 2007) and TRF (Benson, 1999) efficiently screen genome sequences for perfect and imperfect microsatellites and report such statistics. However, they do not quantify the number of alleles of each SSR locus. Additional advantages of the HighSSR framework include the storage of intermediate results in a PostgreSQL database, permitting the examination of intermediate results and arranging analysis in a distributed server/client paradigm, and the use of freely available third-party software.
Our results confirm duplication of numerous SSR loci in insects (Vant Hof et al., 2007). In E. a. cloudcrofti among 1901 unique SSR-containing loci, 78 (4.1%) had three or more predicted alleles with perfectly matching flanking regions.
Although we present HighSSR as a platform for characterizing SSR loci for subsequent traditional PCR amplification and sizing, this framework and others like it will ultimately be amenable to genotype large sets of individuals run exclusively on next-generation sequencing platforms. This would take the same processing steps involved in design of PCR primers for SSR genotyping, where all the statistics on the alleles detected in the designed loci would be summarized in the table.
HighSSR can be applied to cluster reads made with newer platforms, such as Illumina HiSeq 2000/2500 and Ion Torrent PGM. Such improvements will permit comparisons of individuals across large numbers of loci, providing previously unheard-of resolving power.
Supplementary Material
ACKNOWLEDGEMENTS
Funding: National Science Foundation (DBI-0821806 to P.H. and B.M., DEB-0817033 to D.B.); Chinese Academy of Sciences Fellowship for Young International Scientists (2011Y1SA09 to A.C.); and National Natural Science Foundation of China (31150110466 to A.C.).
Conflict of Interest: none declared.
REFERENCES
- Abdelkrim J, et al. Fast, cost-effective development of species-specific microsatellite markers by genomic sequencing. BioTechniques. 2009;46:185–192. doi: 10.2144/000113084. [DOI] [PubMed] [Google Scholar]
- Alba M, et al. Detecting cryptically simple protein sequences using the SIMPLE algorithm. Bioinformatics. 2002;18:672–678. doi: 10.1093/bioinformatics/18.5.672. [DOI] [PubMed] [Google Scholar]
- Altschul S, et al. Basic local alignment search tool. J. Mol. Biol. 1990;215:403–410. doi: 10.1016/S0022-2836(05)80360-2. [DOI] [PubMed] [Google Scholar]
- Archak S, et al. InSatDb: a microsatellite database of fully sequenced insect genomes. Nucleic Acids Res. 2007;35:D36–D39. doi: 10.1093/nar/gkl778. [DOI] [PMC free article] [PubMed] [Google Scholar]
- Benson G. Tandem repeats finder: a program to analyze DNA sequences. Nucleic Acids Res. 1999;27:573–580. doi: 10.1093/nar/27.2.573. [DOI] [PMC free article] [PubMed] [Google Scholar]
- Bilmes J. Technical Report TR-97-021, International Computer Science Institute and Computer Science Division. U.C. Berkeley: Department of Electrical Engineering and Computer Science; 1998. A gentle tutorial of the EM algorithm and its application to parameter estimation for gaussian mixture and hidden markov models. [Google Scholar]
- Boby T, et al. TRbase: a database relating tandem repeats to disease genes for the human genome. Bioinformatics. 2005;21:811–816. doi: 10.1093/bioinformatics/bti059. [DOI] [PubMed] [Google Scholar]
- Boeva V, et al. Short fuzzy tandem repeats in genomic sequences, identification, and possible role in regulation of gene expression. Bioinformatics. 2006;22:676–684. doi: 10.1093/bioinformatics/btk032. [DOI] [PubMed] [Google Scholar]
- Buschiazzo E, Gemmell N. The rise, fall and renaissance of microsatellites in eukaryotic genomes. Bioessays. 2006;28:1040–1050. doi: 10.1002/bies.20470. [DOI] [PubMed] [Google Scholar]
- Carracedo A, Sánchez-Diz P. Forensic DNA-typing technologies: a review. Methods Mol. Biol. 2004;297:1–11. doi: 10.1385/1-59259-867-6:001. [DOI] [PubMed] [Google Scholar]
- Castelo A, et al. TROLL-tandem repeat occurrence locator. Bioinformatics. 2002;18:634–636. doi: 10.1093/bioinformatics/18.4.634. [DOI] [PubMed] [Google Scholar]
- Cooper G, et al. An empirical exploration of the (Δμ)2 genetic distance for 213 human microsatellite markers. Am. J. Hum. Genet. 1999;65:1125–1133. doi: 10.1086/302574. [DOI] [PMC free article] [PubMed] [Google Scholar]
- Delgrange O, Rivals E. STAR: an algorithm to Search for Tandem Approximate Repeats. Bioinformatics. 2004;20:2812–2820. doi: 10.1093/bioinformatics/bth335. [DOI] [PubMed] [Google Scholar]
- Dutta S, et al. Development of genic-SSR markers by deep transcriptome sequencing in pigeonpea [Cajanus cajan (L.) Millspaugh] BMC Plant Biol. 2011;11:17. doi: 10.1186/1471-2229-11-17. [DOI] [PMC free article] [PubMed] [Google Scholar]
- Edgar R. MUSCLE: a multiple sequence alignment method with reduced time and space complexity. BMC Bioinformatics. 2004;5:113. doi: 10.1186/1471-2105-5-113. [DOI] [PMC free article] [PubMed] [Google Scholar]
- Edgar R. MUSCLE: multiple sequence alignment with high accuracy and high throughput. Nucleic Acids Res. 2004;32:1792–1797. doi: 10.1093/nar/gkh340. [DOI] [PMC free article] [PubMed] [Google Scholar]
- Ellegren H. Microsatellites: simple sequences with complex evolution. Nat. Rev. Genet. 2004;5:435–445. doi: 10.1038/nrg1348. [DOI] [PubMed] [Google Scholar]
- Faircloth B. MSATCOMMANDER: detection of microsatellite repeat arrays and automated, locus-specific primer design. Mol. Ecol. Resour. 2008;8:92–94. doi: 10.1111/j.1471-8286.2007.01884.x. [DOI] [PubMed] [Google Scholar]
- Gelfand Y, et al. TRDB–the tandem repeats database. Nucleic Acids Res. 2007;35:D80–D87. doi: 10.1093/nar/gkl1013. [DOI] [PMC free article] [PubMed] [Google Scholar]
- Glenn T, Schable N. Isolating microsatellite DNA loci. Methods Enzymol. 2005;395:202–222. doi: 10.1016/S0076-6879(05)95013-1. [DOI] [PubMed] [Google Scholar]
- Hancock J, Armstrong J. SIMPLE34: an improved and enhanced implementation for VAX and Sun computers of the SIMPLE algorithm for analysis of clustered repetitive motifs in nucleotide sequences. Comp. Appl. Biosci. 1994;10:67–70. doi: 10.1093/bioinformatics/10.1.67. [DOI] [PubMed] [Google Scholar]
- Kent W, et al. The human genome browser at UCSC. Genome Res. 2002;12:996–1006. doi: 10.1101/gr.229102. [DOI] [PMC free article] [PubMed] [Google Scholar]
- Kofler R, et al. SciRoKo: a new tool for whole genome microsatellite search and investigation. Bioinformatics. 2007;23:1683–1685. doi: 10.1093/bioinformatics/btm157. [DOI] [PubMed] [Google Scholar]
- Kolpakov R, et al. mreps: efficient and flexible detection of tandem repeats in DNA. Nucleic Acids Res. 2003;31:3672–3678. doi: 10.1093/nar/gkg617. [DOI] [PMC free article] [PubMed] [Google Scholar]
- Levenshtein V. Binary codes capable of correcting deletions, insertions, and reversals. Soviet Phys. Doklady. 1966;10:707–710. [Google Scholar]
- Luikart G, et al. The power and promise of population genomics: from genotyping to genome typing. Nat. Rev. Genet. 2003;4:981–994. doi: 10.1038/nrg1226. [DOI] [PubMed] [Google Scholar]
- Meglécz E, et al. QDD: a user-friendly program to select microsatellite markers and design primers from large sequencing projects. Bioinformatics. 2010;26:403–404. doi: 10.1093/bioinformatics/btp670. [DOI] [PubMed] [Google Scholar]
- Menotti-Raymond M, et al. An STR forensic typing system for genetic individualization of domestic cat (Felis catus) samples. J. Foren. Sci. 2005;50:1061–1070. [PubMed] [Google Scholar]
- Mudunuri S, Nagarajaram H. IMEx: imperfect microsatellite extractor. Bioinformatics. 2007;23:1181–1187. doi: 10.1093/bioinformatics/btm097. [DOI] [PubMed] [Google Scholar]
- O’Dushlaine C, et al. Tandem repeat copy-number variation in protein-coding regions of human genes. Genome Biol. 2005;6:R69. doi: 10.1186/gb-2005-6-8-r69. [DOI] [PMC free article] [PubMed] [Google Scholar]
- Palo J, et al. Developing microsatellite markers for insect population structure: complex variation in a checkerspot butterfly. Hereditas. 1995;123:295–300. doi: 10.1111/j.1601-5223.1995.00295.x. [DOI] [PubMed] [Google Scholar]
- Pellegrini M, et al. TRStalker: an efficient heuristic for finding fuzzy tandem repeats. Bioinformatics. 2010;26:i358–i366. doi: 10.1093/bioinformatics/btq209. [DOI] [PMC free article] [PubMed] [Google Scholar]
- Perlin M, et al. Toward fully automated genotyping: Genotyping microsatellite markers by deconvolution. Am. J. Hum. Genet. 1995;57:1199–1210. [PMC free article] [PubMed] [Google Scholar]
- Petenian F, et al. Isolation and characterization of polymorphic microsatellites in Parnassius apollo and Euphydryas aurinia (Lepidoptera) Mol. Ecol. Notes. 2005;5:243–245. [Google Scholar]
- Quince C, et al. Accurate determination of microbial diversity from 454 pyrosequencing data. Nat. Methods. 2009;6:639–641. doi: 10.1038/nmeth.1361. [DOI] [PubMed] [Google Scholar]
- Quince C, et al. Removing noise from pyrosequenced amplicons. BMC Bioinformatics. 2011;12:38. doi: 10.1186/1471-2105-12-38. [DOI] [PMC free article] [PubMed] [Google Scholar]
- Rozen S, Skaletsky H. Primer3 on the WWW for general users and for biologist programmers. Methods Mol. Biol. 2000;132:365–386. doi: 10.1385/1-59259-192-2:365. [DOI] [PubMed] [Google Scholar]
- Saarinen E, Austin J. When technology meets conservation: increased microsatellite marker production using 454 genome sequencing on the endangered Okaloosa darter (Etheostoma okaloosae) J. Heredity. 2010;101:784–788. doi: 10.1093/jhered/esq080. [DOI] [PubMed] [Google Scholar]
- Santana Q, et al. Microsatellite discovery by deep sequencing of enriched genomic libraries. Biotechniques. 2009;46:217–223. doi: 10.2144/000113085. [DOI] [PubMed] [Google Scholar]
- Sarhan A. Isolation and characterization of five microsatellite loci in the glanville fritillary butterfly (Melitaea cinxia) Mol. Ecol. Notes. 2006;6:163–164. [Google Scholar]
- Temnykh S, et al. Computational and experimental analysis of microsatellites in rice (Oryza sativa L.): Frequency, length variation, transposon associations, and genetic marker potential. Genome Res. 2001;11:1441–1452. doi: 10.1101/gr.184001. [DOI] [PMC free article] [PubMed] [Google Scholar]
- Thiel T, et al. Exploiting EST databases for the development and characterization of gene-derived SSR-markers in barley (Hordeum vulgare L.) Theor. Appl. Genet. 2003;106:411–422. doi: 10.1007/s00122-002-1031-0. [DOI] [PubMed] [Google Scholar]
- Vant Hof A, et al. Evolutionary dynamics of multilocus microsatellite arrangements in the genome of the butterfly Bicyclus anynana, with implications for other Lepidoptera. Heredity. 2007;98:320–328. doi: 10.1038/sj.hdy.6800944. [DOI] [PubMed] [Google Scholar]
- Viterbi A. Error bounds for convolutional codes and an asymptotically optimum decoding algorithm. IEEE Trans. Inform. Theory. 1967;13:260–269. [Google Scholar]
- Wexler Y, et al. Finding approximate tandem repeats in genomic sequences. J. Comput. Biol. 2005;12:928–942. doi: 10.1089/cmb.2005.12.928. [DOI] [PubMed] [Google Scholar]
- You F, et al. BatchPrimer3: a high throughput web application for PCR and sequencing primer design. BMC Bioinformatics. 2008;9:253. doi: 10.1186/1471-2105-9-253. [DOI] [PMC free article] [PubMed] [Google Scholar]
- Zane L, et al. Strategies for microsatellite isolation: a review. Mol. Ecol. 2002;11:1–16. doi: 10.1046/j.0962-1083.2001.01418.x. [DOI] [PubMed] [Google Scholar]
- Zhivotovsky L, Feldman M. Microsatellite variability and genetic distances. Proc. Natl. Acad. Sci. 1995;92:11549–11552. doi: 10.1073/pnas.92.25.11549. [DOI] [PMC free article] [PubMed] [Google Scholar]
Associated Data
This section collects any data citations, data availability statements, or supplementary materials included in this article.