

Abstract
OBJECTIVE
Quantitative assessment of small fiber damage is key to the early diagnosis and assessment of progression or regression of diabetic sensorimotor polyneuropathy (DSPN). Intraepidermal nerve fiber density (IENFD) is the current gold standard, but corneal confocal microscopy (CCM), an in vivo ophthalmic imaging modality, has the potential to be a noninvasive and objective image biomarker for identifying small fiber damage. The purpose of this study was to determine the diagnostic performance of CCM and IENFD by using the current guidelines as the reference standard.
RESEARCH DESIGN AND METHODS
Eighty-nine subjects (26 control subjects and 63 patients with type 1 diabetes), with and without DSPN, underwent a detailed assessment of neuropathy, including CCM and skin biopsy.
RESULTS
Manual and automated corneal nerve fiber density (CNFD) (P < 0.0001), branch density (CNBD) (P < 0.0001) and length (CNFL) (P < 0.0001), and IENFD (P < 0.001) were significantly reduced in patients with diabetes with DSPN compared with control subjects. The area under the receiver operating characteristic curve for identifying DSPN was 0.82 for manual CNFD, 0.80 for automated CNFD, and 0.66 for IENFD, which did not differ significantly (P = 0.14).
CONCLUSIONS
This study shows comparable diagnostic efficiency between CCM and IENFD, providing further support for the clinical utility of CCM as a surrogate end point for DSPN.
Introduction
Diabetic sensorimotor polyneuropathy (DSPN) is one of most common long-term complications of diabetes. Up to 50% of patients with diabetes suffer from DSPN, and an estimated one in five patients with diabetes have chronic painful neuropathy (1). Accurate detection and assessment of neuropathy would have a major medical, social, and economic effect in relation to earlier diagnosis and timely intervention to prevent progression and the difficulties with end points used in clinical trials of DSPN (2) to address the major unmet need of a treatment for this condition (3,4).
Methods to quantify neuropathy include clinical scores based on symptoms and neurological tests, quantitative sensory testing (QST), electrophysiological measurements, in the form of nerve conduction studies (NCS), and intraepidermal nerve fiber density (IENFD) in skin biopsy specimens (5). The neurological examination involves an assessment, such as the modified Neuropathy Disability Score (NDS) (6), a composite score that assesses touch, temperature, and vibration perception and reflexes, which requires expert clinical judgment, a strong element of subjectivity, and hence, poor reproducibility (7). Neurophysiology is objective and reproducible and is currently considered to be the most reliable measurement for confirming the diagnosis of diabetic neuropathy and indeed represents an essential part of the Toronto Criteria (TC) to identify those with “confirmed DSPN: the presence of an abnormality of NC[S] and a symptom or symptoms or a sign or signs of neuropathy” (8). However, these measures mainly assess large nerve fibers, making them less sensitive to early DSPN, which is more likely to involve small fibers (9,10).
Small fibers can be assessed by quantifying thermal thresholds (11) and IENFD in skin biopsy specimens (12). Although QST assessment has been shown to have good repeatability (11), IENFD is considered to be the most objective and quantitative for the diagnosis of small fiber neuropathy (13,14). However, its invasive nature makes it unsuitable for repeated investigations (12). Furthermore, the reliability of IENFD for the diagnosis of DSPN has never been thoroughly validated in a large cohort of patients with diabetes (15). Thus diabetic neuropathy currently lacks a noninvasive surrogate for accurately detecting small nerve fiber damage and repair.
Several studies (16–20) have shown that corneal confocal microscopy (CCM) is capable of making a quantitative assessment of small fiber damage and has the potential to be a surrogate end point for DSPN (9). Quantitative analysis using manual annotation of CCM images to identify fibers and branches is labor-intensive and subjective. However, a fully automated nerve fiber quantification method has been shown to have high correlation with the manually obtained measurements (21,22), and our recent study (23) compared manual and automated image analysis in a large cohort of patients with diabetes. We previously assessed CCM and IENFD in the same patients and showed that the measures were related (17). However, to date there has been no attempt to directly compare the ability of CCM and IENFD in the diagnosis of DSPN. In this report, we comprehensively evaluate manually and automatically quantified CCM-derived measures of nerve fiber morphology and compare their diagnostic performance with IENFD measurements according to the presence or absence of DSPN using the TC.
Research Design and Methods
Study Subjects
The study recruited 63 patients with type 1 diabetes from clinics of the Manchester Diabetes Center, Manchester Royal Infirmary, and age-matched control subjects from the community. The updated TC was used to assess all subjects for the presence and severity of DSPN between 2010 and 2011 (8). This research adhered to the tenets of the Declaration of Helsinki and was approved by the North Manchester Research Ethics Committee. Informed written consent was obtained from all participants before their enrollment in the study. All assessments were performed by trained staff in a purpose-designed clinical research facility in central Manchester. Inclusion criteria were age between 14 and 85 years and a history of type 1 diabetes. Exclusion criteria were a positive history of malignancy, connective tissue or infectious disease, deficiency of vitamin B12 or folate, chronic renal failure, liver failure, active diabetic foot ulceration, family history of peripheral neuropathy, active ocular disease, systemic disease known to affect the cornea other than diabetes, or chronic corneal pathologies. All participants underwent assessment of glycated hemoglobin (HbA1c), HDL and LDL cholesterol, triglycerides, BMI, and renal status (estimated glomerular filtration rate and albumin-to-creatinine ratio). Participants in this study represent a subcohort of participants with type 1 diabetes (n = 110) and control subjects (n = 97) who agreed to undergo skin biopsy in addition to routine neurological testing.
Peripheral Neuropathy Assessment
All study participants underwent an assessment of neurological deficits (NDS) (6) and symptoms (Diabetic Neuropathy Symptom [DNS] score) (24). Vibration perception threshold (VPT) was tested using a Horwell Neurothesiometer (Scientific Laboratory Supplies, Nottingham, U.K.). Cold thresholds (CT) and warm thresholds (WT) were established on the dorsolateral aspect of the left foot (S1) using the TSA-II NeuroSensory Analyzer (Medoc Ltd., Ramat-Yishai, Israel). Electrodiagnostic studies were undertaken using a Dantec Keypoint system (Dantec Dynamics Ltd., Bristol, U.K.) equipped with a DISA temperature regulator to keep limb temperature constantly between 32° and 35°C. Sural sensory nerve amplitude (SSNamp), sural sensory nerve conduction velocity (SSNCV), peroneal motor nerve amplitude (PMNamp), and peroneal motor nerve conduction velocity (PMNCV) were assessed by a consultant neurophysiologist.
The Toronto Diabetic Neuropathy Expert Group (8) recommendation was followed to define an individual as having neuropathy if he or she met both of the following criteria: 1) abnormal nerve conduction—a PMNCV of <42 m/s; 2) a symptom or sign of neuropathy, defined as one of the following: a) DNS of 1 or more of 4, or b) NDS of 3 or more of 10.
For the IENFD assessment, a 3-mm punch skin biopsy specimen was obtained from the dorsum of the foot, and a bright-field immunohistochemistry protocol was used according to published guidelines (12). Linear IENFD (number of fibers/mm) was established in at least four sections of 50-μm thickness according to published counting rules (IENFD have to cross or originate at the dermal–epidermal junction, and secondary branches and fragments are not counted) (14). The assessments were performed by two experts (M.J. and R.A.M.) who were masked to the neuropathic/diabetes status of participants and were cross-validated.
Manual and Automated Quantification of Corneal Nerves
CCM images (Fig. 1A) were captured from all participants using the Heidelberg Retina Tomograph Rostock Cornea Module (HRT-III), as described (23,25), by two purpose-trained optometrists (I.N.P. and M.T.). Their dimensions are 384 × 384 pixels with the pixel size of 1.0417 μm. During a bilateral CCM scan, more than 100 images per patient were typically captured from all corneal layers, and 6 subbasal images from the right and left eyes were selected for analysis. Criteria for image selection were depth, focus position, and contrast. One experienced examiner (I.N.P.), masked from the outcome of the medical and peripheral neuropathy assessment, manually quantified 1,506 images of all study participants using purpose-written, proprietary software (CCMetrics, M.A. Dabbah, Imaging Science, University of Manchester) (Fig. 1B). The specific parameters measured per frame were corneal nerve fiber density (CNFD) (number of main fibers per mm2), corneal nerve fiber length (CNFL) (total length of main fibers and branches per mm2), and corneal nerve branch density (CNBD) (number of branches per mm2) in accordance with our previously published protocol (23,25).
Figure 1.

A: Original CCM image. B: Manually quantified CCM image. C: Automatically quantified CCM image. The red lines represent main nerve fibers, blue lines are branches, and green spots indicate branch points on the main nerve trunks. CCM images of the subbasal nerve plexus from a control subject (D), a DSPN(−) patient with type 1 diabetes (E), and a DSPN(+) patient with type 1 diabetes (F) show the reduction in corneal nerves in the DSPN(+) patient. The red arrows indicate main nerve fibers (to calculate CNFD), and yellow arrows indicate branch fibers (to calculate CNBD). Box plots of IENFD (G), manual CNFD values (H), automated CNFD (I), and automated CNFL (J) values in controls and in DSPN(−) and DSPN(+) patients with type 1 diabetes based on the TC. K: ROC curves for manual CNFD (MCNFD), automated CNFD (ACNFD), and IENFD to discriminate DSPN(+) and DSPN(−) patients with diabetes. G–J: Red lines represent median, the box borders 25th and 75th percentile. Whiskers represent the range of the data (without outliers). Red plus symbols represent outliers.
Automated corneal nerve fiber quantification consists of two steps: 1) CCM image enhancement and nerve fiber detection and 2) quantification of the three morphometric parameters. As described in our earlier work (21), a dual-model feature descriptor combined with a neural network classifier was used to train the detection software to distinguish nerve fibers from the background (noise and underlying connective tissue). In the nerve fiber quantification process, all of the end points and branch points of the detected nerve fibers are extracted and used to construct a connectivity map. Each segment in the connectivity map is then connected and classified as a main nerve fiber or branch (Fig. 1C). The software for automated CCM image quantification (ACCMetrics) is available via http://www.click2go.umip.com/i/software/Biomedical_Software/accmetrics_v2.html.
To evaluate the effectiveness of using IENFD and manually and automatically generated CCM features to diagnose DSPN, we used the TC as ground truth to categorize the subjects with diabetes into those with DSPN (DSPN[+]) and without DSPN (DSPN[−]).
Statistical Analysis
Statistical analysis and the receiver operating characteristic (ROC) curves were performed and generated using MATLAB R2012a software (The MathWorks, Inc.). One-way ANOVA (nonparametric Kruskal-Wallis) was used to evaluate within- and between-group differences (control group, the DSPN[+] group, and the DSPN[−] group). A P < 0.05 was considered significant. The area under the ROC curve (AUC) values, 95% CIs, and sensitivity and specificity at the equal error-rate point and at the threshold of 2 standard deviations below the mean of the control group were calculated for comparison. MedCalc 14.12.0 software (MedCalc Software bvba) was used to compare the difference between two ROC curves. The power analysis was performed using G*Power 3.1.9.2 software. The power analysis was performed based on the Wilcoxon-Mann-Whitney test comparing the group with type 1 diabetes and the control group. For PMNCV, the power was 0.999 (assuming an error rate α = 0.01), indicating that 26 control subjects and 63 patients with type 1 diabetes were sufficient to find a statistically significant difference. Then the power analysis was performed based on the Wilcoxon-Mann-Whitney test comparing DSPN(−) and DSPN(+) groups. For PMNCV, the power was 0.999 (assuming an error rate α = 0.01), indicating that a sample size of 46 DSPN(−) and 17 DSPN(+) was sufficient to find a statistically significant difference.
Results
Demographics, Metabolic, and Anthropometric Assessment
The demographics and metabolic and anthropometric measurements in patients with diabetes and control subjects are summarized in Table 1. In the patients with type 1 diabetes, 57% were on a multiple daily insulin injection regimen, and 43% were on continuous subcutaneous insulin infusion. Other medications included an ACE inhibitor or angiotensin receptor blocker in 36% of subjects and statins in 71%. Age was comparable between control subjects and patients with diabetes. HbA1c was significantly higher in patients with diabetes than in control subjects, with no difference between DSPN(+) and DSPN(−) patients. BMI was significantly higher in DSPN(+) patients with diabetes compared with control subjects. Total cholesterol was significantly lower in DSPN(+) and DSPN(−) patients with diabetes, whereas HDL and triglycerides did not differ between the groups. Systolic blood pressure was significantly higher in DSPN(+) and DSPN(−) patients with diabetes compared with control subjects, whereas diastolic blood pressure did not differ between groups.
Table 1.
Clinical demographic results and neuropathy assessment in control subjects and in DSPN(−) and DSPN(+) patients with type 1 diabetes
| Variable | Control subjects (n = 26) | DSPN(−) (n = 46) | DSPN(+) (n = 17) |
|---|---|---|---|
| Age, years | 44 ± 15 | 44 ± 13 | 59 ± 11 |
| Duration of diabetes, years | N/A | 23 ± 15 | 39 ± 14 |
| HbA1c (%)‡ | 5.5 ± 0.3 | 8.2 ± 1.4 | 8.5 ± 1.3 |
| HbA1c (mmol/mol)‡ | 37.1 ± 3.5 | 62.2 ± 24.1¶ | 69.3 ± 14.3¶ |
| BMI (kg/m2)* | 26.8 ± 4.0 | 26.4 ± 4.5 | 27.5 ± 3.5¶ |
| Cholesterol (mmol/L) | |||
| Total* | 5.0 ± 0.8 | 4.4 ± 0.9¶ | 4.3 ± 0.9¶ |
| HDL | 1.5 ± 0.3 | 1.6 ± 0.5 | 1.6 ± 0.4 |
| Triglycerides (mmol/L) | 1.4 ± 0.7 | 1.2 ± 0.7 | 1.3 ± 0.6 |
| Blood pressure (mmHg) | |||
| Systolic† | 126.7 ± 16.3 | 130.3 ± 17.8¶ | 141.1 ± 25.2¶§ |
| Diastolic | 70.2 ± 9.1 | 71.6 ± 9.6 | 73.0 ± 9.8 |
| VPT (V)‡ | 6.0 ± 5.5 | 7.6 ± 5.5 | 25.2 ± 13.4¶§ |
| WT (°C)† | 36.4 ± 2.0 | 38.7 ± 3.6¶ | 43.5 ± 4.6¶§ |
| CT (°C)† | 28.8 ± 1.6 | 27.1 ± 2.7¶ | 16.8 ± 10.6¶§ |
| PMNCV (m/s)‡ | 49.1 ± 3.4 | 43.9 ± 3.1¶ | 31.0 ± 9.5¶§ |
| SSNCV (m/s)‡ | 50.9 ± 3.9 | 45.3 ± 5.2¶ | 37.8 ± 6.8¶§ |
| PMNamp (μV)‡ | 6.0 ± 2.4 | 6.0 ± 8.3 | 1.6 ± 1.6¶§ |
| SSNamp (μV)‡ | 19.7 ± 8.3 | 12.5 ± 6.9¶ | 4.3 ± 3.5¶§ |
| IENFD¿ | 9.8 ± 3.7 | 7.0 ± 5.0¶ | 5.0 ± 5.5¶§ |
| Manual | |||
| CNFD‡ | 36.8 ± 5.3 | 28.3 ± 7.2¶ | 16.9 ± 10.1¶§ |
| CNBD* | 92.8 ± 36.4 | 56.1 ± 30.3¶ | 48.2 ± 32.9¶ |
| CNFL‡ | 26.7 ± 3.7 | 20.2 ± 5.1¶ | 14.8 ± 8.3¶§ |
| Automated | |||
| CNFD‡ | 31.3 ± 6.5 | 22.6 ± 7.3¶ | 13.5 ± 9.1¶§ |
| CNBD‡ | 44.6 ± 17.2 | 26.2 ± 15.1¶ | 15.4 ± 12.1¶§ |
| CNFL‡ | 17.7 ± 2.8 | 13.4 ± 3.3¶ | 8.8 ± 4.7¶§ |
Results are expressed as mean ± SD.
N/A, not applicable for this group.
Statistically significant differences using ANOVA/Kruskal-Wallis:
*P < 0.05;
¿P < 0.01;
†P < 0.001;
‡P < 0.0001.
Post hoc results for DSPN(+) significantly different from
¶control subjects and
§DSPN(−).
Neurological Assessment
The NDS differed significantly between DSPN(+) patients and control subjects (Table 1).
QST
VPT was significantly greater in DSPN(+) patients compared with control subjects and DSPN(−) patients (Table 1). CT and WT both differed significantly in DSPN(+) and DSPN(−) patients with diabetes compared with control subjects.
Electrophysiology
PMNCV, SSNCV, and SSNamp were significantly reduced in DSPN(−) patients with diabetes compared with control subjects (Table 1). PMNCV, SSNCV, PMNamp, and SSNamp were all reduced in DSPN(+) patients with diabetes compared with control subjects and DSPN(−) patients with diabetes.
IENFD
IENFD was significantly reduced in DSPN(+) patients (P = 0.002) and in DSPN(−) patients (P = 0.001), and was further reduced in DSPN(+) compared with DSPN(−) patients (P = 0.05) (Table 1 and Fig. 1G and Fig. 2). The median value of the control group was 9.35 and the 0.05 quantile was 4.31, which is consistent with previously published IENFD measurements (12).
Figure 2.
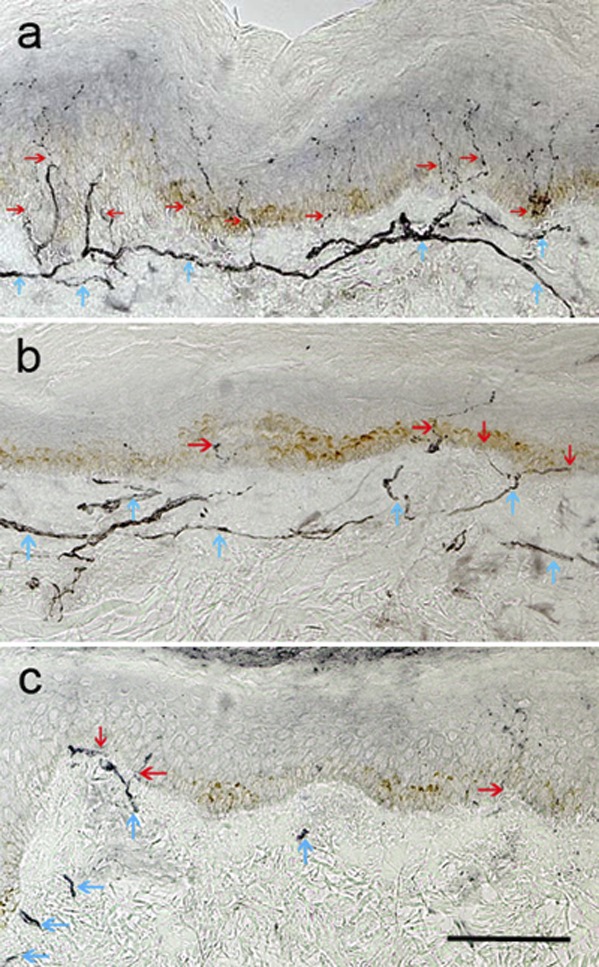
Skin biopsy specimens immunostained for neuronal marker PGP 9.5 from a healthy subject (A), a DSPN(−) patient with type 1 diabetes (B), and a DSPN(+) patient with type 1 diabetes (C). Note the depletion of IENFD (red arrows) and reduction of subepidermal nerve plexus (blue arrows) in B and C, with both features more severe in the DSPN(+) patient (C). Original magnification ×200, scale bar = 100 µm.
CCM
Manual CNFD was significantly reduced in DSPN(+) patients (P < 0.0001) and in DSPN(−) patients (P < 0.0001) compared with control subjects and was further reduced in DSPN(+) patients compared with DSPN(−) patients (P < 0.0001) (Table 1 and Fig. 1H). Manual CNBD was significantly reduced in DSPN(+) patients (P < 0.0001) but not in DSPN(−) patients (P = 0.09) compared with control subjects. Manual CNFL was significantly reduced in DSPN(+) patients (P < 0.0001) and in DSPN(−) patients (P < 0.0001) compared with control subjects and was further reduced in DSPN(+) patients compared with DSPN(−) patients (P = 0.001). Automated CNFD was significantly reduced in DSPN(+) patients (P < 0.0001) and DSPN(−) patients (P < 0.0001) compared with control subjects and was further reduced in DSPN(+) patients compared with DSPN(−) patients (P < 0.0001) (Fig. 1I). Automated CNBD was significantly reduced in DSPN(+) patients (P < 0.0001) and DSPN(−) patients (P < 0.0001) compared with control subjects and was further reduced in DSPN(+) patients compared with DSPN(−) patients (P = 0.002). Automated CNFL was significantly reduced in DSPN(+) patients (P < 0.0001) and DSPN(−) patients (P < 0.0001) compared with control subjects and was further reduced in DSPN(+) patients compared with DSPN(−) patients (P < 0.0001) (Fig. 1J).
ROC Analysis
The patients with diabetes were categorized into DSPN(−) (n = 46) and DSPN(+) (n = 17). Table 2 reports the AUC values, 95% CIs, and sensitivity/specificity at the equal error-rate point on the ROC curve for manual and automated CCM features as well as IENFD values. The highest AUC values among the manual and automated CCM measures were obtained for CNFD, with AUC values of 0.82 and 0.80, respectively. Almost all individual CCM measurements resulted in higher AUC values than IENFD (0.66). Furthermore, sensitivity and specificity values were calculated at the equal error-rate point for the purpose of consistency. For this measure of diagnostic performance also, CNFD provided the best discrimination (76% for manual measurement and 70% for automated measurement), which exceeded the 65% achieved by IENFD.
Table 2.
AUC, 95% CI values, and sensitivity-specificity for manual and automated CCM and IENFD for the diagnosis of DSPN
| AUC | 95% CI | Sensitivity-specificity at equal-error rate | Sensitivity/specificity at mean ± 2 SD (threshold) | |
|---|---|---|---|---|
| Manual |
||||
| CNFD | 0.82 | 0.68–0.95 | 0.76 | 0.82/0.71 (24.0) |
| CNFL | 0.70 | 0.54–0.85 | 0.71 | 0.59/0.74 (16.5) |
| CNBD | 0.59 | 0.43–0.75 | 0.53 | 0.17/0.96 (15.0) |
| Automated | ||||
| CNFD | 0.80 | 0.66–0.93 | 0.70 | 0.60/0.83 (15.5) |
| CNFL | 0.77 | 0.63–0.91 | 0.70 | 0.59/0.80 (10.5) |
| CNBD | 0.70 | 0.55–0.86 | 0.59 | 0.29/0.98 (4.0) |
| IENFD | 0.66 | 0.50–0.82 | 0.65 | 0.53/0.76 (3.3) |
In using IENFD to identify DSPN, a decision threshold for neuropathy is commonly set at 2 standard deviations below the mean of the control group. Table 2 also reports the sensitivity/specificity values obtained by applying this threshold. When this threshold was used, manual CNFD and automated CNFD result in better sensitivity/specificity than IENFD: 0.82/0.71, 0.60/0.83, and 0.53/0.76, respectively. There were no statistically significant differences between the ROC curves for manual CNFD and IENFD (P = 0.14) and for automated CNFD and IENFD (P = 0.19) (26). However, CCM measurements show considerably less variability within the subject groups than IENFD measurements (Fig. 1G) and larger AUC values (Fig. 1K).
Conclusions
There is a need for surrogate end points of diabetic neuropathy that accurately detect early disease, quantify disease progression, and measure therapeutic response (2). The current gold standard for the diagnosis of neuropathy, neurophysiology, is a robust measure but has poor reproducibility (27). Other measures of neuropathy, such as symptoms and signs, are also poorly reproducible (7), and although QST is reproducible, it is subjective (11).
Small fiber neuropathy has direct pathophysiological relevance to the main outcomes of pain and foot ulceration. Skin biopsy assessment of IENFD has been proposed as a valid measure of diabetic neuropathy (15). Furthermore, skin biopsy detects early small nerve fiber damage even when results of electrophysiology and QST are still within normal ranges (28,29), suggesting that it could detect early neuropathy. It has been shown to be abnormal in subjects with IGT (19) and in recently diagnosed patients with type 2 diabetes (30). IENFD has also been shown to increase with an improvement in metabolic risk factors in subjects with IGT (31) but not after combined pancreas and kidney transplantation in patients with type 1 diabetes (20). Furthermore, the invasive nature of this technique limits its practical use as a diagnostic test and particularly when a repeat biopsy is required in longitudinal studies or clinical intervention trials.
CCM is a novel, rapid, and readily reiterative technique that quantifies small nerve fibers noninvasively and shows promise as a surrogate end point for neuropathy (9,18,30,32–34). A number of studies have shown the nerve fiber features extracted from CCM are associated with the severity of diabetic peripheral neuropathy (17,23,33).
Because IENFD represents a measure of the most distal nerve fibers, which are affected in DSPN, a natural assumption is that it should have a better diagnostic ability than CCM. However, a comparison between IENFD and CCM features for the individual diagnosis of DSPN has not been reported to date. In this report, we present a comparison of nerve fiber features, quantified manually or automatically from CCM images (CNFL, CNFD, and CNBD) with IENFD measurement in identifying DSPN in individuals. CCM and IENFD are comparable in their diagnostic performance for detecting patients with diabetic neuropathy. Neither technique appears to have an optimal diagnostic performance. However, there were relatively small numbers of patients in the study because a significant proportion were not willing to undergo biopsy. Furthermore, the diagnosis of DSPN does not incorporate a measure of small fiber damage, which limits the assessment of the diagnostic performance of these small fiber tests. The added advantage of CCM compared with IENFD assessment is the more rapid and noninvasive acquisition of images and automated corneal nerve image analysis allowing rapid and consistent quantification (22,23,35). The exception is the manually measured CNBD, which has been found previously (25) to be unreliable due to the subjective judgment required in identifying branches. The algorithmic definition of branches in the automated measurement results in greater consistency, although this is the least useful individual automated CCM measurement. CCM and IENFD both seek to measure small fibers, but IENFD showed a poorer discrimination between DSPN(+) and DSPN(−) patients. Furthermore, CCM measurements show considerably less variability within the subject groups than IENFD measurements. Interestingly, very low IENFD values were observed, even in control subjects.
This study has strengths and limitations. Strengths include the study design and techniques used to assess neuropathy. This is the first study to report the clinical utility of two highly sensitive techniques, CCM and skin biopsy, in the same group of patients with type 1 diabetes and control subjects. Thus, CCM appears to be an emerging surrogate end point of diabetic neuropathy that shows comparable performance to the current gold standard of IENFD.
The limitations of the current study are the relatively small number of patients with established neuropathy and the use of the more distal site for the biopsy, which makes comparison of the IENFD results with other studies difficult. Furthermore, these data are only applicable to Caucasian patients with type 1 diabetes and need to be confirmed in nondiabetic neuropathies.
In conclusion, we show that the diagnostic efficiency of CCM is comparable to IENFD. However, CCM may be preferred due to its rapid, noninvasive, automated and, hence, unbiased means of quantifying small nerve fiber damage and repair in DSPN(+) patients.
Article Information
Acknowledgments. This research was facilitated by the Manchester Biomedical Research Centre and the Greater Manchester Comprehensive Local Research Network.
Funding. This research was funded by awards from the National Institutes of Healthhttp://dx.doi.org/10.13039/100000002 (R01-DK-077903-0101) and JDRFhttp://dx.doi.org/10.13039/100000901 (27-2008-362).
Duality of Interest. No potential conflicts of interest relevant to this article were reported.
Author Contributions. X.C. developed the automated CCM software, performed statistical analysis, and wrote the manuscript. J.G. contributed to manual and automated software development and reviewed and edited the manuscript. M.A.D. developed the manual and automated CCM software. I.N.P. generated the CCM data and performed the CCM data analysis. G.P. researched data and coordinated patient assessment. O.A., A.M., H.F., and S.A. researched data. U.A. recruited patients and researched data. M.F. and M.T. generated the CCM data. N.E. designed the study and reviewed and edited the manuscript. M.J. generated IENFD data and reviewed and edited the manuscript. R.A.M. designed and oversaw the study, generated IENFD data, and reviewed and edited the manuscript. R.A.M. is the guarantor of this work and, as such, had full access to all the data in the study and takes responsibility for the integrity of the data and the accuracy of the data analysis.
References
- 1.Abbott CA, Malik RA, van Ross ER, Kulkarni J, Boulton AJ. Prevalence and characteristics of painful diabetic neuropathy in a large community-based diabetic population in the U.K. Diabetes Care 2011;34:2220–2224 [DOI] [PMC free article] [PubMed] [Google Scholar]
- 2.Dyck PJ, Norell JE, Tritschler H, et al. Challenges in design of multicenter trials: end points assessed longitudinally for change and monotonicity. Diabetes Care 2007;30:2619–2625 [DOI] [PubMed] [Google Scholar]
- 3.Malik RA. Why are there no good treatments for diabetic neuropathy? Lancet Diabetes Endocrinol 2014;2:607–609 [DOI] [PubMed] [Google Scholar]
- 4.Boulton AJ, Kempler P, Ametov A, Ziegler D. Whither pathogenetic treatments for diabetic polyneuropathy? Diabetes Metab Res Rev 2013;29:327–333 [DOI] [PubMed] [Google Scholar]
- 5.Dyck PJ, Herrmann DN, Staff NP, Dyck PJ. Assessing decreased sensation and increased sensory phenomena in diabetic polyneuropathies. Diabetes 2013;62:3677–3686 [DOI] [PMC free article] [PubMed] [Google Scholar]
- 6.Young MJ, Boulton AJ, MacLeod AF, Williams DR, Sonksen PH. A multicentre study of the prevalence of diabetic peripheral neuropathy in the United Kingdom hospital clinic population. Diabetologia 1993;36:150–154 [DOI] [PubMed] [Google Scholar]
- 7.Dyck PJ, Overland CJ, Low PA, et al.; Cl vs. NPhys Trial Investigators . Signs and symptoms versus nerve conduction studies to diagnose diabetic sensorimotor polyneuropathy: Cl vs. NPhys trial. Muscle Nerve 2010;42:157–164 [DOI] [PMC free article] [PubMed] [Google Scholar]
- 8.Tesfaye S, Boulton AJ, Dyck PJ, et al.; Toronto Diabetic Neuropathy Expert Group . Diabetic neuropathies: update on definitions, diagnostic criteria, estimation of severity, and treatments. Diabetes Care 2010;33:2285–2293 [DOI] [PMC free article] [PubMed] [Google Scholar]
- 9.Malik RA. Which test for diagnosing early human diabetic neuropathy? Diabetes 2014;63:2206–2208 [DOI] [PubMed] [Google Scholar]
- 10.Breiner A, Lovblom LE, Perkins BA, Bril V. Does the prevailing hypothesis that small-fiber dysfunction precedes large-fiber dysfunction apply to type 1 diabetic patients? Diabetes Care 2014;37:1418–1424 [DOI] [PubMed] [Google Scholar]
- 11.Dyck PJ, Argyros B, Russell JW, et al.; Members of the Cl versus NPhys Trials . Multicenter trial of the proficiency of smart quantitative sensation tests. Muscle Nerve 2014;49:645–653 [DOI] [PMC free article] [PubMed] [Google Scholar]
- 12.Lauria G, Lombardi R. Small fiber neuropathy: is skin biopsy the holy grail? Curr Diab Rep 2012;12:384–392 [DOI] [PubMed] [Google Scholar]
- 13.Hoeijmakers JG, Faber CG, Lauria G, Merkies IS, Waxman SG. Small-fibre neuropathies—advances in diagnosis, pathophysiology and management. Nat Rev Neurol 2012;8:369–379 [DOI] [PubMed] [Google Scholar]
- 14.Polydefkis M, Hauer P, Sheth S, Sirdofsky M, Griffin JW, McArthur JC. The time course of epidermal nerve fibre regeneration: studies in normal controls and in people with diabetes, with and without neuropathy. Brain 2004;127:1606–1615 [DOI] [PubMed] [Google Scholar]
- 15.Malik RA, Veves A, Tesfaye S, et al.; Toronto Consensus Panel on Diabetic Neuropathy . Small fibre neuropathy: role in the diagnosis of diabetic sensorimotor polyneuropathy. Diabetes Metab Res Rev 2011;27:678–684 [DOI] [PubMed] [Google Scholar]
- 16.Malik RA, Kallinikos P, Abbott CA, et al. Corneal confocal microscopy: a non-invasive surrogate of nerve fibre damage and repair in diabetic patients. Diabetologia 2003;46:683–688 [DOI] [PubMed] [Google Scholar]
- 17.Quattrini C, Tavakoli M, Jeziorska M, et al. Surrogate markers of small fiber damage in human diabetic neuropathy. Diabetes 2007;56:2148–2154 [DOI] [PubMed] [Google Scholar]
- 18.Pritchard N, Edwards K, Dehghani C, et al. Longitudinal Assessment of Neuropathy in type 1 Diabetes using novel ophthalmic Markers (LANDMark): study design and baseline characteristics. Diabetes Res Clin Pract 2014;104:248–256 [DOI] [PubMed] [Google Scholar]
- 19.Asghar O, Petropoulos IN, Alam U, et al. Corneal confocal microscopy detects neuropathy in subjects with impaired glucose tolerance. Diabetes Care 2014;37:2643–2646 [DOI] [PMC free article] [PubMed] [Google Scholar]
- 20.Tavakoli M, Mitu-Pretorian M, Petropoulos IN, et al. Corneal confocal microscopy detects early nerve regeneration in diabetic neuropathy after simultaneous pancreas and kidney transplantation. Diabetes 2013;62:254–260 [DOI] [PMC free article] [PubMed] [Google Scholar]
- 21.Dabbah MA, Graham J, Petropoulos I, Tavakoli M, Malik RA. Dual-model automatic detection of nerve-fibres in corneal confocal microscopy images. Med Image Comput Comput Assist Interv 2010;13:300–307 [DOI] [PMC free article] [PubMed] [Google Scholar]
- 22.Dabbah MA, Graham J, Petropoulos IN, Tavakoli M, Malik RA. Automatic analysis of diabetic peripheral neuropathy using multi-scale quantitative morphology of nerve fibres in corneal confocal microscopy imaging. Med Image Anal 2011;15:738–747 [DOI] [PubMed] [Google Scholar]
- 23.Petropoulos IN, Alam U, Fadavi H, et al. Rapid automated diagnosis of diabetic peripheral neuropathy with in vivo corneal confocal microscopy. Invest Ophthalmol Vis Sci 2014;55:2071–2078 [DOI] [PMC free article] [PubMed] [Google Scholar]
- 24.Meijer JW, Smit AJ, Sonderen EV, Groothoff JW, Eisma WH, Links TP. Symptom scoring systems to diagnose distal polyneuropathy in diabetes: the Diabetic Neuropathy Symptom score. Diabet Med 2002;19:962–965 [DOI] [PubMed] [Google Scholar]
- 25.Petropoulos IN, Manzoor T, Morgan P, et al. Repeatability of in vivo corneal confocal microscopy to quantify corneal nerve morphology. Cornea 2013;32:e83–e89 [DOI] [PubMed] [Google Scholar]
- 26.Hanley JA, McNeil BJ. The meaning and use of the area under a receiver operating characteristic (ROC) curve. Radiology 1982;143:29–36 [DOI] [PubMed] [Google Scholar]
- 27.Dyck PJ, Albers JW, Wolfe J, et al.; Clinical vs. Neurophysiology Trial 3 Investigators . A trial of proficiency of nerve conduction: greater standardization still needed. Muscle Nerve 2013;48:369–374 [DOI] [PMC free article] [PubMed] [Google Scholar]
- 28.Sumner CJ, Sheth S, Griffin JW, Cornblath DR, Polydefkis M. The spectrum of neuropathy in diabetes and impaired glucose tolerance. Neurology 2003;60:108–111 [DOI] [PubMed] [Google Scholar]
- 29.Singleton JR, Smith AG, Bromberg MB. Increased prevalence of impaired glucose tolerance in patients with painful sensory neuropathy. Diabetes Care 2001;24:1448–1453 [DOI] [PubMed] [Google Scholar]
- 30.Ziegler D, Papanas N, Zhivov A, et al.; German Diabetes Study (GDS) Group . Early detection of nerve fiber loss by corneal confocal microscopy and skin biopsy in recently diagnosed type 2 diabetes. Diabetes 2014;63:2454–2463 [DOI] [PubMed] [Google Scholar]
- 31.Smith AG, Russell J, Feldman EL, et al. Lifestyle intervention for pre-diabetic neuropathy. Diabetes Care 2006;29:1294–1299 [DOI] [PubMed] [Google Scholar]
- 32.Tavakoli M, Petropoulos IN, Malik RA. Corneal confocal microscopy to assess diabetic neuropathy: an eye on the foot. J Diabetes Sci Tech 2013;7:1179–1189 [DOI] [PMC free article] [PubMed] [Google Scholar]
- 33.Sivaskandarajah GA, Halpern EM, Lovblom LE, et al. Structure-function relationship between corneal nerves and conventional small-fiber tests in type 1 diabetes. Diabetes Care 2013;36:2748–2755 [DOI] [PMC free article] [PubMed] [Google Scholar]
- 34.Halpern EM, Lovblom LE, Orlov S, Ahmed A, Bril V, Perkins BA. The impact of common variation in the definition of diabetic sensorimotor polyneuropathy on the validity of corneal in vivo confocal microscopy in patients with type 1 diabetes: a brief report. J Diabetes Complications 2013;27:240–242 [DOI] [PubMed] [Google Scholar]
- 35.Dehghani C, Pritchard N, Edwards K, Russell AW, Malik RA, Efron N. Fully automated, semiautomated, and manual morphometric analysis of corneal subbasal nerve plexus in individuals with and without diabetes. Cornea 2014;33:696–702 [DOI] [PubMed] [Google Scholar]