Abstract
Aim:
The purpose of this study was to investigate, the condyle-fossa relationship, in clinically asymptomatic orthodontically untreated south Indian female volunteers, by cone-beam computed tomography (CBCT).
Materials and Methods:
The study population consisted of 13 clinically symptom-free and orthodontically untreated angle's Class I female subjects with the mean age of 18 years (ranges from 17 years to 20 years). The normal disc position of the 13 subjects was confirmed by history, clinical examination and magnetic resonance imaging scan. Then, the images of the temporomandibular joint (TMJ)of the subjects were taken using CBCT to evaluate the optimal condylar position. Posterior joint space (PS), superior joint space (SS) and anterior joint space (AS) were measured, and the values were subjected to statistical analysis. Mean PS, SS and AS of right and left side TMJ ' and AS of right sid 's were calculated. Paired samples t-test were used for each measurement to evaluate the average differences between the right and left side for each element of the sample.
Results:
The mean value of PS, SS and AS of right side TMJ 's were 2.1385, 2.2769 and 1.7615, respectively. The mean value of PS, SS and AS of left side TMJ 's were 2.1385, 2.5308 and 1.8538, respectively. Statistical analysis with the t-test indicated no significant differences in the AS, SS, or PS values between the right and left side. TMJ 's mean PS, SS, and AS measurements were2.1 mm (standard deviation [SD] ±0.65 mm), 2.4 mm (SD ± 0.58 mm), and 1.8 mm (SD ± 0.52 mm), respectively. The ratios of SS and PS to AS, with AS set to 1.0, were 1.3 and 1.2, respectively.
Conclusion:
These data from optimal joints might serve as norms for the clinical assessment of condylar position obtained by CBCT.
KEY WORDS: Condylar position, cone-beam computed tomography, South Indian population
Mandibular condyle is unique that it adapts to different functional loads. The ideal mandibular condylar position is usually assessed in the maximum intercuspation position. Various radiographic methods were introduced in orthodontics for diagnosing temporomandibular disorders (TMD). Conventional tomographic X-rays are commonly used to view the temporomandibular joint (TMJ) area. However, because of poor quality of images and variability in interpretation of anatomic areas, it failed to provide the necessary information for diagnosing optimal condylar position.
Therefore, new diagnosing techniques like magnetic resonance imaging (MRI) and cone-beam computed tomography (CBCT) replaced conventional methods for accurate visualization of the craniofacial complex. MRI is a noninvasive, nonionizing procedure that produces highly sensitive and specific tomographic images in any plane with excellent soft tissue contrast and reduced biologic hazards. MRI has become the gold standard for examination of soft tissues of the TMJ.[1] CBCT, a relatively new three-dimensional imaging technique was introduced in dentistry for accurate reproduction of joint structure. It has several advantages such as lower radiation dose and rapid scan time and reduced image artifact compared to medical computed tomography. Multiplanar reformatting of the image can be done using CBCT.
Temporomandibular joint disorders are often characterized by disc displacement, improper condyle-fossa relationship, orofacial pain, joint sounds and reduced mandibular movements, which is seen even in children and adolescents.[2] Despite the availability of many CBCT views of TMJ, the norms to identify a disorder is not clear in any given population in India. Thus, the purpose of this study was to investigate, the condyle-fossa relationship, in clinically asymptomatic orthodontically untreated south Indian female volunteers, by CBCT.
Materials and Methods
The study population consisted of 13 clinically symptom-free and orthodontically untreated angle 's Class I female subjects with the mean age of 18 years (ranges from 17 years to 20 years).
The criteria for selection were
No history or clinical symptoms of TMD
No asymmetry of the mandible
No history of orthodontic treatment
No previous trauma to the face or chin
No deviation on opening and closure
Mouth opening >40 mm
No cross bites, open bites, and deep bite
Axiographic record to signify a healthy joint.
Exclusion criteria were
Pain, sounds, and clicking in the TMJ area
Deviation of the lower jaw on opening
Mouth opening <40 mm
Tenderness of muscles of mastication.
The study sample consisted of angles’ dento-alveolar Class I volunteer subjects who were referred to the Department of Orthodontics and Dentofacial Othopedics, Sree Balaji Dental College and Hospital for routine examination and who agreed to participate in this research project. Informed consents were obtained from each subject before obtaining the records.
Magnetic resonance imaging of the TMJ of the subjects were performed using a 1.5-T MR imaging system (Gyroscan ACS-NT Intera, Philips, The Netherland) with surface coils and 2.5 mm section thickness. Proton density-weighted images: Field of view (FOV) 12 cm, repetition time (TR) 2500 ms, echo time (TE) 20 ms with a 256 3 256 matrix. Fat-suppressed (spectral attenuated inversion recovery) T2-weighted images: TR 2,500 ms, TE 100 ms. Normal disc position, confirmed by an experienced radiologist subjectively with coronal and sagittal MRI slices, with the disc between the condyle and the eminence in the sagittal plane, the posterior band of the disc at 12 O 'clock position, no mediolateral disc displacement in the coronal plane, no excessive effusion and no hypertrophy of the disc.
Cone-beam computed tomography images were taken with the subject in an upright standing position, placing with no chin rest. Head position was adjusted using mid-sagittal positioning laser beam for a central positioning. Lower volume limit and upper volume limit positioning laser beams were used. Temple supports were tightened. No bite blocks were used, and the scan was taken in maximum intercuspal procedure.
Temporomandibular joints were scanned with KODAK 9500 cone-beam 3D CT System (Carestream Health Inc., USA) with a volume size of large FOV 18 cm × 20.6 cm, voxel size 300 microns (0.3 mm), scan time 10.8 s, tube voltage 60–90 kV (max, pulsed mode for three-dimensional modality), tube current 2-15 mA (max). The acquired volume was reconstructed into three-dimensional images with volume rendering software – CS 3D Imaging Software 3.1.9 (Carestream Health Inc.). Scanning conditions used were and measurements were done at slice thickness of 300 microns (0.3 mm).
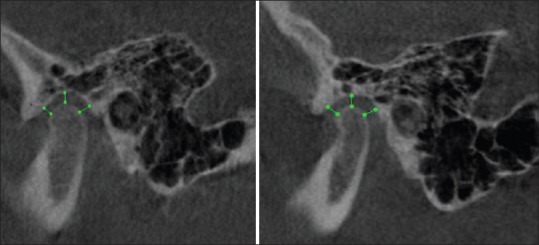
Linear measurements of optimal joint space between the condyle and fossa were made on the sagittal section of the orthogonal slicing in the software module.
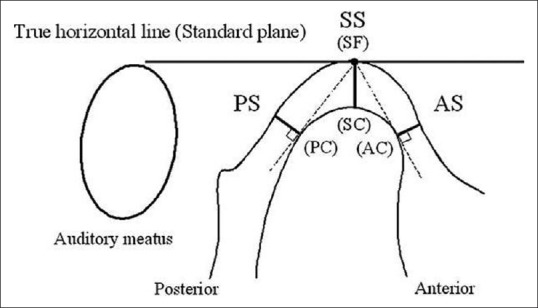
The following measurements were assessed according to a study conducted by Ikeda and Kawamura [Figures 1 and 2].[2]
Figure 1.

Measurements of posterior, superior and anterior joint space [2]
Figure 2.

Limited cone-beam computed tomography images of temporomandibular joint
Anterior joint space (AS): Expressed by the shortest distance between the most anterior point of the condyle and the posterior wall of the articular tubercle
Superior joint space (SS): Measured from the shortest distance between the most superior point of the condyle and the most superior point of the mandibular fossa
Posterior joint space (PS): Represented by the shortest distance between the most posterior point of the condyle and the posterior wall of the condylar fossa.
Results
The normal disc position of the 13 subjects (with the mean age of 18 years) was confirmed by history, clinical examination and MRI scan. Then, the images of the TMJ of the subjects were taken using limited CBCT to evaluate the optimal condylar position.
Posterior joint space, SS and AS were measured, and the values were subjected to statistical analysis.
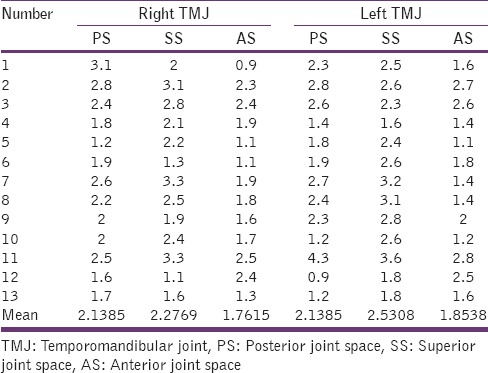
Mean PS, SS, and AS of right and left side TMJ 's were calculated[Table 1].
Table 1.
Statistical data for the right and left TMJ's

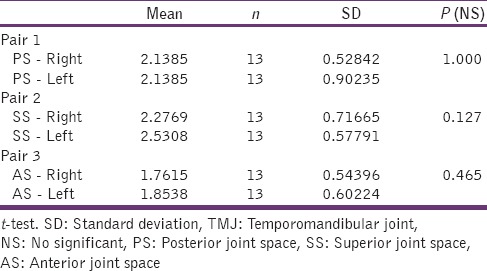
Paired samples t-test were used for each measurement to evaluate the average differences between the right and left side for each element of the sample [Table 2].
Table 2.
Paired samples statistics for right and left TMJ's

For the examined subjects the mean value of PS, SS and AS of right side TMJ's were 2.1385, 2.2769 and 1.7615, respectively. The mean value of PS, SS and AS of left side TMJ 's were 2.1385, 2.5308 and 1.8538 respectively.
Statistical analysis with the t-test indicated no significant differences in the AS, SS, or PS values between the right and left side TMJ's.
Mean PS, SS, and AS measurements were 2.1 mm (standard deviation [SD] ±0.65 mm), 2.4 mm (SD ± 0.58 mm), and 1.8 mm (SD ± 0.52 mm), respectively. The ratios of SS and PS to AS, with AS set to 1.0, were 1.3and 1.2, respectively [Table 3].
Table 3.
Descriptive statistical data for the 26 subjects

Discussion
Proper diagnosis plays an important role in the successful treatment of temporomandibular dysfunction that includes internal derangement, osteo-arthrosis, and myofacial syndromes. Dolwick defined internal derangement of TMJ as the abnormal relationship of the articular disc to the condyle, fossa and articular eminence with disc usually displaced in anteromedial direction.[3,4] Osteo-arthrosis is a noninflammatory joint disease that results in osseous remodeling and degeneration of articular surfaces.
Temporomandibular joint dysfunction can be diagnosed by clinical examination, conventional radiography, tomography, arthrography, MRI and CBCT.[2, 5] MRI uses magnetic energy and radio waves which is useful in evaluating the soft tissues, particularly in its assessment of the articular disc. CBCT scanning is a noninvasive procedure which produces true images by secondary reconstruction procedure. Precise representation of hard and soft tissue can be obtained as a series of thin slices without any magnification or distortion in CBCT. The objective of this study is to set up norms for untreated Indian population (female) using CBCT, which would enable the clinician to have standard reference, which would aid in diagnosis and thereby delivering an appropriate treatment plan. Ikeda and Kawamura[2] also stated that the accurate measurement of condylar position can be done using CBCT and MRI.
The present study was conducted in the female population as many authors have indicated a female predilection of signs and symptoms associated with TMD. Wang and Fleisher[4] stated that the highest prevalence of TMD was noticed in women aged 20-40 years who comprise of 80% of patients being treated for TMD. Tasaki et al.[6] also stated that the female dominance is seen more in the TMJ dysfunction group.
Major et al.[7] used MRI in 335 subjects to determine the associations between TMJ characteristics and TMJ internal derangement (disc position and deformation) in an adolescent population and found that for female subjects were 2.24 mm (SD ± 0.79 mm) for AS, 2.87 mm (SD ± 0.89 mm) for SS, and 2.56 mm (SD ± 0.78 mm) for PS. Kinniburgh et al.[8] assessed the condylar shape, articular eminence shape, and condyle position in 109 adolescent patients with normal disc position and 67 patients with anterior disc displacement. He reported that for female subjects the condylar position was 1.99 mm (SD ± 0.56 mm) for AS, 3.42 mm (SD ± 0.90 mm) for SS, and 2.86 mm (SD ± 0.74 mm) for PS.
Ikeda and Kawamura[2] assessed the optimal position of the mandibular condyle in 24 joints of 22 symptom-free subjects (10 male, 12 female; mean age, 18 years) who had no disc displacement and verified it by MRI. He reported that optimal condylar position was 1.3 mm (SD ± 0.3 mm) for AS, 2.5 (SD ± 0.6 mm) for SS, and 2.1 (SD ± 0.3 mm) for PS. The ratio of AS to SS to PS was 1.0 to 1.9–1.6 for 24 subjects (11 males and 13 females).
In the present study, the values reported for the right TMJ was 1.76 mm (SD ± 0.54 mm) for AS, 2.27 mm (SD ± 0.71 mm) for SS, and 2.13 mm (SD ± 0.52 mm) for PS. For the left TMJ the values were 1.85 mm (SD ± 0.60 mm) for AS, 2.53 mm (SD ± 0.57 mm) for SS, and 2.13 mm (SD ± 0.90 mm) for PS. The SS distance in our study was greatest, followed by PS and AS; which agrees with the results reported by Kazumi et al., Kinniburgh et al., and Major et al.
Kecik et al.[1] in his study stated that for right TMJ condylar position was 2.49 mm (SD ± 0.13 mm) for AS, 2.57 mm (SD ± 0.18 mm) for SS, and 2.48 mm (SD ± 0.11 mm) for PS and for the left TMJ the values were 2.48 mm (SD ± 0.12 mm) for AS, 2.65 mm (SD ± 0.21 mm) for SS, and 2.47 mm (SD ± 0.19 mm) for PS. This finding was similar to our finding where significant difference was not seen between right and left sides.
However, the resultsgiven by Rodrigues et al.[9] showed that the PS showed statistically significant asymmetry between the right and left sides. He stated that the asymmetry in the posterior articular space could be due to the different dimensions of the mandibular fossa. He reported that the right TMJ was 1.29 mm (SD ± 0.61 mm) for AS, 1.57 mm (SD ± 0.56 mm) for SS, and 1.87 mm (SD ± 0.45 mm) for PS and for the left TMJ the values were 1.22 mm (SD ± 0.51 mm) for AS, 1.59 mm (SD ± 0.54 mm) for SS, and 1.65 mm (SD ± 0.45 mm) for PS.
Major et al.,[7] Christiansen et al.[10] and Sicher and Du Brul[11] found an association between disc displacement and changes in joint space. Discrepancy between the optimal and the altered joint spaces might indirectly indicate disc displacement. Thus in all synovial joints, the articulating surfaces of the opposing bones should be held in firm contact by the associated ligaments and musculature and closely fitted between the opposing articular surfaces throughout the range of jaw movement. If this close relationship between the eminence and the condyle is lost due to disc displacement, there will be changes in joint space.
Thus the present study, conducted in the female population, using CBCT, provides data for the optimal condylar position, which might be a useful reference for clinical assessment of abnormal condylar position. However, still it should be emphasized that a greater sample size is needed to standardize the norms.
Conclusion
The following conclusions was drawn from the present study,
Mean AS was 1.8 mm (SD ± 0.52 mm)
Mean SS was 2.4 mm (SD ± 0.58 mm)
Mean PS was 2.1 mm (SD ± 0.65 mm)
The ratio of AS to SS to PS was 1.0-1.3 – 1.2
No significant differences in the AS, SS, or PS values between the right and left side TMJ of each female subjects.
Footnotes
Source of Support:Nil
Conflict of Interest: None declared.
References
- 1.Kecik D, Kocadereli I, Saatci I. Condylar disc relationships and vibration energy in asymptomatic class I 9- to 12-year olds. Angle Orthod. 2005;75:54–62. doi: 10.1043/0003-3219(2005)075<0054:CDRAVE>2.0.CO;2. [DOI] [PubMed] [Google Scholar]
- 2.Ikeda K, Kawamura A. Assessment of optimal condylar position with limited cone-beam computed tomography. Am J Orthod Dentofacial Orthop. 2009;135:495–501. doi: 10.1016/j.ajodo.2007.05.021. [DOI] [PubMed] [Google Scholar]
- 3.Dolwick MF, Riggs RR. Diagnosis and treatment of internal derangements of the temporomandibular joint. Dent Clin North Am. 1983;27:561–72. [PubMed] [Google Scholar]
- 4.Wang EY, Fleisher KA. MRI of temporomandibular joint disorders. Appl Radiol. 2008;37:17–24. [Google Scholar]
- 5.Katzberg RW. Temporomandibular joint imaging. Anesth Prog. 1990;37:121–6. [PMC free article] [PubMed] [Google Scholar]
- 6.Tasaki MM, Westesson PL, Isberg AM, Ren YF, Tallents RH. Classification and prevalence of temporomandibular joint disk displacement in patients and symptom-free volunteers. Am J Orthod Dentofacial Orthop. 1996;109:249–62. doi: 10.1016/s0889-5406(96)70148-8. [DOI] [PubMed] [Google Scholar]
- 7.Major PW, Kinniburgh RD, Nebbe B, Prasad NG, Glover KE. Tomographic assessment of temporomandibular joint osseous articular surface contour and spatial relationships associated with disc displacement and disc length. Am J Orthod Dentofacial Orthop. 2002;121:152–61. doi: 10.1067/mod.2002.120641. [DOI] [PubMed] [Google Scholar]
- 8.Kinniburgh RD, Major PW, Nebbe B, West K, Glover KE. Osseous morphology and spatial relationships of the temporomandibular joint: Comparisons of normal and anterior disc positions. Angle Orthod. 2000;70:70–80. doi: 10.1043/0003-3219(2000)070<0070:OMASRO>2.0.CO;2. [DOI] [PubMed] [Google Scholar]
- 9.Rodrigues AF, Fraga MR, Vitral RW. Computed tomography evaluation of the temporomandibular joint in Class I malocclusion patients: Condylar symmetry and condyle-fossa relationship. Am J Orthod Dentofacial Orthop. 2009;136:192–8. doi: 10.1016/j.ajodo.2007.07.032. [DOI] [PubMed] [Google Scholar]
- 10.Christiansen EL, Chan TT, Thompson JR, Hasso AN, Hinshaw DB, Jr, Kopp S. Computed tomography of the normal temporomandibular joint. Scand J Dent Res. 1987;95:499–509. doi: 10.1111/j.1600-0722.1987.tb01966.x. [DOI] [PubMed] [Google Scholar]
- 11.Sicher H, Du Brul EL. 5th ed. St. Louis: C. V. Mosby; 1980. Sicher's Oral Anatomy; p. 158. [Google Scholar]


