

Abstract
Background and Purpose
Sodium butyrate (NaB), an epigenetic modifier, is effective in promoting insulin sensitivity. The specific genomic loci and mechanisms underlying epigenetically induced obesity and insulin resistance and the targets of NaB are not fully understood.
Experimental Approach
The anti-diabetic and anti-obesity effects of NaB treatment were measured by comparing phenotypes and physiologies of C57BL/6J mice fed a low-fat diet (LF), high-fat diet (HF) or high-fat diet plus NaB (HF + NaB) for 10 weeks. We determined a possible mechanism of NaB action through induction of beneficial skeletal muscle mitochondrial adaptations and applied microccocal nuclease digestion with sequencing (MNase-seq) to assess whole genome differences in nucleosome occupancy or positioning and to identify associated epigenetic targets of NaB.
Key Results
NaB prevented HF diet-induced increases in body weight and adiposity without altering food intake or energy expenditure, improved insulin sensitivity as measured by glucose and insulin tolerance tests, and decreased respiratory exchange ratio. In skeletal muscle, NaB increased the percentage of type 1 fibres, improved acylcarnitine profiles as measured by metabolomics and produced a chromatin structure, determined by MNase-seq, similar to that seen in LF. Targeted analysis of representative nuclear-encoded mitochondrial genes showed specific repositioning of the −1 nucleosome in association with altered gene expression.
Conclusions and Implications
NaB treatment may be an effective pharmacological approach for type 2 diabetes and obesity by inducing −1 nucleosome repositioning within nuclear-encoded mitochondrial genes, causing skeletal muscle mitochondrial adaptations that result in more complete β-oxidation and a lean, insulin sensitive phenotype.
Linked Articles
This article is part of a themed section on Epigenetics and Therapy. To view the other articles in this section visit http://dx.doi.org/10.1111/bph.2015.172.issue-11
Tables of Links
| TARGETS |
|---|
| Enzymes |
| HDAC, histone deacetylase |
| LIGANDS |
|---|
| MS275, entinostat |
| NaB, sodium butyrate |
| SAHA, vorinostat |
| Trichostatin A |
These Tables list key protein targets and ligands in this article which are hyperlinked to corresponding entries in http://www.guidetopharmacology.org, the common portal for data from the IUPHAR/BPS Guide to PHARMACOLOGY (Pawson et al., 2014) and are permanently archived in the Concise Guideto PHARMACOLOGY 2013/14 (Alexander et al., 2013).
Introduction
Much of our knowledge regarding the pathogenesis of obesity and type 2 diabetes comes from genetic studies. While both these disorders have strong hereditary components, the external environment also plays a large role in the onset and maintenance of the metabolic dysfunction characteristic of these disease states (Bouchard, 1997; Talmud et al., 2010). For instance, a high-fat diet (HFD) induces obesity in isogenic C57BL/6J mice partially by decreasing mitochondrial number and promoting mitochondrial dysfunction in skeletal muscle (Sparks et al., 2005). Disturbances in mitochondrial function have been shown to affect the induction and complications of type 2 diabetes (Sivitz and Yorek, 2010). These diet-induced mitochondrial adaptations in muscle play a primary role in the development of whole body insulin resistance (IR) (Eriksson et al., 1989; DeFronzo and Tripathy, 2009) and might be linked to alterations in the epigenome, including changes in DNA methylation patterns and covalent histone modifications (Gallou-Kabani and Junien, 2005; Dudley et al., 2011). Sodium butyrate (NaB), a known histone deacetylase (HDAC) inhibitor and chromatin modifier, has recently been shown to improve insulin sensitivity in animal models and has been effective for treating other diseases, such as sickle cell disease, β-thalassemia and inflammatory bowel disease, in clinical trials (Berni Canani et al., 2012). Thus, epigenetics may constitute a potential mechanism whereby diet and NaB regulate mitochondrial adaptation and insulin sensitivity to determine disease onset and progression. However, the identification of specific genomic loci that are targeted by the epigenetic machinery and their downstream effectors in muscle mitochondrial adaptations, obesity and IR remain unidentified.
Nucleosome mapping, a technique that determines nucleosome number and position within the chromatin, may provide additional insight into identifying diet-induced chromatin remodelling and epigenetically regulated genomic loci. The nucleosome itself is the basic subunit of chromatin that determines the genomic DNA structure and is made of 147 base pairs (bp) of DNA wrapped around a core of histone proteins. The combinatorial effects of epigenetic mechanisms, including DNA methylation and histone tail modifications, determine the binding affinity of the histone proteins to the DNA and, as a result, the chromatin structure (Zhou et al., 2011). Because the formation and positioning of the nucleosome within the chromatin partially determines the access of RNA polymerase II and other transcription factors to the DNA, nucleosome remodelling has emerged as a key strategy to regulate transcription and gene expression (Weiner et al., 2010; Hainer et al., 2011). Thus, in vivo application of nucleosome mapping techniques would generate a comprehensive assessment of the epigenomic state and also provide information on epigenetic mechanisms that determine gene expression in relation to changes in phenotype or physiology. Although whole genome nucleosome maps (NMs) have been obtained in several model organisms (Albert et al., 2007; Valouev et al., 2008), human cell lines (Valouev et al., 2011) and, recently, mammalian liver (Li et al., 2011), they remain uncharacterized in most mammalian tissues in vivo.
Although the nuclear genome encodes most of the proteins needed for mitochondrion synthesis and function, the coordinated transcription of genes from the mitochondrial DNA is necessary for assembly and function in order for mitochondrial adaptation to occur. Peroxisome proliferator-activated receptor gamma (PPARγ) co-activator 1 alpha (PGC1α) is a transcriptional co-activator that is an important regulator of gene expression in the nucleus and has also been shown to translocate to the mitochondria, where it up-regulates mitochondrial DNA transcription and replication (Safdar et al., 2011; Smith et al., 2013). Thus, PGC1α regulates gene expression of both nuclear- and mitochondrial-encoded genes needed for mitochondrion synthesis and functioning and act as a key coordinator and regulator of muscle mitochondrial function and fibre type and whole body insulin sensitivity (Wu et al., 1999; Safdar et al., 2011). Furthermore, PGC1α expression itself is regulated by environmental factors, such as diet, exercise and cold exposure (Knutti and Kralli, 2001). In the muscle of type 2 diabetic individuals and in primary myocytes treated with fatty acids, PGC1α expression is epigenetically suppressed by DNA methylation (Barrès et al., 2009). Hypermethylation and reduced expression of PGC1α is associated with decreased mitochondrial number and function in muscle (Barrès et al., 2009; 2012,).
In the present study, we performed genome-wide mapping of nucleosome positioning, using microccocal nuclease (MNase) digestion followed by high-throughput sequencing (MNase-seq), in muscle from C57BL/6J mice after exposure to low-fat diet (LFD), high-fat diet (HFD) or HFD supplemented with NaB. As NaB is a promising anti-obesity and anti-diabetic agent, known to inhibit HDACs, we hypothesized that NaB would attenuate diet-induced obesity and IR through chromatin remodelling and consequently maintains muscle mitochondrial competence. Thus, we screened whole genome NMs for genomic regions and loci with differential nucleosome occupancy (number) or positioning (location) that may be important in switching from an obese, IR state with decreased skeletal muscle mitochondrial function and oxidative capacity to a lean, insulin-sensitive state with increased skeletal muscle mitochondrial function and oxidative capacity. Further targeted mapping of −1 nucleosome positions in nuclear-encoded genes involved in determining muscle mitochondrial adaptation, such as Pgc1α, Pparγ, nuclear respiratory factor 1 (Nrf1) and myocyte enhancer factor 2b (Mef2b), provided compelling evidence that NaB-induced positioning of the −1 nucleosome within these genes may serve as a common mechanism to regulate nuclear-encoded mitochondrial expression and epigenetically regulate mitochondrial adaptation in response to diet. Our results showed that NaB treatment prevented diet-induced obesity and IR and induced beneficial mitochondrial adaptation. We provide insight into the role of nucleosome positioning and abundance in the diet-induced epigenetic regulation of muscle mitochondrial adaptation, which may lead to further identification of additional loci and genes that are important in determining a lean or obese phenotype and insulin-sensitive or insulin-resistant physiology.
Methods
Animals and diets
All animal care and experimental procedures were reviewed and approved by the Pennington Biomedical Research Center Institutional Animal Care and Use Committee in accordance with the recommendations in the Guide for Care and Use of Laboratory Animals of the National Institutes of Health (Animal Welfare Assurance Number A3677-01). All studies involving animals are reported in accordance with the ARRIVE guidelines for reporting experiments involving animals (Kilkenny et al., 2010; McGrath et al., 2010). A total of 30 animals were used in the experiments described here.
Five-week-old male C57BL/6J mice (Jackson Laboratories, Bar Harbor, ME, USA) were randomly divided into three separate groups, with each group consisting of 10 mice. Mice were fed either (i) LFD (LF; Purina rodent chow 5001, LabDiet, St Louis, MO, USA); (ii) HFD (HF; Research Diets D12331, New Brunswick, NJ, USA); or (iii) HFD fat plus NaB [HF + NaB; 5% sodium butyrate (wt/wt); D12331], and these mice were used for all experiments. NaB was purchased from Sigma (303410; St Louis, MO, USA). Food and water were provided ad libitum and changed weekly. Mice were singly housed on a 12/12 h light/dark cycle with constant temperature (22–23°C) in shoebox cages with corncob bedding. Weekly food consumption was monitored over a 48 h period. Weekly body composition was determined by NMR spectroscopy (Bruker Minispec, Billerica, MA, USA) in duplicate. Inguinal and epididymal white adipose tissue depots were dissected at the end of the study and weighed. Quadriceps muscle was dissected from each hind leg and fixed in 4% paraformaldehyde or snap-frozen in liquid nitrogen.
Metabolic phenotyping
After 8–9 weeks of feeding, all mice (n = 10 per group) were placed in metabolic chambers (Oxymax CLAMS; Columbus Instruments, Columbus, OH, USA) and acclimated over a 48 h period. Oxygen consumption (VO2), carbon dioxide production (CO2) and physical activity data were collected for the following 4 days. Respiratory exchange ratio (RER) is the ratio of VCO2 produced to VO2 consumed. Energy expenditure was calculated as VO2 × [3.815 + (1.232 × RER) × 4.18 kJ·h−1] and is expressed as kilojoule per hour per kilogram of fat-free mass.
Glucose and insulin tolerance tests
Mice were fasted overnight (glucose; n = 5 per group) or 4 h prior (insulin; n = 5 per group) to testing. Glucose or insulin (Sigma I9278) was injected i.p. at 2.5 g·kg−1 and 0.75 U·kg−1 respectively. Blood glucose was monitored in samples obtained from the tail vein using a FreeStyle blood glucose monitor (TheraSense, Phoenix, AZ, USA). For the glucose tolerance test (GTT), blood samples were collected at 0 min, 30 min, 1 h and 2 h. For the insulin tolerance test (ITT), blood samples were collected at 0 min, 15 min, 30 min, 1 h and 2 h. AUC was calculated for each animal.
Immunohistochemistry (IHC)
Muscle was fixed in 4% paraformaldehyde, paraffin embedded and sectioned at 8 μm (n = 4 per group). Deparaffinized samples were treated with 0.01 M sodium citrate buffer with 0.2% Triton X-100 for antigen retrieval, blocked with 1% NGS (Vector Labs s-1000, Burlingame, CA, USA) and incubated with a monoclonal anti-myosin primary antibody (Sigma M8421) overnight at 4°C followed by incubation with a polyclonal FITC-conjugated secondary antibody (Abcam ab6785, Cambridge, MA, USA) for 2 h. Sections were mounted with vectashield mounting media containing DAPI (Vector labs H-1200) for visualization of nuclei. Images were captured using a Zeiss Axiplan 2 upright microscope (Intelligent Imaging Innovations, Inc., Denver, CO, USA) and Slidebook Software v2.0 (Intelligent Imaging Innovations, Inc.) in the Cell Biology and Bioimaging Core at the PBRC. Image analyses were conducted using MacBiophotonics ImageJ software using the count plugin (Bethesda, MD, USA).
qRT-PCR
Entire quadriceps (n = 8 in LF and n = 10 per group in HF and HF + NaB, respectively) was ground with a mortar and pestle under liquid nitrogen and homogenized with Trizol reagent according to the manufacturer's protocol (Life Technologies, Foster City, CA, USA), followed by column purification with an RNeasy kit (Qiagen, Valencia, CA, USA). For qRT-PCR, cDNA synthesis was carried out using M-MLV reverse transcriptase according to the manufacturer's protocol (Promega, Madison, WI, USA) and used in downstream qRT-PCR with SYBR Green PCR Master Mix (Applied Biosystems, Foster City, CA, USA) on an ABI7900HT. Primers for Pparγ, Nrf1, Mef2b I and Pgc1α (primer sequences given in Supporting Information Table S5) were designed using NCBI's Primer-BLAST, where at least one primer spanned an exon–exon boundary. For Pgc1α quantification, primers were targeted to the 5′ region of the mRNA, as Pgc1α is known to have mRNA splice variants that occur past exon 5. Cyclophilin B was used as an internal control. Gene expression was determined using the ΔΔCt method.
Methylation-specific PCR (MSP)
Genomic DNA was isolated from individual samples (n = 5 per group). MSP primers were targeted to the methylated or unmethylated −260 nucleotides (nt) within the CCGG sequence in Pgc1α and are provided in Supporting Information Table S5. gDNA was bisulfite converted using the EpiTect Bisulfite Kit (Qiagen) followed by amplification using the EpiTect MSP Kit (Qiagen) according to the manufacturer's protocols. MSP products were run on a 1.5% agarose gel and densitometry was performed using MacBiophotonics ImageJ software. The percentage of methylated DNA at the −260 nt was calculated as the amount of methylated product divided by the total amount of methylated plus unmethylated product.
Metabolomics
Approximately 20–25 μg of powdered tissue (n = 5 per group) was added to 950 μL of cold LC/MS-grade water (9×) and further homogenized using a handheld homogenizer with a polypropylene pestle for 30 s on ice. Samples were subjected to one freeze-fracture cycle on dry ice, sonicated and centrifuged. The supernatant was used for tandem MS of 55 acylcarnitine species ranging from 2 to 20 carbons, in saturated and unsaturated forms.
Sequencing of mononucleosomal DNA
The methodology of mononucleosomal DNA isolation and high-throughput sequencing and analysis is shown in Supporting Information Fig. S1. Whole genome NM data are publicly available in the NIH GEO database, accession GSE37913. We followed the protocol previously described in Li et al. (2011) for mononucleosomal DNA extraction, sequencing and data analysis, with the exception that mononucleosomal DNA was purified by EtOH precipitation and modified following the SOLiD sequencing protocol. Fragments were sequenced with a SOLiD 5500xl, producing ∼160 million reads of 35 nucleotide fragments per sample, or ∼480 million reads total (Supporting Information Table S1). Detailed methods for mononucleosomal DNA extraction and library preparation can be found in the Supporting Information Appendix S1.
MNase-seq analysis
Whole genome aligned reads and NMs can be accessed at http://www.purdue.edu/hhs/nutr/labs/henagan/nucleosomemaps/. MNase-seq read alignment and primary analysis were performed as previously described by Li et al. (2011), with the exception that our false discovery rate (FDR) cutoff was 5% instead of the previously reported 20% (Supporting Information Fig. S1). Detailed methods can be found in the Supporting Information Appendix S1. The sequence coverage was calculated as previously described (Yigit et al., 2013) with the formula (number of mapped reads) × (147)/(mm9 size = 1 865 500 000).
Genome ontology (GO) analysis was performed using HOMER (Heinz et al., 2010). GO terms were considered significant and differentially enriched if P < 0.05 in at least one dietary treatment group and not significant (P > 0.05) in at least one other treatment group. Significant differences in nucleosome occupancy were determined by chi-square tests in GraphPad Prism 4.0 (La Jolla, CA, USA), with a P < 0.05 considered significantly different. Of note, primary (mapping) and secondary (whole genome-wide nucleosome patterns) MNase-seq analyses were performed with reads in HOMER (Heinz et al., 2010). Tertiary analyses (comparison between treatment groups, i.e. chi-square tests for differences in nucleosome occupancy) were performed using averages of nucleosome scores.
Scanning PCR
For nucleosome mapping within the Pgc1α region surrounding the TSS, genomic and mononucleosomal DNA (n = 5 per group) were isolated as described earlier, with the exception that genomic DNA was not digested with MNase prior to proteinase K digestion. qPCR primers were designed to encompass the −260 nt and are provided in Supporting Information Table S5. Following 40 cycles of PCR, both mononucleosomal and genomic DNA samples were run on a 1.5% agarose gel and visualized on a Molecular Imager Gel Doc XR (Biorad, Hercules, CA, USA). Densitometry was performed using MacBiophotonics ImageJ software, with mononucleosomal band intensity being divided by the intensity of the corresponding input genomic DNA. Corrected intensities in HF and HF + NaB were then compared with LF to generate nucleosome occupancy graphs.
Microarrays
Normalized microarray data from samples GSM11646 to GSM11657 were extracted from the NIH GEO website, accession series GSE8524, on 28 May 2012. Briefly, this study fed an LFD or an HFD to C57BL/6J mice at 12 weeks of age for 4 weeks, extracted RNA from quadriceps muscle and performed microarrays using the Affymetrix platform (de Wilde et al., 2008). Any genes with a fold change ≥2-fold and a P < 0.05 were used for pathway analysis with DAVID 6.7 software (Huang et al., 2009).
Data analyses
Analyses of NMs are presented earlier. For all phenotypic and energy expenditure measurements, repeated measures anova and post hoc Tukey's tests were performed in GraphPad Prism 4.0. One-way anova and post hoc Tukey tests were performed for GTT, ITT, IHC, qRT-PCR, qPCR, MSP and each acylcarnitine using GraphPad Prism 4.0 or JMP Genomics 5.0 software. For metabolomics analysis, multiple pairwise comparisons were determined and matrices generated for acylcarnitine profile analysis using JMP Genomics 5.0 software. In all analyses, if P < 0.05, the results were considered significantly different.
Results
Phenotype and metabolism
HFD-fed mice (HF) showed increased their body weight and percent body fat and decreased percent muscle, mass compared with LFD-fed mice (LF) and mice on the HFD supplemented with NaB (HF + NaB) (Figure 1A–C and Supporting Information Fig. S2). The HF phenotype occurred despite a lower daily caloric intake in HF compared with LF (Figure 1D). HF mice developed IR, as judged by decreased responsiveness of plasma glucose levels during the GTT and ITT (Figure 1E and F). NaB treatment of HFD-fed mice attenuated HFD-induced increases in adiposity and body weight, resulting in a phenotype strikingly similar to LF (Figure 1A–C and Supporting Information Fig. S2). NaB also re-established insulin sensitivity to levels similar to LF (Figure 1E and F). HF and HF + NaB phenotypic and insulin sensitivity differences occurred despite similar caloric intake, energy expenditure and activity levels (Figure 1D, G and H). However, HF + NaB showed the lowest RER, indicating that HF + NaB had the highest substrate utilization from fat, when compared to any other group (Figure 1I). These data show that dietary NaB treatment prevented HFD-induced increases in adiposity and attenuated HFD-induced IR. Importantly, NaB produced a whole body phenotype and physiology similar to that seen in LF.
Figure 1.

Whole body phenotype. C57BL/6J mice were fed LFD (LF; 10% kcal from fat), HFD (HF; 45% kcal from fat) or HF + NaB (NaB; 45% kcal from fat) diet, and body weight (A) and composition, reported as (B) percent body fat (weight of fat /body weight x100) and (C) percent muscle mass (weight of muscle/ body weight x 100), were measured weekly in the three experimental groups. (D) Food intake (consumption) was monitored weekly. Glucose tolerance (GTT) (E) and insulin tolerance (ITT) (F) tests (n = 4–5 per group) were performed after 8 weeks of feeding, and data are presented as AUC. LF, HF and HF + NaB mice were placed in metabolic chambers at 8–9 weeks of feeding their respective diets. (G) Energy expenditure was measured after a 48 h acclimation period to the chambers for a period of 4 days. Grey bars depict night periods and open areas day periods. Energy expenditure was significantly lower by repeated measures anova in HF and HF + NaB compared with LF but not different between HF and HF + NaB. Total activity (H) and RER (I) were determined during the same period and are presented as the means ± SEM over the 4 day period. *P < 0.05, ***P < 0.001; significant difference between groups; one-way anova and Tukey's test.
Myocellular phenotype and mitochondrial function
Differences in skeletal muscle fibre type are indicative of the oxidative capacity and mitochondrial content of skeletal muscle, with type 1 fibres being highly oxidative and having an increased number of mitochondria compared with type 2 fibres. Because NaB treatment was able to prevent HFD-induced IR and adiposity, and skeletal muscle is a major site of glucose uptake and one of the first tissues to become insulin resistant due partially to mitochondrial dysfunction (DeFronzo and Tripathy, 2009), we aimed to determine if NaB may improve glucose and insulin tolerance by promoting a skeletal muscle type 1 fibre phenotype and physiology. Immunohistochemical analysis of type 1 muscle fibres revealed that NaB significantly increased oxidative fibres in the quadriceps muscle compared with HF (Supporting Information Fig. S3A). Type 1 fibre percentage was also increased in LF compared with HF, but this increase did not reach statistical significance (P = 0.07) (Supporting Information Fig. S3A). The NaB-induced attenuation in HFD-induced decreases in type 1 fibres produced a cellular and tissue phenotype similar to that seen in LF (Supporting Information Fig. S3A).
Mitochondrial dysfunction and incomplete β-oxidation are induced by HFD feeding and may be causative in IR. Thus, we determined if NaB may work through a mechanism that improves complete fatty acid oxidation and mitochondrial function by performing metabolomics for 55 different acylcarnitine species. Acylcarnitines are formed when the acyl-CoA intermediates of fatty and amino acid catabolism bind to a carnitine molecule and are indicative of the progression of β-oxidation (Yates and Garland, 1970). Analysis showed that total acylcarnitine (CN) and acetylcarnitine (C2) levels were significantly decreased in HF and further decreased in HF + NaB compared with LF (Table 1). In addition, HF and HF + NaB had lower and similar amounts of C3, C5, C5-hydroxy (OH) and C4-OH, indicators of amino acid metabolism, compared with LF (Table 1). Even-chain acylcarnitine levels revealed that HF mice exhibited incomplete fatty acid oxidation in the muscle, as shown previously by increases in acylcarnitine levels, specifically increases in long chain acylcarnitine levels, in comparison to medium and short chain acylcarnitine levels (Koves et al., 2008). Our current study also shows significant increases in 21 of the 23 acylcarnitine species and ratios in HF, with increases in only 7 short and medium chain species and ratios compared with LF (Table 1). Although HF + NaB also showed increases in some short (C4 to C8) and medium (C10 to C16) chain species and ratios, including C6, C10, C12/C6:1-DC and C14/C8:1-DC, compared with LF, these increases were attenuated in comparison with those observed in HF (Table 1 and Supporting Information Fig. S3B).
Table 1.
Metabolomics of skeletal muscle. Levels of total acylcarnitines (CN) and of individual acyl carnitines (C2, acetyl carnitine etc) in muscle from the three experimental groups of mice are shown (means ± SEM)
| Acylcarnitine | Diet | P-value | ||
|---|---|---|---|---|
| LF | HF | HF + NaB | ||
| CN | 2.51984 ± 0.10014A | 1.72096 ± 0.10014B | 1.68767 ± 0.10014B | <0.0001 |
| C2 | 3.53112 ± 0.14997A | 2.50482 ± 0.14997B | 1.90505 ± 0.14997C | <0.0001 |
| C3 | 0.025771 ± 0.001A | 0.024282 ± 0.001A | 0.017075 ± 0.001B | 0.0001 |
| C4 | 0.040699 ± 0.00335A | 0.042095 ± 0.00335A | 0.029914 ± 0.00335A | 0.0476 |
| C5-1 | 0.000932 ± 0.00011A | 0.000053 ± 0.00011B | 0 ± 0.00011B | 0.0001 |
| C5 | 0.007897 ± 0.00059A | 0.004375 ± 0.00059B | 0.002692 ± 0.00059B | 0.0001 |
| C4-OH | 0.023702 ± 0.00281A | 0.023557 ± 0.00281A | 0.012079 ± 0.00281B | 0.0187 |
| C4-DC/Ci4-DC | 0.010817 ± 0.00168A | 0.018683 ± 0.00168B | 0.017412 ± 0.00168B | 0.0135 |
| C5-OH | 0.0144 ± 0.00066A | 0.007354 ± 0.00066B | 0.00631 ± 0.00066B | <0.0001 |
| C6:1 | 0.000952 ± 0.00012A | 0.001437 ± 0.00012B | 0.001005 ± 0.00012A,B | 0.0342 |
| C6 | 0.007433 ± 0.00155A | 0.017934 ± 0.00155B | 0.013881 ± 0.00155B | 0.0015 |
| C6-DC | 0.000067 ± 8.22E–05 | 0.000131 ± 8.22E–05 | 0.000156 ± 8.22E–05 | 0.7344 |
| C6-OH | 0.000743 ± 0.00014A,B | 0.001255 ± 0.00014A | 0.00048 ± 0.00014B | 0.0064 |
| C8-1 | 0.000171 ± 0.00015A | 0.001369 ± 0.00015B | 0.000951 ± 0.00015B | 0.0004 |
| C8 | 0.009703 ± 0.00134A | 0.012816 ± 0.00134A,B | 0.015122 ± 0.00134B | 0.0432 |
| C8:1-OH/9 | 0.000047 ± 6.78E–05 | 0.000081 ± 6.78E–05 | 0.000174 ± 6.78E–05 | 0.4179 |
| C8-DC | 0.000064 ± 0.0001 | 0.00016 ± 0.0001 | 0.000309 ± 0.0001 | 0.2629 |
| C3-DC/C8-OH | 0.00801 ± 0.00059 | 0.007485 ± 0.00059 | 0.006408 ± 0.00059 | 0.194 |
| C10-3 | 0.000124 ± 0.0001 | 0.000266 ± 0.0001 | 0.000311 ± 0.0001 | 0.4226 |
| C10-2 | 0.000073 ± 4.12E–05 | 0.000032 ± 4.12E–05 | 0.000027 ± 4.12E–05 | 0.688 |
| C10:1 | 0.001666 ± 0.00029 | 0.001967 ± 0.00029 | 0.002137 ± 0.00029 | 0.5232 |
| C10 | 0.001789 ± 0.00106A | 0.003201 ± 0.00106A | 0.007453 ± 0.00106B | 0.0071 |
| C10:1-OH | 0.000111 ± 8.21E–05 | 0.000216 ± 8.21E–05 | 0.000084 ± 8.21E–05 | 0.505 |
| C10-OH/C5-DC | 0.003078 ± 0.00064A | 0.007493 ± 0.00064B | 0.00505 ± 0.00064A | 0.0014 |
| C10-DC | 0.000147 ± 0.00021 | 0.000318 ± 0.00021 | 0.000431 ± 0.00021 | 0.6472 |
| C12/C6:1-DC | 0.002791 ± 0.00227A | 0.007378 ± 0.00227A | 0.016493 ± 0.00227B | 0.0035 |
| C12:1-OH | 0.001086 ± 0.00018 | 0.001156 ± 0.00018 | 0.000723 ± 0.00018 | 0.242 |
| C12-OH/C7-DC | 0.003139 ± 0.00049A | 0.011288 ± 0.00049B | 0.00781 ± 0.00049C | <0.0001 |
| C12-DC | 0.000598 ± 0.00022 | 0.00114 ± 0.00022 | 0.000667 ± 0.00022 | 0.1942 |
| C14-2 | 0.00167 ± 0.00035 | 0.000468 ± 0.00035 | 0.000754 ± 0.00035 | 0.0792 |
| C14-1 | 0.004514 ± 0.00101 | 0.002982 ± 0.00101 | 0.005786 ± 0.00101 | 0.1884 |
| C14/C8-DC | 0.00594 ± 0.00177A | 0.01144 ± 0.00177B | 0.013411 ± 0.00177A,B | 0.0293 |
| C14:1-OH | 0.003004 ± 0.00052 | 0.002908 ± 0.00052 | 0.002773 ± 0.00052 | 0.9517 |
| C14-OH | 0.001717 ± 0.0003A | 0.003957 ± 0.0003B | 0.00279 ± 0.0003A | 0.0008 |
| C14-DC | 0.000129 ± 5.31E–05 | 0.000091 ± 5.31E–05 | 0.00013 ± 5.31E–05 | 0.8424 |
| C14:2-DC | 0.000835 ± 0.00017 | 0.000533 ± 0.00017 | 0.00033 ± 0.00017 | 0.147 |
| C16:2 | 0.002158 ± 0.00028A | 0.000551 ± 0.00028B | 0.000904 ± 0.00028B | 0.0039 |
| C16-1 | 0.005395 ± 0.00061 | 0.003668 ± 0.00061 | 0.004487 ± 0.00061 | 0.1737 |
| C16/C10:1-DC | 0.014165 ± 0.0018 | 0.015667 ± 0.0018 | 0.013102 ± 0.0018 | 0.6118 |
| C16:1-OH | 0.00219 ± 0.00043 | 0.002451 ± 0.00043 | 0.001887 ± 0.00043 | 0.66 |
| C16-OH | 0.001667 ± 0.00023 | 0.002259 ± 0.00023 | 0.001562 ± 0.00023 | 0.1061 |
| C16-DC | 0.000046 ± 1.66E–05 | 0 ± 1.66E–05 | 0.000041 ± 1.66E–05 | 0.1423 |
| C18-2 | 0.006656 ± 0.00058A | 0.001787 ± 0.00058B | 0.002124 ± 0.00058B | <0.0001 |
| C18-1 | 0.015168 ± 0.00137A | 0.00866 ± 0.00137B | 0.008918 ± 0.00137B | 0.0086 |
| C18/12-1-DC | 0.005123 ± 0.00078 | 0.008004 ± 0.00078 | 0.006294 ± 0.00078 | 0.0646 |
| C18:2-OH | 0.001317 ± 0.00015A | 0.000648 ± 0.00015A,B | 0.000481 ± 0.00015B | 0.0049 |
| C18-1-OH | 0.002226 ± 0.0003 | 0.00235 ± 0.0003 | 0.001644 ± 0.0003 | 0.2535 |
| C18-OH | 0.000512 ± 0.0001 | 0.000767 ± 0.0001 | 0.000547 ± 0.0001 | 0.1843 |
| C18:1-DC | 0.000088 ± 2.89E–05 | 0.000048 ± 2.89E–05 | 0.000091 ± 2.89E–05 | 0.535 |
| C18-DC | 0.000128 ± 4.60E–05 | 0.000155 ± 4.60E–05 | 0.000094 ± 4.60E–05 | 0.6605 |
| C20:4 | 0.000615 ± 0.0000689A | 0.000358 ± 0.0000689A,B | 0.000305 ± 0.0000689B | 0.0173 |
| C20/C14:1-DC | 0.000286 ± 7.36E–05 | 0.00033 ± 7.36E–05 | 0.000092 ± 7.36E–05 | 0.0896 |
| C20-OH | 0.000288 ± 0.0000376A | 0.0001 ± 0.0000376B | 0.00004 ± 0.0000376B | 0.0015 |
| C22/C16:1-DC | 0.000097 ± 2.77E–05 | 0.000023 ± 2.77E–05 | 0 ± 2.77E–05 | 0.0698 |
Acylcarnitine levels (pmol·μg−1 of protein) were measured by MS in skeletal muscle after 10 weeks of feeding with LF, HF and HF + NaB diets (n = 5 per group). P values are reported for each acylcarnitine based upon a one-way anova. Those acylcarnitines with a P < 0.05 are shown in boldface. Significant differences between groups are designated by differences in superscripts based upon a post hoc Tukey's test. DC, dicarboxy; OH, hydroxyl.
In addition to analysing acylcarnitine levels, correlation matrix heat maps of pairwise comparisons of muscle acylcarnitines were generated in each dietary group based upon a method previously developed (Makowski et al., 2009). This allowed us to better understand the effects of diet on mitochondrial function. Correlation heat maps showed that highly correlated acylcarnitines in LF were also present in HF + NaB but not in HF (Figure 2). For example, in LF and HF + NaB, the strongest correlations occurred among the medium and long chain acylcarnitines (Figure 2), C8 through C20:4, producing similar patterns between LF and HF + NaB in the acylcarnitine microenvironment, whereas HF showed a substantially different acylcarnitine correlation matrix pattern and the absence of these correlations between the medium and long chain acylcarnitines. Collectively, these data indicate that the insulin-sensitizing and phenotypic effects of NaB did not involve changes in amino acid catabolism but rather involved changes in fatty acid catabolism, as categorized in previous studies (Koves et al., 2008), with β-oxidation and mitochondrial function being compromised in HF and improved by NaB. Interestingly, NaB treatment of mice fed HFD produced a similar relationship between different acylcarnitine species or ratios to that seen in LF, reflecting skeletal muscle mitochondrial function that closely resembles that seen in LF and reversing the HFD-induced incomplete β-oxidation and mitochondrial dysfunction seen in HF.
Figure 2.
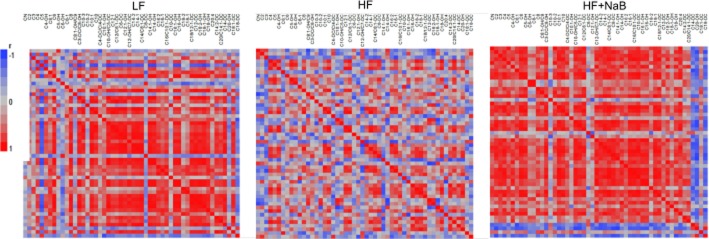
Correlation matrices of acylcarnitine pairwise comparisons. Pairwise comparisons correlation matrices were generated from acylcarnitine profiles of LF, HF and HF + NaB. Positive (red) and negative (blue) correlations between acylcarnitines or acylcarnitine ratios are shown within each group in heat maps.
Whole genome NMs in muscle
NaB is a known potent HDAC inhibitor, and dietary fat-induced differences in phenotype and physiology suggest that diet-induced alterations occur through an epigenetic mechanism. However, the specific genomic loci that are epigenetically regulated by dietary fat and NaB have yet to be identified. Whole genome NMs represent a technique used to identify potential genomic regions and specific loci that are epigenetically regulated by diet. Unlike ChIP-seq, which is only able to identify genomic loci that exhibit a single epigenetic modification, MNase-seq determines nucleosome occupancy and position, an epigenetic alteration that is dependent upon the combinatorial effects of all epigenetic modifications to a particular locus. Thus, MNase-seq allows identification of all epigenetically regulated genomic regions and loci irrespective of a particular epigenetic modification. Here, our MNase-seq experiments resulted in approximately 150 million to 173 million reads from each treatment group (Supporting Information Table S1), resulting in 12–14 × genome coverage by 147 bp nucleosome footprints, as calculated in (Valouev et al., 2011). This degree of coverage is recommended for unique identification of >90% of all nucleosomes (Zhang and Pugh, 2011) and was used previously to produce NM mouse tissue samples by MNase-seq (Li et al., 2011). Approximately 74% of sequenced reads, on average, aligned to the mouse mm9 genome (UCSC) when allowing up to two mismatches (GEO database accession GSE37913) (Figure 3A and Supporting Information Table S1). Whole genome sequenced read and nucleosome data can be found at http://www.purdue.edu/hhs/nutr/labs/henagan/nucleosomemaps/.
Figure 3.

Whole genome NMs in skeletal muscle. (A) Whole genome NMs were generated using MNase-seq in the skeletal muscle from C57BL/6J mice fed a LFD (LF), HFD (HF) or HFD plus NaB (HF + NaB), and a representative region in chromosome 5 of the mm9 genome, including the region around the TSS of Pgc1α or Pparg1cα, is shown. Additional regions of interest can be viewed at http://www.purdue.edu/hhs/nutr/labs/henagan/nucleosomemaps/. (B) Nucleosome number from genomics regions was determined using HOMER (Heinz et al., 2010). The percentage of nucleosomes within each genomic region in LF is presented. HF and HF + NaB regional number was compared to LF, and the distribution of differences for each is presented as regional changes in comparison to LF. (C) Distribution of nucleosomes across a gene fragment surrounding the transcription start site (TSS) from nucleotide −1000 to nucleotide +1000 relative to TSS in genes of the whole genome in skeletal muscle samples is shown as a smoothed graph for LF, HF and HF + NaB groups. The number of nucleosomes around the TSS from nucleotide −500 to nucleotide +500 within genes specific to differentially enriched metabolic GO terms (D) (see Table 2 for a list of these terms) or within known nuclear-encoded mitochondrial genes (E) [see Supporting Information Table S4 for a complete list of MitoCarta genes (Pagliarini et al., 2008)] in skeletal muscle from LF, HF and HF + NaB mice are shown as smoothed graphs. Note: the arrow in (C), (D) and (E) denotes the first peak in nucleosome occupancy upstream of the nucleosome-free region before the TSS.
We first performed read mapping to determine if NaB treatment in the diet epigenetically regulates specific genomic regions. We were able to identify several regions of highly conserved nucleosome density that occurred independently of treatment, including the 5′ untranslated region (UTR), 3′ UTR and the transcription termination site (TTS) (Figure 3B). Conversely, dietary alterations, including NaB treatment, induced regional variation in promoter (LF vs. HF, P = 0.003; LF vs. HF + NaB, P = 0.021; HF vs. HF + NaB, P = 0.569), exonic (LF vs. HF, P < 0.001; LF vs. HF + NaB, P = 0.100; HF vs. HF + NaB, P < 0.001), intronic (LF vs. HF, P = 0.005; LF vs. HF + NaB, P < 0.001; HF vs. HF + NaB, P = 0) and intergenic (LF vs. HF, P < 0.001; LF vs. HF + NaB, P < 0.001; HF vs. HF + NaB, P = 0) regions (Figure 3B). Interestingly, NaB-induced changes in nucleosome density within these regions were distributed in a way that preserved the relative genomic distribution pattern and produced a pattern similar to that observed in LF (Figure 3B). Conversely, HFD-induced changes in nucleosome density were distributed more distinctly across the genome compared with LF and HF + NaB, with the most notable density changes occurring within the promoter and exonic regions (Figure 3B), which are important in regulating transcriptional activity of a gene (Weiner et al., 2010; Zhou et al., 2011). Variation in nucleosome density in the promoters and exons, coupled with the lack of change at the 5′ and 3′ UTRs and the TTS, suggest a possible diet-dependent effect on gene expression that occurs through differences in transcriptional rate rather than mRNA degradation rate or transcript stability. Thus, it is interesting to note that nucleosome number directly downstream of the TSS in HF + NaB mimicked that seen in LF (P = 0.119), whereas HF showed a decrease in nucleosome number in the region from the 0 to +250 nt (P < 0.001) (Figure 3C). Overall, these data reveal striking similarities between LF and HF + NaB but not HF in NMs, with exaggerated differences between dietary groups observed around the TSS. These data suggest that similar epigenetic regulation of specific genomic regions may result in similar phenotypes and physiologies, such as that seen in LF and HF + NaB but not HF.
We then aimed to determine if NaB treatment epigenetically regulates groups of genes with known related functions. To functionally characterize genes with differential nucleosome occupancy between treatment groups, we defined the biological processes of functionally enriched annotations using GO classification using HOMER (Heinz et al., 2010). Nineteen GO terms were differentially enriched across dietary groups, including five metabolic terms (Table 2). Several metabolic genes identified within the metabolic GO terms (Supporting Information Table S2) showed the same nucleosome density between LF and HF + NaB, which was different from that of HF (Supporting Information Table S3). Because we identified these GO pathways as being differentially enriched between dietary treatment groups and LF and HF + NaB exhibited similarities in fibre type composition and complete β-oxidation compared with HF, which suggest a role of metabolic genes in determining a lean and insulin sensitive versus an obese and IR phenotype and physiology, we reasoned that these identified genes may serve as future candidate genes that are epigenetically regulated to alter muscle mitochondrial adaptation and metabolism. We have also shown that NaB differentially regulated nucleosome occupancy specifically around the TSS (Figure 3C), and this regulation may be important in determining gene expression. Thus, we examined the nucleosome occupancy surrounding the TSS only within the five significantly enriched GO metabolic terms (Table 2).
Table 2.
Gene ontology (GO) analysis
| GO | GO term | Number of genes in term | P-value | ||
|---|---|---|---|---|---|
| LF | HF | HF + NaB | |||
| GO:0065007 | Biological regulation | 8663 | 0.078 | 0.084 | 0.038 |
| GO:0016043 | Cellular component organization | 2761 | 0.040 | 0.094 | 0.195 |
| GO:0071840 | Cellular component organization or biogenesis | 2885 | 0.029 | 0.070 | 0.153 |
| GO:0005737 | Cytoplasm | 7996 | 0.220 | 0.227 | 0.034 |
| GO:0005622 | Intracellular | 10855 | 0.073 | 0.059 | 0.009 |
| GO:0043229 | Intracellular organelle | 9199 | 0.128 | 0.121 | 0.024 |
| GO:0044424 | Intracellular part | 10613 | 0.108 | 0.089 | 0.017 |
| GO:0035556 | Intracellular signal transduction | 1008 | 0.067 | 0.049 | 0.056 |
| GO:0008152 | Metabolic process | 7311 | 0.064 | 0.056 | 0.020 |
| GO:0031324 | Negative regulation of cellular metabolic process | 1056 | 0.056 | 0.041 | 0.047 |
| GO:0010605 | Negative regulation of macromolecule metabolic process | 1074 | 0.053 | 0.121 | 0.044 |
| GO:0009892 | Negative regulation of metabolic process | 1177 | 0.036 | 0.086 | 0.029 |
| GO:0004984 | Olfactory receptor activity | 1091 | 0.063 | 0.050 | 0.057 |
| GO:0043226 | Organelle | 9223 | 0.123 | 0.117 | 0.023 |
| GO:0010604 | Positive regulation of macromolecule metabolic process | 1404 | 0.143 | 0.104 | 0.045 |
| GO:0050794 | Regulation of cellular process | 7810 | 0.064 | 0.051 | 0.019 |
| GO:0042221 | Response to chemical stimulus | 1873 | 0.036 | 0.059 | 0.070 |
| GO:0006950 | Response to stress | 1644 | 0.025 | 0.015 | 0.058 |
| GO:0055085 | Transmembrane transport | 648 | 0.060 | 0.047 | 0.053 |
Gene ontology (GO) analysis of MNase-seq data was performed using HOMER (Heinz et al., 2010). The total number of genes for those GO terms that were statistically and differentially enriched is shown. For each differentially enriched GO term, the GO ID is shown, as well as the number of genes within the term. For each dietary group, the P-values are also presented. Metabolic GO terms are shown in boldface and highlighted.
Similar to whole genome differences (Figure 3C), detailed analysis of nucleosome occupancy surrounding the TSS in metabolic genes showed that the distribution of TSS nucleosomes in HF was decreased at and immediately following the TSS compared with LF (P = 0.007), whereas HF + NaB followed a similar pattern in nucleosome positioning and periodicity around the TSS when compared to LF (P = 0.414) (Figure 3D). Although we identified five differentially enriched metabolic pathways, changes in nucleosome occupancy surrounding the TSS in the genes of these pathways were similar to what we observed at the whole genome level. These data indicate that regulation of nucleosome occupancy in this genomic region appears to play a role in determining phenotype and physiology; however, these genes alone are not sufficient to determine the observed skeletal muscle differences in LF or HF + NaB and HF groups.
Because we observed similarities in skeletal muscle mitochondrial adaptions between LF and HF + NaB but not HF, and skeletal muscle mitochondrial number and function is important in determining insulin sensitivity, we next examined the potential epigenetic regulation of known nuclear-encoded mitochondrial genes identified in MitoCarta (Pagliarini et al., 2008) (Supporting Information Table S4) in determining LF or HF + NaB differences compared with HF. Examination of nucleosome number at the TSS in only nuclear-encoded mitochondrial genes (Pagliarini et al., 2008) (Supporting Information Table S4) revealed that LF and HF + NaB exhibited similar nucleosome numbers at and around the TSS, whereas nucleosome number tended to decrease in HF from the 0 to +250 nt region (P = 0.199) (Figure 3E). This was similar to the whole genome and metabolic pathway differences in occupancy (Figure 3C and D). Because there was a significant decrease in nucleosome number at the 0 to +250 nt region in the whole genome, enriched metabolic and the nuclear-encoded mitochondrial genes, these data suggest that decrease in nucleosome occupancy in this region may play a role in determining obesity and IR, and this mechanism is conserved across the genome rather than specific to a set of genes.
Additionally, our MNase-seq results showed a treatment-specific difference in nucleosome periodicity between the −300 nt and −180 nt within the nuclear-encoded mitochondrial genes (Figure 3E). This pattern was distinct from that observed around the TSS in the whole genome (Figure 3C) or only metabolic genes (Figure 3D), suggesting that epigenetic regulation of nuclear-encoded mitochondrial genes in this region of the gene may be targeted and may be a common, specific mechanism of gene regulation for nuclear-encoded mitochondrial genes. As this region is directly upstream of the nucleosome-free region at the TSS, changes in periodicity or number of nucleosomes here may be indicative of alterations in −1 nucleosome positioning. As distinct periodicity was seen in the region of the −1 nucleosome in HF compared with LF and HF + NaB only in the nuclear-encoded mitochondrial genes, it appears that nucleosome positioning but not number may be important in determining gene expression of the nuclear-encoded mitochondrial genes.
NMs and transcription
Important nuclear-encoded mitochondrial genes known to regulate skeletal muscle mitochondrial adaptation include those related to the PPAR signalling pathway. Interestingly, comparison of our NMs to previously published microarray data (GEO accession series GSE8524) from quadriceps of C57BL/6J mice fed LFD or HFD revealed that significantly up- or down-regulated genes involved in muscle structure and function exhibited differential nucleosome density consistent with changes in gene expression (Supporting Information Fig. S4A and B). DAVID pathway analysis (Huang et al., 2009) of differentially expressed transcripts identified 16 significantly enriched KEGG pathways; however, the PPAR signalling pathway was the only pathway that was significant at the 5% FDR level (Table 2). To validate the comparison of our NMs with previously published microarrays, real-time PCR was performed in our muscle samples in the present study to measure mRNA expression of representative genes involved in the PPAR signalling pathway (Supporting Information Fig. S4C).
PPAR signalling is important in regulating mitochondrial adaptation in muscle, and our present findings indicate that nuclear-encoded mitochondrial genes may exhibit differential −1 nucleosome occupancy (Figure 3E). Thus, we performed a more targeted analysis of nucleosome positioning in the region surrounding the TSS within several nuclear-encoded mitochondrial genes. These included Pparγ, which acts as an important mediator of insulin-stimulated glucose uptake in muscle (Verma et al., 2004) and driver of type 1 oxidative fibre formation (Wang et al., 2004); Nrf1, which mediates mitochondrial biogenesis and function (Evans and Scarpulla, 1990; Wu et al., 1999); Mef2b, whose expression increases type 1 oxidative fibres in muscle (Wu et al., 2000; Fernandez-Marcos and Auwerx, 2011); and Pgc1α, an important transcriptional co-activator that coordinates gene expression from the nuclear and mitochondrial genomes in response to environmental cues in order to determine muscle mitochondrial adaptation (Evans and Scarpulla, 1990; Wu et al., 1999; Verma et al., 2004). All targeted genes showed diet-specific alterations in −1 nucleosome positioning that corresponded to diet-induced changes in gene expression, as measured in our skeletal muscle samples in the present study (Figure 4). Specifically, LF and HF + NaB, which showed similar Pparγ mRNA expression levels, also exhibited repositioning of their −1 nucleosome centres downstream of that seen in HF, which exhibited decreased Pparγ expression compared with LF or HF + NaB (Figure 4A). Surprisingly, −1 nucleosome positioning in Nrf1 was not different between any dietary groups, consistent with the lack of statistically significant change in Nrf1 expression between groups (Figure 4B). However, Mef2b expression was significantly increased in HF + NaB compared with HF and tended to increase compared with LF (P = 0.07; Figure 4C). Consistent with gene expression changes, positions of −1 nucleosome centres were similar between LF and HF, with the −1 nucleosome being positioned downstream in the HF + NaB group (Figure 4C).
Figure 4.

Nucleosome positioning in nuclear-encoded mitochondrial genes. Expression of (A) peroxisome proliferator-activated receptor gamma (Pparγ), (B) nuclear respiratory factor 1 (Nrf1) and (C) myocyte enhancer factor 2b (Mef2b) in skeletal muscle from LF, HF and HF + NaB mice was quantified by qRT-PCR and expressed as fold change using the ΔΔCt method. *P < 0.05, significant difference between groups; one-way anova and Tukey's test. Below each graph, nucleosome positions are depicted within −500 to +500 of the transcription start site (TSS) for Pparγ, Nrf1 and Mef2b. Each bar represents the nucleosome centre in LF, HF and HF + NaB mice. A summary of changes in gene expression and the −1 nucleosome centre position in LF and HF + NaB in comparison to HF is shown for each gene in the inset table.
Pgc1α has recently been shown to be epigenetically regulated by DNA demethylation in response to fatty acid treatment, and Pgc1α expression has been shown to be induced by NaB. Both alterations occur in association with skeletal muscle mitochondrial adaptation. However, it is unknown if Pgc1α is epigenetically regulated by NaB in vivo in association with mitochondrial adaptation or the upstream mechanisms that result in differential DNA methylation status. Careful examination of the Pgc1α revealed that the −1 nucleosome position within Pgc1α differed in response to dietary treatment, similarly to the pattern seen in Pparγ. In HF, the −1 nucleosome was centred at nucleotide −273 nt (Figure 5A); in LF, the −1 nucleosome was centred at −326 nt (Figure 5A); and in HF + NaB, it was centred at the −192 nt (Figure 5A). Interestingly, in LF and HF + NaB, the −1 nucleosomes were centred almost equidistant from the known regulatory −260 nt methylation site in Pgc1α (Barrès et al., 2009), whereas the nucleosome centre in HF was 13 nt upstream of the site (Figure 5A).
Figure 5.

Pgc1α nucleosome positioning, gene expression and correlation with acylcarnitines. (A) Distribution of nucleosome centres within a region surrounding the transcription start site (TSS, −500 to +500 nucleotides) in the Pgc1α in skeletal muscle from LF HFand HF + NaB groups. The grey region represents the 0 to +250 region where HF shows the largest decrease in the number of nucleosomes compared with LF and HF + NaB (see Figure 4B, D and E). The region of the −1 nucleosome within the Pgc1α is magnified with the regulatory methylation site at −260 nucleotide marked as Me. The table below shows the range of nucleosomal DNA within chromosome 5, where Pgc1α is encoded, for −1 nucleosome in each dietary group. (B) −1 nucleosome position in Pgc1α in each treatment group is shown in relation to qPCR primers (ecliptic circles). −1 nucleosome position was determined in individual skeletal muscle samples (n = 5) from each treatment group by qPCR and a representative gel image is shown for mononucleosomal and genomic input DNA. DNA methylation was determined by MSP in individual skeletal muscle samples (n = 5) from each treatment group and a representative gel image is shown for products of the primer pair specific to methylation at the −260 nucleotide and unmethylated gDNA at the −260 nucleotide. For both qPCR and MSP, densitometry was performed for each individual sample and the average values were graphed for LF (white), HF (grey) and HF + NaB (black). (C) Pgc1α gene expression in LF (white), HF (grey) and HF + NaB (black) was quantified in skeletal muscle by qRT-PCR using the ΔΔCt method and is expressed as fold change relative to HF. (D) Pairwise correlation matrices for PgcC1α expression and acylcarnitines are shown to the right. Red represents a positive correlation and blue a negative correlation. Asterisk (*) denotes a significant difference between groups by one-way anova and post hoc Tukey's test at P < 0.05. Double asterisk (**) denotes a significant difference at P < 0.01.
The −1 nucleosome position within the Pgc1α was further characterized and confirmed by qPCR followed by densitometry (n = 5 per group). qPCR analysis revealed that nucleosome occupancy in HF was ∼1.5-fold higher surrounding the −260 nt compared with LF and HF + NaB was ∼1.3-fold higher than LF (Figure 5B). The percentage of methylation occurring at the −260 nt was also significantly increased in HF compared with LF and HF + NaB (Figure 5B). Repositioning of the −1 nucleosome in LF and HF + NaB away from the −260 methylation site also corresponded with increased Pgc1α mRNA expression in these groups when compared to HF (Figure 5C), suggesting that diet-induced −1 nucleosome positioning may be an important and common epigenetic mechanism that regulates expression of genes involved in directing muscle mitochondrial adaptation and may be an event that alters DNA methylation.
As Pgc1α plays an important role in regulating β-oxidation of fatty acids, we also performed pairwise correlations between Pgc1α mRNA expression and acylcarnitine levels. Although we expected that the pattern would be similar between LF and HF + NaB, we were surprised to see that few correlations between acylcarnitines and Pgc1α mRNA expression were common between these two groups (Figure 5D). However, both LF and HF + NaB had a higher number of positive correlations between acylcarnitine levels and Pgc1α mRNA expression than HF; most acylcarnitine levels were negatively correlated with Pgc1α mRNA expression in HF (Figure 5D). The positive correlations in common between LF and HF + NaB include C6:1, C10-2, C16:2, C16-1, C16/C10:1-DC, C18-1, C18-OH and C20:4 (Figure 5D). There was one negative correlation between Pgc1α expression and C18-DC in common between LF and HF + NaB (Figure 5D).
Discussion and conclusions
NaB administration has been shown to have a range of health benefits, being effective in inducing apoptosis of cancer cells (Chopin et al., 2002) and improving insulin sensitivity (Gao et al., 2009; Berni Canani et al., 2012; Lin et al., 2012). The anti-diabetogenic effect of NaB and its use in clinical trials (Berni Canani et al., 2012) makes it an ideal candidate for the treatment of type 2 diabetes. In addition to its anti-diabetic properties and similar to a previous study of NaB treatment by Gao et al., 2009, we found in the present study that in addition to improving insulin sensitivity, dietary NaB treatment is able to prevent HFD-induced obesity. Specifically, we showed that 10 weeks of NaB treatment, in spite of the effects of the HFD, leads to a phenotype and insulin sensitivity strikingly similar to that seen in mice fed an LFD. In addition, our whole genome NMs provide a potential epigenetic mechanism whereby NaB acts to alter skeletal muscle mitochondrial adaptations that may contribute to its insulin-sensitizing and anti-obesogenic effects.
The effects of NaB are likely to be due to its HDAC inhibitor activity, as histone acetylation directly regulates the chromatin structure through alterations in nucleosome positioning (Kingston and Narlikar, 1999). Similar anti-obesity and anti-diabetic effects have been induced by related HDAC inhibitors such as trichostatin A (Crunkhorn et al., 2007) and MS275 and SAHA (Galmozzi et al., 2013), elaborated below. However, the specific gene targets and epigenetic silencing or up-regulation of gene expression by NaB that leads to its beneficial health effects remain unclear. Interestingly, HDAC inhibition and resulting histone modifications are important regulatory mechanisms of skeletal muscle oxidative metabolism that have recently been shown to be an effective treatment for type 2 diabetes (Christensen et al., 2011). HDAC inhibition increases skeletal muscle oxidation (Galmozzi et al., 2013) and prevents transcriptional repression of genes that regulate skeletal muscle glucose uptake and insulin sensitivity (Ren et al., 1995) (McGee et al., 2008). HDAC inhibition has also been shown to up-regulate expression of PGC1α (Crunkhorn et al., 2007) and PPARγ (Gao et al., 2006), and HDACs have been shown to repress Mef2 (Black and Olson, 1998; Gao et al., 2009; McGee and Hargreaves, 2010). Consistent with these previous studies, we also found that NaB treatment up-regulated expression of Pgc1α and PPARγ, although we did not find an increase in Mef2b expression in the skeletal muscle. Our data further suggest that NaB may epigenetically regulate these nuclear-encoded mitochondrial genes through a common mechanism of −1 nucleosome positioning. Individually and collectively, these particular nuclear-encoded mitochondrial genes play an important role in regulating mitochondrial biogenesis and function (Onyango et al., 2010; Galmozzi et al., 2013), β-oxidation (McGee and Hargreaves, 2010; Galmozzi et al., 2013) and insulin sensitivity (Christensen et al., 2011; Galmozzi et al., 2013).
Importantly, nuclear-mitochondrial epistasis that affects mitochondrial function may be inherited and contribute to phenotypic and physiological variation in subsequent generations (Burton and Barreto, 2012). Given that nuclear-mitochondrial protein incompatibilities disrupt mitochondrial transcription, translation and downstream adaptation, it is also plausible that epigenetic mechanisms controlling nuclear-encoded mitochondrial gene expression are important determinants of environmentally induced mitochondrial adaptation. These epigenetic modifications and mitochondrial adaptations may also be inherited mitotically or transgenerationally to affect obesity and IR. Indeed, recent studies show that HFD-fed dams produced offspring that are more susceptible to obesity and type 2 diabetes (Tamashiro et al., 2009; Khalyfa et al., 2013). Maternal diet can also modulate the risk of obesity and type 2 diabetes in the offspring by affecting DNA methylation and histone methylation and acetylation patterns in the offspring (Gallou-Kabani and Junien, 2005; Sinclair et al., 2007). Additionally, the nuclear-encoded mitochondrial gene, Pgc1α, has recently been shown to be epigenetically regulated via DNA methylation of the −260 nt in muscle, being hypomethylated during exercise and hypermethylated in type 2 diabetic muscle (Barrès et al., 2009; 2012,).
Pgc1α is a nuclear-encoded gene that acts to up-regulate and co-activate other nuclear-encoded mitochondrial genes, such as PPARγ, NRF1, MEF2b, as well as co-active genes encoded within the mitochondrial genome. Thus, PGC1α is an important regulator of mitochondrial adaptation in response to diet (Knutti and Kralli, 2001; Fernandez-Marcos and Auwerx, 2011). Consistent with previous publications, we found that Pgc1α was down-regulated by HFD feeding (Sparks et al., 2005) and up-regulated by NaB treatment (Gao et al., 2009). Here, examination of nucleosome positions surrounding the TSS in Pgc1α revealed that the −1 nucleosome, an important regulator of gene transcription and expression (Portela and Esteller, 2010), was centred at the −273 nt in the HF muscle, only 13 nt away from the known regulatory −260 nt methylation site in Pgc1α (Barrès et al., 2009). Methylation of cytosine at this position has been shown to be sufficient to decrease PGC1α transcription and mitochondrial number in muscle (Barrès et al., 2009). Methylation here is induced by fatty acids and requires recruitment of DNA methyltransferase 3b (DNMT3b) (Barrès et al., 2009), which is dependent upon the nucleosome presence at the DNA locus (Takeshima et al., 2006). Although our MNase-seq and qPCR results showed that the nucleosome edges in LF and HF + NaB overlapped with those of the −1 nucleosome in HF, such that there was not a significant difference between the densitometry results, it is important to note that DNMT3b binding to the nucleosomal DNA occurs at the core region (Takeshima et al., 2006). Additionally, our results show a significant increase in DNA methylation at the −260 nt in HF compared with both LF and HF + NaB in the present study. Thus, the close proximity of the nucleosome centre in HF, but not LF and HF + NaB, to the regulatory −260 nt in Pgc1α, the increase in DNA methylation and the decrease in gene expression in HF compared with LF or HF + NaB, suggests that nucleosome positioning at this locus may be an important determinant of Pgc1α expression. Alterations in −1 nucleosome position within Pparγ, Nrf and Mef2b also corresponded to changes in their mRNA expression, further supporting a regulatory role for the −1 nucleosome in nuclear-encoded mitochondrial genes.
Although we show a difference in DNA methylation, the specific epigenetic modifications that occur upstream of changes in nucleosome positioning within the nuclear-encoded mitochondrial genes are still unknown. However, we speculate that NaB-induced differences in nucleosome positioning may be regulated not only by its HDAC inhibitor activity but also by the substrate availability for histone post-translational and DNA modifications. Specifically, metabolites, resulting from metabolism of dietary macronutrients, have the potential to provide cellular pools of acetyl, methyl and phosphate groups for epigenetic modifications (Katada et al., 2012). Interestingly, it has been noted that genetic divergence in nuclear-encoded loci that function in mitochondrial adaptation may be the result of adaptive energy metabolism or act as a compensatory mechanism in response to defective mitochondrial functioning (Meiklejohn et al., 2013). Although the differences in composition between the low fat chow and purified HFDs did not allow us to determine if dietary fat content alone specifically regulates nucleosome positioning, we show that muscle acylcarnitine profiles, a measure of mitochondrial function and possible indicator of the cellular acetyl pool (Wellen et al., 2009), differed in HFD-fed mice when compared to both LF and HF + NaB mice. Acylcarnitines are formed from the addition of a carnitine to an intermediate of fatty acid oxidation, and measurement of the various acylcarnitines is a reflection of the completeness of β-oxidation (Koves et al., 2008; Makowski et al., 2009; Henagan et al., 2014). Hence, acylcarnitine levels and profiles are used as biomarkers for detection of mitochondrial function in regards to fatty acid β-oxidation (Violante et al., 2010), with accumulation of long and medium chain acylcarnitines with respect to short chain species being observed during skeletal muscle IR and being indicative of mitochondrial dysfunction (Koves et al., 2008; Henagan et al., 2014). In the present study, HF mice exhibited increases in long and medium chain acylcarnitines and decreases in acetyl-CoA. Interestingly, NaB was able to prevent the HFD-induced mitochondrial dysfunction and incomplete β-oxidation and create an acylcarnitine profile similar to that seen in LFD-fed mice.
Potential limitations for the present study are related to the experimental system. Each experimental group contained 10 mice, which may make it slightly more difficult to generalize the results. However, the C57BL/6J strain is well characterized and commonly used for studies of obesity and diabetes in mice with numbers similar or lower to those used herein for both phenotypic/metabolic and epigenetic studies (Li et al., 2011; Henagan et al., 2014). Additionally, caution is warranted when generalizing the results to other mouse strains and rodents or to humans. Firstly, the C57BL/6J strain lacks a functional nicotinamide nucleotide transhydrogenase (NNT) that normally catalyses the reduction of NADP+, resulting in abnormalities in mitochondrial redox states (Freeman et al., 2006; Ronchi et al., 2013). However, the C57BL/6J mice are more susceptible to diet-induced obesity than NNT-wild-type mice (Nicholson et al., 2010), suggesting that the present effects of HDAC inhibition by NaB are potentially more conservative than would be seen in other mouse strains. Similarly, it is possible that the present effects of NaB on HDAC may not extend to humans. However, NaB is emerging as an important tool for the potential regulation of HDAC in many human systems, including cancer therapy and chemoprevention, anti-inflammatory effects, obesity, IR, cardiovascular disease, the immune system, inherited disorders, neuroprotection and stem cells (Berni Canani et al., 2012), adding credence to its potential use as an epigenetic modulator of Pgc1α in humans. NaB, which has already been approved for use in clinical trials, may seem a more palatable candidate than other HDAC inhibitors, as butyrate is naturally produced during fermentation of dietary fibre by gut bacteria and is a natural by-product of β-oxidation of fatty acids intracellularly. Previous studies have shown that dietary NaB is absorbed in the upper gut, with butyrate absorption, distribution and metabolism following predicted metabolism of other short chain fatty acids (Hayes et al., 1994). However, NaB treatment has been shown to alter species of gut bacteria, increasing Bifidobacterium and decreasing lactic acid-producing species (Vidrine et al., 2014). These alterations in gut bacteria may contribute to the beneficial anti-obesogenic and anti-diabetic effects of NaB treatment.
In conclusion, this study is the first to provide in vivo whole genome NMs in muscle in response to NaB treatment and in an obese, IR or lean, insulin-sensitive state. Our findings provided evidence that NaB's insulin-sensitizing and anti-obesogenic mechanism of action occurred through −1 nucleosome positioning within nuclear-encoded mitochondrial genes, which may be particularly important in determining muscle mitochondrial function and oxidative capacity, obesity and IR. We have provided new mechanistic insights into NaB as an effective pharmacological modulator of obesity and IR.
Acknowledgments
We thank software developer Christopher L. Burriss at Azamba Consulting Group for providing custom scripts and for help in conducting bioinformatics analyses along with Dr Chris Benner, Director of the Integrative Genomics and Bioinformatics Core at the Salk Institute. This work was funded by NIH NIDDK 5T32-DK064584-09 (T. M. H.) and NIH COBRE (8P20-GM103528-07) and NORC (5P30-DK072476-07) centre grants.
Glossary
- DNMT3b
DNA methyltransferase 3b
- GO
genome ontology
- GTT
glucose tolerance test
- HDAC
histone deacetylase
- HF
high fat
- HF + NaB
high-fat diet plus sodium butyrate
- HFD
high-fat diet
- IHC
immunohistochemistry
- IR
insulin resistance
- ITT
insulin tolerance test
- LF
low fat
- LFD
low-fat diet
- Mef2b
myocyte enhancer factor 2b
- MNase
microccocal nuclease
- MSP
methylation-specific PCR
- NaB
sodium butyrate
- NNT
nicotinamide nucleotide transhydrogenase
- NM
nucleosome map
- Nrf1
nuclear respiratory factor 1
- nt
nucleotides
- PGC1α
peroxisome proliferator-activated receptor gamma co-activator 1 alpha
- RER
respiratory exchange ratio
- TTS
transcription termination site
- UTR
untranslated region
Author contributions
B. S. and J. Y. helped with study design, data interpretation and writing of the manuscript. A. M. N. helped perform experiments and edited the manuscript. Z. F. helped with statistical analyses, interpreted data and edited the manuscript. P. P. D. and N. R. L. evaluated and revised the manuscript. T. M. H. designed, performed and funded all experiments, analysed and interpreted data, and wrote the manuscript.
Conflict of interest
None.
Supporting Information
Additional Supporting Information may be found in the online version of this article at the publisher's web-site:
Figure S1 MNase-seq methodology. The methods for mononucleosomal DNA isolation and high throughput sequencing and analysis are roughly outlined.
Figure S2 Absolute fat and muscle masses. C57BL6/J mice were fed a LFD (LF), HFD (HF) or a HFD plus NaB (HF + NaB) and body fat (A) and muscle mass (B) were assessed weekly. (C) Mice were killed after 10 weeks on the diets and inguinal white adipose tissue (WAT) (LF n = 10, HF n = 9 and HF + NaB n = 10) (D) and epididymal (LF n = 9, HF n = 10 and HF + NaB n = 10) (E) WAT fat pads were dissected and weighed and are presented as the ratio of subcutaneous (inguinal WAT) to visceral (epididymal WAT) fat. Data are means ± SEM. *** P < 0.0001, significant difference between groups; one-way anova and Tukey's test.
Figure S3 Fibre type and mitochondrial function. (A) Fibre typing of skeletal muscle is shown at 20× for each treatment group. The percentage of positive cells (teal), representing type 1 fibres, was calculated after an analysis of 3–5 areas over 2 sections in 4 animals each per group and is shown in the bar graph as means ± SEM. * P < 0.05, significant difference between groups; one-way anova and Tukey's test. (B) Short and medium chain acylcarnitine levels or ratios were measured and only those acylcarnitines or ratios that were significantly different between groups are graphed as means ± SEM for LF (white), HF (grey) and HF + NaB (black). Please note that levels for C6:1, C6-OH, C8-1 and C14-OH are graphed on the right y axis. All other values are graphed on the left y axis. The results of statistical analyses for graphed acylcarnitine species and ratios are shown in Table 2.
Figure S4 Comparison of MNase-seq and microarrays. Differences in nucleosome number (LF – HF; black) were compared to fold changes in transcript expression (LF/HF; grey) (de Wilde et al., 2008) of (A) muscle structure, contraction and metabolic genes and (B) PPAR signalling genes. Note that the PPAR signalling pathway was found using DAVID pathway analysis to be enriched with differentially expressed genes in HF compared to LF (Huang et al., 2009). (C) Comparison of expression from selected nuclear-encoded mitochondrial genes associated with the PPAR signalling pathway as measured by qRT-PCR (open bars) in skeletal muscle samples from the present study and by Affymetrix array from the previous study (hatched bars) (de Wilde et al., 2008) are shown. Of note, previous microarrays were only performed in C57BL6/J mice fed a LFD or HFD. Results are presented as means ± SEM. See Supporting Information Table S6 for definitions of gene symbols.
Table S1 Reads.
Table S2 Differentially enriched metabolic GO genes.
Table S3 Targeted analysis of metabolic genes.
Table S4 MitoCarta genes.
Table S5 Primer sequences.
Table S6 Microarray gene symbol definitions.
Appendix S1 Supplementary methods.
References
- Albert I, Mavrich TN, Tomsho LP, Qi J, Zanton SJ, Schuster SC, et al. Translational and rotational settings of H2A.Z nucleosomes across the Saccharomyces cerevisiae genome. Nature. 2007;446:572–576. doi: 10.1038/nature05632. [DOI] [PubMed] [Google Scholar]
- Alexander SPH, Benson HE, Faccenda E, Pawson AJ, Sharman JL. Spedding M, et al. The Concise Guide to PHARMACOLOGY 2013/14: Enzymes. Br J Pharmacol. 2013;170:1797–1867. doi: 10.1111/bph.12451. [DOI] [PMC free article] [PubMed] [Google Scholar]
- Barrès R, Osler ME, Yan J, Rune A, Fritz T, Caidahl K, et al. Non-CpG methylation of the PGC-1α promoter through DNMT3B controls mitochondrial density. Cell Metab. 2009;10:189–198. doi: 10.1016/j.cmet.2009.07.011. [DOI] [PubMed] [Google Scholar]
- Barrès R, Yan J, Egan B, Treebak Jonas T, Rasmussen M, Fritz T, et al. Acute exercise remodels promoter methylation in human skeletal muscle. Cell Metab. 2012;15:405–411. doi: 10.1016/j.cmet.2012.01.001. [DOI] [PubMed] [Google Scholar]
- Berni Canani R, Di Costanzo M, Leone L. The epigenetic effects of butyrate: potential therapeutic implications for clinical practice. Clin Epigenetics. 2012;4:4. doi: 10.1186/1868-7083-4-4. [DOI] [PMC free article] [PubMed] [Google Scholar]
- Black BL, Olson EN. Transcriptional control of muscle development by myocyte enhancer factor-2 (Mef2) proteins. Annu Rev Cell Dev Biol. 1998;14:167–196. doi: 10.1146/annurev.cellbio.14.1.167. [DOI] [PubMed] [Google Scholar]
- Bouchard C. Genetics of human obesity: recent results from linkage studies. J Nutr. 1997;127:1887S–1890S. doi: 10.1093/jn/127.9.1887S. [DOI] [PubMed] [Google Scholar]
- Burton RS, Barreto FS. A disproportionate role for mtDNA in Dobzhansky–Muller incompatibilities? Mol Ecol. 2012;21:4942–4957. doi: 10.1111/mec.12006. [DOI] [PubMed] [Google Scholar]
- Chopin V, Toillon R-A, Jouy N, Bourhis XL. Sodium butyrate induces P53-independent, Fas-mediated apoptosis in MCF-7 human breast cancer cells. Br J Pharmacol. 2002;135:79–86. doi: 10.1038/sj.bjp.0704456. [DOI] [PMC free article] [PubMed] [Google Scholar]
- Christensen D, Dahllöf M, Lundh M, Rasmussen D, Nielsen M, Billestrup N, et al. Histone deacetylase (HDAC) inhibition as a novel treatment for diabetes mellitus. Mol Med. 2011;17:378–390. doi: 10.2119/molmed.2011.00021. [DOI] [PMC free article] [PubMed] [Google Scholar]
- Crunkhorn S, Dearie F, Mantzoros C, Gami H, da Silva WS, Espinoza D, et al. Peroxisome proliferator activator receptor γ coactivator-1 expression is reduced in obesity: potential pathogenic role of saturated fatty acids and p38 mitogen-activated protein kinase activation. J Biol Chem. 2007;282:15439–15450. doi: 10.1074/jbc.M611214200. [DOI] [PubMed] [Google Scholar]
- DeFronzo RA, Tripathy D. Skeletal muscle insulin resistance is the primary defect in type 2 diabetes. Diabetes Care. 2009;32(Suppl. 2):S157–S163. doi: 10.2337/dc09-S302. [DOI] [PMC free article] [PubMed] [Google Scholar]
- Dudley KJ, Sloboda DM, Connor KL, Beltrand J, Vickers MH. Offspring of mothers fed a high fat diet display hepatic cell cycle inhibition and associated changes in gene expression and DNA methylation. PLoS ONE. 2011;6:e21662. doi: 10.1371/journal.pone.0021662. [DOI] [PMC free article] [PubMed] [Google Scholar]
- Eriksson J, Franssila-Kallunki A, Ekstrand A, Saloranta C, Widén E, Schalin C, et al. Early metabolic defects in persons at increased risk for non-insulin-dependent diabetes mellitus. N Engl J Med. 1989;321:337–343. doi: 10.1056/NEJM198908103210601. [DOI] [PubMed] [Google Scholar]
- Evans MJ, Scarpulla RC. NRF-1: a trans-activator of nuclear-encoded respiratory genes in animal cells. Genes Dev. 1990;4:1023–1034. doi: 10.1101/gad.4.6.1023. [DOI] [PubMed] [Google Scholar]
- Fernandez-Marcos PJ, Auwerx J. Regulation of PGC-1α, a nodal regulator of mitochondrial biogenesis. Am J Clin Nutr. 2011;93:884S–890S. doi: 10.3945/ajcn.110.001917. [DOI] [PMC free article] [PubMed] [Google Scholar]
- Freeman HC, Hugill A, Dear NT, Ashcroft FM, Cox RD. Deletion of nicotinamide nucleotide transhydrogenase: a new quantitive trait locus accounting for glucose intolerance in C57BL/6J mice. Diabetes. 2006;55:2153–2156. doi: 10.2337/db06-0358. [DOI] [PubMed] [Google Scholar]
- Gallou-Kabani C, Junien C. Nutritional epigenomics of metabolic syndrome. Diabetes. 2005;54:1899–1906. doi: 10.2337/diabetes.54.7.1899. [DOI] [PubMed] [Google Scholar]
- Galmozzi A, Mitro N, Ferrari A, Gers E, Gilardi F, Godio C, et al. Inhibition of class i histone deacetylases unveils a mitochondrial signature and enhances oxidative metabolism in skeletal muscle and adipose tissue. Diabetes. 2013;62:732–742. doi: 10.2337/db12-0548. [DOI] [PMC free article] [PubMed] [Google Scholar]
- Gao Z, He Q, Peng B, Chiao PJ, Ye J. Regulation of nuclear translocation of HDAC3 by IκBα is required for tumor necrosis factor inhibition of peroxisome proliferator-activated receptor γ function. J Biol Chem. 2006;281:4540–4547. doi: 10.1074/jbc.M507784200. [DOI] [PMC free article] [PubMed] [Google Scholar]
- Gao Z, Yin J, Zhang J, Ward RE, Martin RJ, Lefevre M, et al. Butyrate improves insulin sensitivity and increases energy expenditure in mice. Diabetes. 2009;58:1509–1517. doi: 10.2337/db08-1637. [DOI] [PMC free article] [PubMed] [Google Scholar]
- Hainer SJ, Pruneski JA, Mitchell RD, Monteverde RM, Martens JA. Intergenic transcription causes repression by directing nucleosome assembly. Genes Dev. 2011;25:29–40. doi: 10.1101/gad.1975011. [DOI] [PMC free article] [PubMed] [Google Scholar]
- Hayes JR, Finley JW, Leveille GA. In vivo metabolism of Salatrim fats in the rat. J Agric Food Chem. 1994;42:500–514. [Google Scholar]
- Heinz S, Benner C, Spann N, Bertolino E, Lin YC, Laslo P, et al. Simple combinations of lineage-determining transcription factors prime cis-regulatory elements required for macrophage and b cell identities. Mol Cell. 2010;38:576–589. doi: 10.1016/j.molcel.2010.05.004. [DOI] [PMC free article] [PubMed] [Google Scholar]
- Henagan TM, Lenard NR, Gettys TW, Stewart LK. Dietary quercetin supplementation in mice increases skeletal muscle PGC1α expression, improves mitochondrial function and attenuates insulin resistance in a time-specific manner. PLoS ONE. 2014;9:e89365. doi: 10.1371/journal.pone.0089365. [DOI] [PMC free article] [PubMed] [Google Scholar]
- Huang DW, Sherman BT, Lempicki RA. Systematic and integrative analysis of large gene lists using DAVID bioinformatics resources. Nat Protoc. 2009;4:44–57. doi: 10.1038/nprot.2008.211. [DOI] [PubMed] [Google Scholar]
- Katada S, Imhof A, Sassone-Corsi P. Connecting threads: epigenetics and metabolism. Cell. 2012;148:24–28. doi: 10.1016/j.cell.2012.01.001. [DOI] [PubMed] [Google Scholar]
- Khalyfa A, Carreras A, Hakim F, Cunningham JM, Wang Y, Gozal D. Effects of late gestational high-fat diet on body weight, metabolic regulation and adipokine expression in offspring. Int J Obes (Lond) 2013;37:1481–1489. doi: 10.1038/ijo.2013.12. [DOI] [PMC free article] [PubMed] [Google Scholar]
- Kilkenny C, Browne W, Cuthill IC, Emerson M, Altman DG. Animal research: reporting in vivo experiments: the ARRIVE guidelines. Br J Pharmacol. 2010;160:1577–1579. doi: 10.1111/j.1476-5381.2010.00872.x. [DOI] [PMC free article] [PubMed] [Google Scholar]
- Kingston RE, Narlikar GJ. ATP-dependent remodeling and acetylation as regulators of chromatin fluidity. Genes Dev. 1999;13:2339–2352. doi: 10.1101/gad.13.18.2339. [DOI] [PubMed] [Google Scholar]
- Knutti D, Kralli A. PGC-1, a versatile coactivator. Trends Endocrinol Metab. 2001;12:360–365. doi: 10.1016/s1043-2760(01)00457-x. [DOI] [PubMed] [Google Scholar]
- Koves TR, Ussher JR, Noland RC, Slentz D, Mosedale M, Ilkayeva O, et al. Mitochondrial overload and incomplete fatty acid oxidation contribute to skeletal muscle insulin resistance. Cell Metab. 2008;7:45–56. doi: 10.1016/j.cmet.2007.10.013. [DOI] [PubMed] [Google Scholar]
- Li Z, Schug J, Tuteja G, White P, Kaestner KH. The nucleosome map of the mammalian liver. Nat Struct Mol Biol. 2011;18:742–746. doi: 10.1038/nsmb.2060. [DOI] [PMC free article] [PubMed] [Google Scholar]
- Lin HV, Frassetto A, Kowalik EJ, Jr, Nawrocki AR, Lu MM, Kosinski JR, et al. Butyrate and propionate protect against diet-induced obesity and regulate gut hormones via free fatty acid receptor 3-independent mechanisms. PLoS ONE. 2012;7:e35240. doi: 10.1371/journal.pone.0035240. [DOI] [PMC free article] [PubMed] [Google Scholar]
- Makowski L, Noland RC, Koves TR, Xing W, Ilkayeva OR, Muehlbauer MJ, et al. Metabolic profiling of PPARα−/− mice reveals defects in carnitine and amino acid homeostasis that are partially reversed by oral carnitine supplementation. FASEB J. 2009;23:586–604. doi: 10.1096/fj.08-119420. [DOI] [PMC free article] [PubMed] [Google Scholar]
- McGrath J, Drummond G, McLachlan E, Kilkenny C, Wainwright C. Guidelines for reporting experiments involving animals: the ARRIVE guidelines. Br J Pharmacol. 2010;160:1573–1576. doi: 10.1111/j.1476-5381.2010.00873.x. [DOI] [PMC free article] [PubMed] [Google Scholar]
- McGee S, Hargreaves M. Histone modifications and skeletal muscle metabolic gene expression. Clin Exp Pharmacol Physiol. 2010;37:392–396. doi: 10.1111/j.1440-1681.2009.05311.x. [DOI] [PubMed] [Google Scholar]
- McGee SL, van Denderen BJW, Howlett KF, Mollica J, Schertzer JD, Kemp BE, et al. AMP-activated protein kinase regulates GLUT4 transcription by phosphorylating histone deacetylase 5. Diabetes. 2008;57:860–867. doi: 10.2337/db07-0843. [DOI] [PubMed] [Google Scholar]
- Meiklejohn CD, Holmbeck MA, Siddiq MA, Abt DN, Rand DM, Montooth KL. An incompatibility between a mitochondrial tRNA and its nuclear-encoded tRNA synthetase compromises development and fitness in Drosophila. PLoS Genet. 2013;9:e1003238. doi: 10.1371/journal.pgen.1003238. [DOI] [PMC free article] [PubMed] [Google Scholar]
- Nicholson A, Reifsnyder PC, Malcolm RD, Lucas CA, MacGregor GR, Zhang W, et al. Diet-induced obesity in two C57BL/6 substrains with intact or mutant nicotinamide nucleotide transhydrogenase (Nnt) gene. Obesity. 2010;18:1902–1905. doi: 10.1038/oby.2009.477. [DOI] [PMC free article] [PubMed] [Google Scholar]
- Onyango IG, Lu J, Rodova M, Lezi E, Crafter AB, Swerdlow RH. Regulation of neuron mitochondrial biogenesis and relevance to brain health. Biochim Biophys Acta. 2010;1802:228–234. doi: 10.1016/j.bbadis.2009.07.014. [DOI] [PubMed] [Google Scholar]
- Pagliarini DJ, Calvo SE, Chang B, Sheth SA, Vafai SB, Ong S-E, et al. A mitochondrial protein compendium elucidates complex I disease biology. Cell. 2008;134:112–123. doi: 10.1016/j.cell.2008.06.016. [DOI] [PMC free article] [PubMed] [Google Scholar]
- Pawson AJ, Sharman JL, Benson HE, Faccenda E, Alexander SP, Buneman OP, et al. NC-IUPHAR. The IUPHAR/BPS Guide to PHARMACOLOGY: an expert-driven knowledge base of drug targets and their ligands. Nucl Acids Res. 2014;42(Database Issue):D1098-1106. doi: 10.1093/nar/gkt1143. [DOI] [PMC free article] [PubMed] [Google Scholar]
- Portela A, Esteller M. Epigenetic modifications and human disease. Nat Biotechnol. 2010;28:1057–1068. doi: 10.1038/nbt.1685. [DOI] [PubMed] [Google Scholar]
- Ren JM, Marshall BA, Mueckler MM, McCaleb M, Amatruda JM, Shulman GI. Overexpression of Glut4 protein in muscle increases basal and insulin-stimulated whole body glucose disposal in conscious mice. J Clin Invest. 1995;95:429–432. doi: 10.1172/JCI117673. [DOI] [PMC free article] [PubMed] [Google Scholar]
- Ronchi JA, Figueira TR, Ravagnani FG, Oliveira HCF, Vercesi AE, Castilho RF. A spontaneous mutation in the nicotinamide nucleotide transhydrogenase gene of C57BL/6J mice results in mitochondrial redox abnormalities. Free Radic Biol Med. 2013;63:446–456. doi: 10.1016/j.freeradbiomed.2013.05.049. [DOI] [PubMed] [Google Scholar]
- Safdar A, Little JP, Stokl AJ, Hettinga BP, Akhtar M, Tarnopolsky MA. Exercise increases mitochondrial PGC-1α content and promotes nuclear-mitochondrial cross-talk to coordinate mitochondrial biogenesis. J Biol Chem. 2011;286:10605–10617. doi: 10.1074/jbc.M110.211466. [DOI] [PMC free article] [PubMed] [Google Scholar] [Retracted]
- Sinclair KD, Allegrucci C, Singh R, Gardner DS, Sebastian S, Bispham J, et al. DNA methylation, insulin resistance, and blood pressure in offspring determined by maternal periconceptional B vitamin and methionine status. Proc Natl Acad Sci U S A. 2007;104:19351–19356. doi: 10.1073/pnas.0707258104. [DOI] [PMC free article] [PubMed] [Google Scholar]
- Sivitz WI, Yorek MA. Mitochondrial dysfunction in diabetes: from molecular mechanisms to functional significance and therapeutic opportunities. Antioxid Redox Signal. 2010;12:537–577. doi: 10.1089/ars.2009.2531. [DOI] [PMC free article] [PubMed] [Google Scholar]
- Smith BK, Mukai K, Lally JS, Maher AC, Gurd BJ, Heigenhauser GJF, et al. AMP-activated protein kinase is required for exercise-induced peroxisome proliferator-activated receptor γ co-activator 1α translocation to subsarcolemmal mitochondria in skeletal muscle. J Physiol. 2013;591:1551–1561. doi: 10.1113/jphysiol.2012.245944. [DOI] [PMC free article] [PubMed] [Google Scholar]
- Sparks LM, Xie H, Koza RA, Mynatt R, Hulver MW, Bray GA, et al. A high-fat diet coordinately downregulates genes required for mitochondrial oxidative phosphorylation in skeletal muscle. Diabetes. 2005;54:1926–1933. doi: 10.2337/diabetes.54.7.1926. [DOI] [PubMed] [Google Scholar]
- Takeshima H, Suetake I, Shimahara H, Ura K, Tate S-I, Tajima S. Distinct DNA methylation activity of Dnmt3a and Dnmt3b towards naked and nucleosomal DNA. J Biochem. 2006;139:503–515. doi: 10.1093/jb/mvj044. [DOI] [PubMed] [Google Scholar]
- Talmud PJ, Hingorani AD, Cooper JA, Marmot MG, Brunner EJ, Kumari M, et al. Utility of genetic and non-genetic risk factors in prediction of type 2 diabetes: whitehall II prospective cohort study. BMJ. 2010;340:b4838. doi: 10.1136/bmj.b4838. [DOI] [PMC free article] [PubMed] [Google Scholar]
- Tamashiro KLK, Terrillion CE, Hyun J, Koenig JI, Moran TH. Prenatal stress or high-fat diet increases susceptibility to diet-induced obesity in rat offspring. Diabetes. 2009;58:1116–1125. doi: 10.2337/db08-1129. [DOI] [PMC free article] [PubMed] [Google Scholar]
- Valouev A, Ichikawa J, Tonthat T, Stuart J, Ranade S, Peckham H, et al. A high-resolution, nucleosome position map of C. elegans reveals a lack of universal sequence-dictated positioning. Genome Res. 2008;18:1051–1063. doi: 10.1101/gr.076463.108. [DOI] [PMC free article] [PubMed] [Google Scholar]
- Valouev A, Johnson SM, Boyd SD, Smith CL, Fire AZ, Sidow A. Determinants of nucleosome organization in primary human cells. Nature. 2011;474:516–520. doi: 10.1038/nature10002. [DOI] [PMC free article] [PubMed] [Google Scholar]
- Verma NK, Singh J, Dey CS. PPAR-γ expression modulates insulin sensitivity in C2C12 skeletal muscle cells. Br J Pharmacol. 2004;143:1006–1013. doi: 10.1038/sj.bjp.0706002. [DOI] [PMC free article] [PubMed] [Google Scholar]
- Vidrine K, Ye J, Martin RJ, McCutcheon KL, Raggio AM, Pelkman C, et al. Resistant starch from high amylose maize (HAM-RS2) and dietary butyrate reduce abdominal fat by a different apparent mechanism. Obesity (Silver Spring) 2014;22:344–348. doi: 10.1002/oby.20501. [DOI] [PubMed] [Google Scholar]
- Violante S, Ijlst L, van Lenthe H, de Almeida IT, Wanders RJ, Ventura FV. Carnitine palmitoyltransferase 2: new insights on the substrate specificity and implications for acylcarnitine profiling. Biochim Biophys Acta. 2010;1802:728–732. doi: 10.1016/j.bbadis.2010.06.002. [DOI] [PubMed] [Google Scholar]
- Wang Y-X, Zhang C-L, Yu RT, Cho HK, Nelson MC, Bayuga-Ocampo CR, et al. Regulation of muscle fiber type and running endurance by PPARδ. PLoS Biol. 2004;2:e294. doi: 10.1371/journal.pbio.0020294. [DOI] [PMC free article] [PubMed] [Google Scholar]
- Weiner A, Hughes A, Yassour M, Rando OJ, Friedman N. High-resolution nucleosome mapping reveals transcription-dependent promoter packaging. Genome Res. 2010;20:90–100. doi: 10.1101/gr.098509.109. [DOI] [PMC free article] [PubMed] [Google Scholar]
- Wellen KE, Hatzivassiliou G, Sachdeva UM, Bui TV, Cross JR, Thompson CB. ATP-citrate lyase links cellular metabolism to histone acetylation. Science. 2009;324:1076–1080. doi: 10.1126/science.1164097. [DOI] [PMC free article] [PubMed] [Google Scholar]
- de Wilde J, Mohren R, van den Berg S, Boekschoten M, Dijk KW-V, de Groot P, et al. Short-term high fat-feeding results in morphological and metabolic adaptations in the skeletal muscle of C57BL/6J mice. Physiol Genomics. 2008;32:360–369. doi: 10.1152/physiolgenomics.00219.2007. [DOI] [PubMed] [Google Scholar]
- Wu H, Naya FJ, McKinsey TA, Mercer B, Shelton JM, Chin ER, et al. MEF2 responds to multiple calcium-regulated signals in the control of skeletal muscle fiber type. EMBO J. 2000;19:1963–1973. doi: 10.1093/emboj/19.9.1963. [DOI] [PMC free article] [PubMed] [Google Scholar]
- Wu Z, Puigserver P, Andersson U, Zhang C, Adelmant G, Mootha V, et al. Mechanisms controlling mitochondrial biogenesis and respiration through the thermogenic coactivator PGC-1. Cell. 1999;98:115–124. doi: 10.1016/S0092-8674(00)80611-X. [DOI] [PubMed] [Google Scholar]
- Yates DW, Garland PB. Carnitine palmitoyltransferase activities (EC 2.3.1.-) of rat liver mitochondria. J Biochem. 1970;119:547–552. doi: 10.1042/bj1190547. [DOI] [PMC free article] [PubMed] [Google Scholar]
- Yigit E, Bischof JM, Zhang Z, Ott CJ, Kerschner JL, Leir S-H, et al. Nucleosome mapping across the CFTR locus identifies novel regulatory factors. Nucleic Acids Res. 2013;41:2857–2868. doi: 10.1093/nar/gks1462. [DOI] [PMC free article] [PubMed] [Google Scholar]
- Zhang Z, Pugh BF. High-resolution genome-wide mapping of the primary structure of chromatin. Cell. 2011;144:175–196. doi: 10.1016/j.cell.2011.01.003. [DOI] [PMC free article] [PubMed] [Google Scholar]
- Zhou VW, Goren A, Bernstein BE. Charting histone modifications and the functional organization of mammalian genomes. Nat Rev Genet. 2011;12:7–18. doi: 10.1038/nrg2905. [DOI] [PubMed] [Google Scholar]
Associated Data
This section collects any data citations, data availability statements, or supplementary materials included in this article.
Supplementary Materials
Figure S1 MNase-seq methodology. The methods for mononucleosomal DNA isolation and high throughput sequencing and analysis are roughly outlined.
Figure S2 Absolute fat and muscle masses. C57BL6/J mice were fed a LFD (LF), HFD (HF) or a HFD plus NaB (HF + NaB) and body fat (A) and muscle mass (B) were assessed weekly. (C) Mice were killed after 10 weeks on the diets and inguinal white adipose tissue (WAT) (LF n = 10, HF n = 9 and HF + NaB n = 10) (D) and epididymal (LF n = 9, HF n = 10 and HF + NaB n = 10) (E) WAT fat pads were dissected and weighed and are presented as the ratio of subcutaneous (inguinal WAT) to visceral (epididymal WAT) fat. Data are means ± SEM. *** P < 0.0001, significant difference between groups; one-way anova and Tukey's test.
Figure S3 Fibre type and mitochondrial function. (A) Fibre typing of skeletal muscle is shown at 20× for each treatment group. The percentage of positive cells (teal), representing type 1 fibres, was calculated after an analysis of 3–5 areas over 2 sections in 4 animals each per group and is shown in the bar graph as means ± SEM. * P < 0.05, significant difference between groups; one-way anova and Tukey's test. (B) Short and medium chain acylcarnitine levels or ratios were measured and only those acylcarnitines or ratios that were significantly different between groups are graphed as means ± SEM for LF (white), HF (grey) and HF + NaB (black). Please note that levels for C6:1, C6-OH, C8-1 and C14-OH are graphed on the right y axis. All other values are graphed on the left y axis. The results of statistical analyses for graphed acylcarnitine species and ratios are shown in Table 2.
Figure S4 Comparison of MNase-seq and microarrays. Differences in nucleosome number (LF – HF; black) were compared to fold changes in transcript expression (LF/HF; grey) (de Wilde et al., 2008) of (A) muscle structure, contraction and metabolic genes and (B) PPAR signalling genes. Note that the PPAR signalling pathway was found using DAVID pathway analysis to be enriched with differentially expressed genes in HF compared to LF (Huang et al., 2009). (C) Comparison of expression from selected nuclear-encoded mitochondrial genes associated with the PPAR signalling pathway as measured by qRT-PCR (open bars) in skeletal muscle samples from the present study and by Affymetrix array from the previous study (hatched bars) (de Wilde et al., 2008) are shown. Of note, previous microarrays were only performed in C57BL6/J mice fed a LFD or HFD. Results are presented as means ± SEM. See Supporting Information Table S6 for definitions of gene symbols.
Table S1 Reads.
Table S2 Differentially enriched metabolic GO genes.
Table S3 Targeted analysis of metabolic genes.
Table S4 MitoCarta genes.
Table S5 Primer sequences.
Table S6 Microarray gene symbol definitions.
Appendix S1 Supplementary methods.