Abstract
Background and Aim
It is unclear how total sock ply and thickness are related when more than one sock is worn. The objectives were to determine if the thickness of one multi-ply amputee sock of ply P was the same as the thickness of a stack of reduced-ply socks of total ply P; and if the thickness of N single socks stacked one on top of the other was equal to the sum (1 to N) of the single sock thicknesses.
Technique
Using a custom instrument, compressive stresses were applied while sock thickness was measured.
Discussion
The thickness of one multi-ply sock of ply P was typically less than the thickness of a stack of reduced-ply socks of total ply P. The thickness of N single socks stacked one on top of the other was approximately equal to the sum (1 to N) of the single sock thicknesses.
Clinical Relevance
Our findings suggest three 1-ply socks to be 20% greater in thickness than one 3-ply sock, and one 3-ply + two 1-ply socks to be 30% greater in thickness than one 5-ply sock.
Background and Aim
Adjusting the thickness or number of prosthetic socks worn on one's residual limb is a means for people with limb loss to accommodate changes in socket fit. Adding socks is recommended clinically to accommodate residual limb volume loss over the day1.
We recently reported on how sock ply relates to sock thickness and how compression during ambulation affects that relationship2. Sock ply has to do with the number of single yarns twisted together to make a fiber-like material (FIGURE 1A) that is then woven into sock fabric usually using a stockinette weave (FIGURE 1B). Our test results showed that sock ply was non-linearly related to sock thickness. For example, a 6-ply sock was not twice the thickness of a 3-ply sock. We also found that under compressive loads as experienced during walking Thick Socks (socks made from a single material) were about 80% greater in thickness than Thin Socks (socks made from a blend of materials). Another finding was that stretching the sock and pulling it up the limb reduced Thin Sock thickness measurements by about 30% but had minimal effect on Thick Sock thickness.
A next issue to address is the thickness of multiple socks worn simultaneously. People with limb loss typically increase the number of socks they wear over time due to fluid volume loss or atrophy of the residual limb. We might expect that when multiple socks are worn, adjacent socks integrate or mesh with each other and thus reduce total thickness. In the present investigations we addressed two questions: (1) Is the thickness of one multi-ply sock of ply P the same as the thickness of a stack of reduced-ply socks of total ply P? (2) Is the thickness of N single socks stacked one on top of the other equal to the sum (1 to N) of the single sock thicknesses?
Technique
Testing Apparatus
A custom designed instrument identical to that described previously was used to measure sock thickness2 (FIGURE 2). Socks were put under controlled biaxial tension and then placed onto a supporting base. A compressive stress was applied by adding weights to the top of a plunger mounted on a 9.5cm long steel rod connected to a 20mm diameter pressure foot. The steel rod passed through a pillow block (8649T3, McMaster-Carr) to ensure that only compressive loads were delivered to the sock. Allowing shear loading would have induced friction in the bearing and reduced the magnitude of compression, introducing error to the force measurement. We did not consider shear loading in the present study because it was expected to have minimal impact on sock thickness. An inductive position sensor (IPS) (BAWM12MF2-UAC40F-BP00,2-GS04, Balluff) was installed into the base block to measure distance to the pressure foot and thus thickness of the sock. The resolution of the IPS was 10μm. The maximum thickness measurable by the IPS was 3.4mm which corresponded to the thickness of a 7-Ply wool sock. The IPS had a minimum read distance of 0.4mm and the maximum compression of any sock was 50%. To prevent the sensor from bottoming out, for any sock with an initial thickness of less than 1.5mm we placed four 0.1mm acetate sheets on the base plate under the socks.
Figure 2.
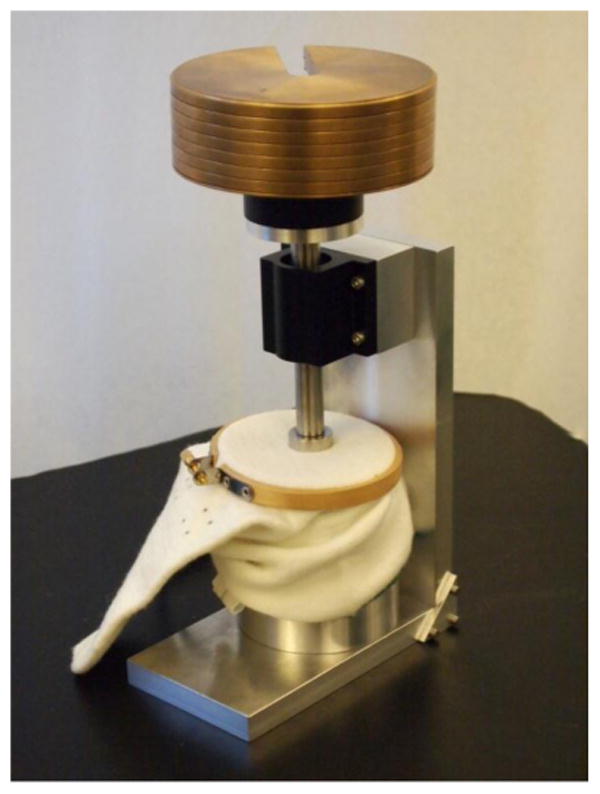
Custom Designed Instrument to Measure Sock Thickness.
Instrument Calibration
We conducted calibration tests using procedures described in our previous study so that we could convert raw data from the IPS into units of distance (mm)2. In brief, we collected both IPS data (experimental) and electronic height gauge data (ground truth) simultaneously from 205 sock sample/load condition combinations such that thickness was well distributed across the measurement range. A 6th order polynomial was fit to the data. We used a 6th order polynomial because the calibration data was strongly linear within the central 60% of the range and strongly non-linear at the low and high ends of the range. A 6th order polynomial accomplished a least-squares error in fitting calibration data of 0.00mm and a standard deviation of 0.04mm (R2=0.997).
Testing Procedure
Six different sock models from the same manufacturer (Knit-Rite) ranging from 1 to 6 Ply were tested. The socks had never been worn in a prosthesis, although they were tested as part of a previous research study2. Three of the sock models (Cotton, Virgin Wool, and Super Sock) were manufactured from a single natural material and were labeled by the manufacturer as “Thick Socks.” These models do not stretch to conform to the amputee's residual limb, thus as part of sock fitting the shape of the residual limb must be carefully measured and a matching sock shape selected. Four sock models (A-Plus, Soft Sock SX, Soft Sock SP, and X-Wool) were manufactured from multiple materials and were labeled by the manufacturer as “Thin Socks.” All Thin Socks contained Lycra® Spandex (2.0% to 4.4%) and easily stretched during donning. Thus Thin Socks do not require as careful shape matching to the residual limb as Thick Socks do. All socks were manufactured with a weave pattern as shown in FIGURE 1B.
Figure 1A,B. Sock Architecture.
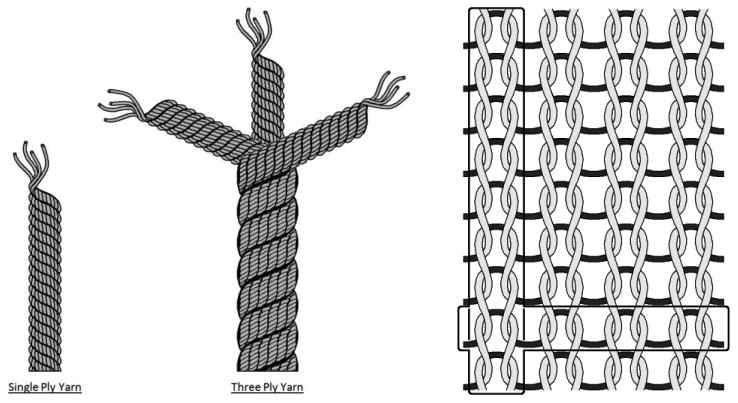
(A) Single ply and three ply yarns. (B) Stockinette weave: The sides of the loops from adjacent rows form vertical “ribs” (vertical box) on the outer (top) surface of the sock (see FIGURE 7A). The tops and bottoms of the loops form horizontal “ribs” (horizontal box) on the inner (bottom) surface of the sock (see FIGURE 7B). For clarity, only one rib is highlighted for each direction.
With the sock placed on a flat surface, a black square with 1.3cm sides was inked onto each sock approximately 6.4cm down from the proximal seam using a fine-tip felt marker. Socks were placed into a wooden embroidery hoop (CNEH, Norden Crafts) with the ink square centered so that they were under biaxial tension. Thin Socks were stretched so the square sides were each 2.0cm long (60% biaxial strain) and Thick Socks were stretched so that the square sides were each 1.5cm long (20% biaxial strain). The basis for stretching the socks these amounts was our previous study where we found these to be average strains induced by amputee subjects donning socks2. If a stack of socks was to be tested then all socks were placed within the embroidery hoop, taking care to ensure that identical biaxial strains were applied to each sock. The socks were arranged so that contact surfaces and fiber directions matched. In other words, inner surfaces of the socks faced downwards and outer surfaces faced upwards. We used this configuration because it is consistent with clinical practice. The seams of all socks were oriented in the same direction. Seams were not placed underneath the pressure foot during testing.
Once the socks were arranged on the testing apparatus, we conducted a two-phase process. First we pre-conditioned the socks three times by loading weights onto the loading plate (1508g total mass, equivalent to 54.0 kPa pressure) for 5s durations and then releasing the load. After each pre-conditioning cycle we measured the thickness of the sock using an electronic height gauge (570-212, Mitutoyo), a procedure that took about 5s. If the difference in sock thickness between the second and third pre-conditioning cycle was greater than the resolution of the electronic height gauge (10 μm) then we conducted an additional pre-conditioning cycle until the difference between successive pre-conditioning cycles was less than the height gauge resolution.
We then conducted a quasi-static loading test using one 200.7g and seven 405.4g weights. The 200.7g weight was applied first. We added additional weights at 8s intervals and held each weight constant for 7s. Then we removed the weights one at a time at 8s intervals in the reverse order from which they were applied.
Part 1: Multi-ply sock vs. stack of reduced-ply socks
For each sock material we created groups of socks such that the total ply of the group matched the ply of another sock of the same material. Ten sock groups were created. For each sock group we tested the thickness of the one multi-ply sock using the procedure described above, and then we tested the thickness of the stack of reduced-ply socks of the same total ply. We termed the thickness of the one multi-ply sock Thone multi-ply sock of ply P. We termed the thickness of the stack of reduced-ply socks of the same total ply Threduced-ply stack of total ply P. We termed the quotient Threduced-ply stack of total ply P/Thone multi-ply sock of ply P the Stack Quotient.
The Stack Quotient (Threduced-ply stack of total ply P/Thone multi-ply sock of ply P) averaged 1.4 (s.d. = 0.2) for the donned, 1.3 (s.d. = 0.2) for the standing equal weight-bearing, and 1.2 (s.d. = 0.2) for the walking simulated conditions (TABLE 1). FIGURE 3A,B shows a plot of the Stack Quotient for all three simulated loading conditions for all sock model/ply combinations tested.
Table 1. Part 1: Sock Groups and Stack Quotients.
| Sock Name and Model |
Thick or Thin |
P, Ply of one multi-ply sock |
Socks in reduced-ply stack (stack of total ply P) |
Stack Quotient | ||
|---|---|---|---|---|---|---|
|
| ||||||
| Donned (sitting) |
Standing (equal w.b.) |
Walking (stance phase) |
||||
|
| ||||||
| A-Plus/KL | Thin | 4 | 2*2-Ply | 1.4 | 1.3 | 1.3 |
|
| ||||||
| Cotton/CS | Thick | 3 | 3*1-Ply | 1.0 | 0.8 | 0.8 |
| Cotton/CS | Thick | 5 | 2*1-Ply + 1*3-Ply | 1.5 | 1.3 | 1.3 |
|
| ||||||
| Soft Sock/SP | Thin | 3 | 3*1-Ply | 1.7 | 1.3 | 1.3 |
| Soft Sock/SP | Thin | 5 | 2*1-Ply + 1*3-Ply | 1.4 | 1.1 | 1.1 |
| Soft Sock/SP | Thin | 6 | 2*3-Ply | 1.3 | 1.2 | 1.1 |
|
| ||||||
| Soft Sock/SX | Thin | 3 | 3*1-Ply | 1.5 | 1.2 | 1.2 |
|
| ||||||
| Soft Sock/SX | Thin | 5 | 2*1-Ply + 1*3-Ply | 1.6 | 1.3 | 1.2 |
| Super Sock/K1 | Thick | 6 | 2*3-Ply | 1.5 | 1.5 | 1.5 |
|
| ||||||
| X-Wool/WX | Thin | 6 | 2*3-Ply | 1.4 | 1.1 | 1.1 |
|
| ||||||
| Means (s.d.) | 1.4 (0.2) | 1.3 (0.2) | 1.2 (0.2) | |||
Figure 3A,B. Stack Quotients for Each Group Tested in Part 1.
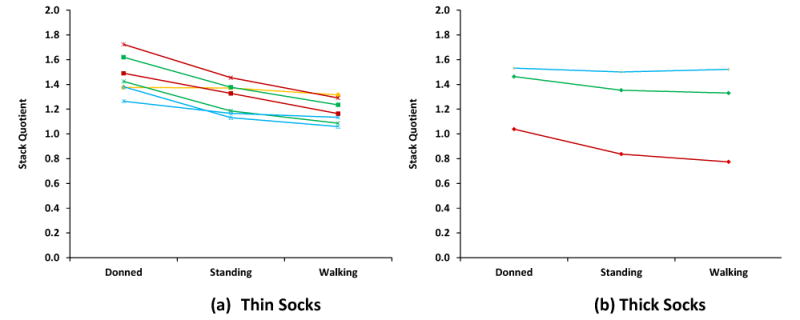
Quotients for simulated donning, standing, and walking for a group of socks are joined by a line. Ply is depicted by different colors and materials by different symbols. * = SP; ● = KL; □ = SX; △ = WX; ◊=CS; +=K1. Red=3-ply; yellow=4-ply; green=5-ply; blue=6-ply.
Overall, the Stack Quotient was higher for the simulated donned condition, with the simulated standing and walking conditions being similar for each group of socks. All sock groups had Stack Quotients greater than 1.0, except the 3-ply Cotton sock group which presented a Stack Quotient lower than 1.0 for simulating standing and walking (FIGURE 3B). Thin Socks presented a more consistent pattern than Thick Socks (FIGURE 3B). On average, three 1-ply socks were about 20% thicker than one 3-ply sock, and one 3-ply + two 1-ply socks were about 30% thicker than one 5-ply sock (FIGURE 4).
Figure 4. A Single Multi-Ply Sock Tended to be Thinner Than a Stack of Socks of the Same Total Ply.
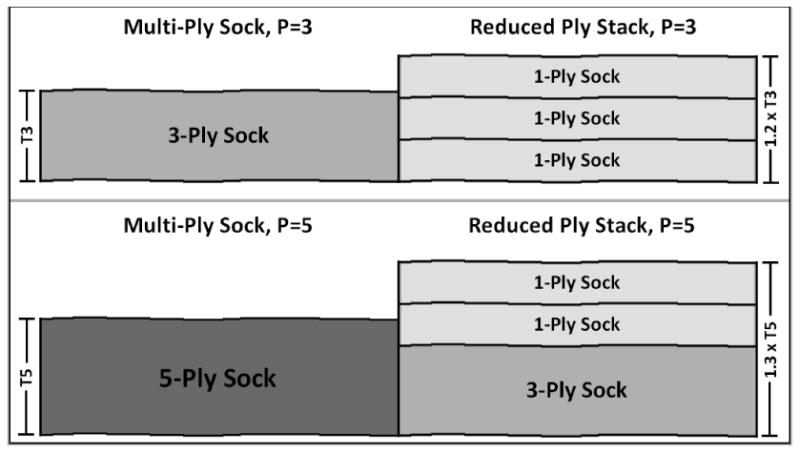
On average, three 1-ply socks were 20% greater in thickness than one 3-ply sock. A 3-ply sock + two 1-ply socks averaged 30% greater in thickness than a 5-ply sock.
We ordered results from all sock combinations tested from low to high thickness. Results for Thin Socks are shown in the upper panel in FIGURE 5 and Thick Socks in the lower panel.
Figure 5. Sock Thickness Results Under Walking Conditions.
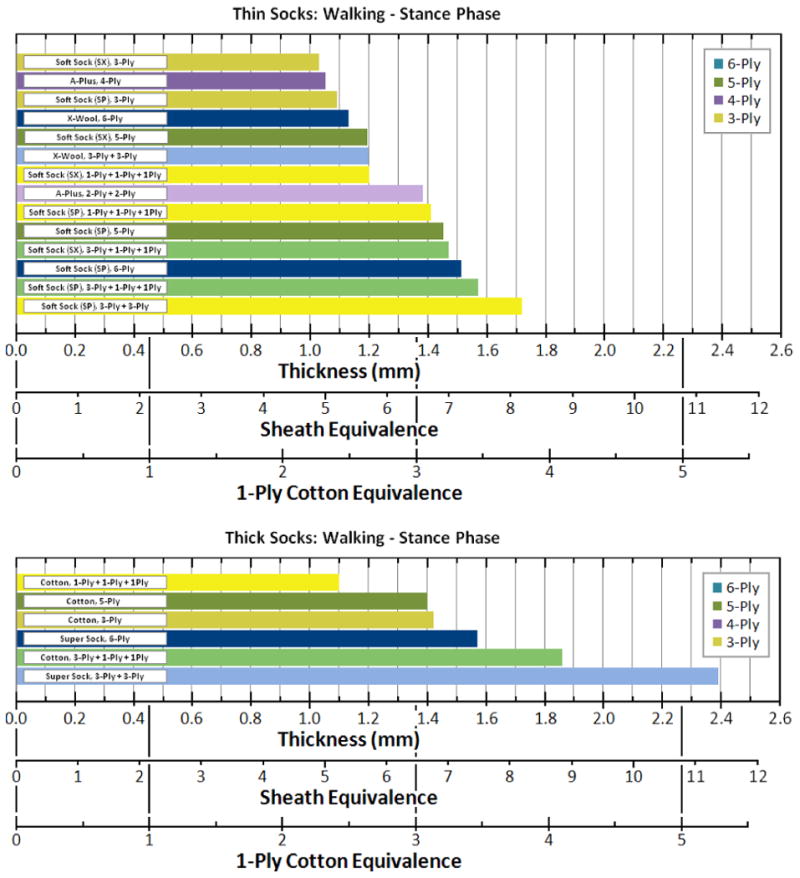
Sock thickness ordered from low to high for Thin Socks (upper panel) and Thick Socks (lower panel). Results from all Part 1 tests are included.
Part 2: Stack of single socks vs. sum of single socks
For each sock model/ply, we determined the maximum number of socks we could stack such that the total thickness of the stack was not more than 3.4mm. 3.4 mm was the maximum thickness change measurable with the IPS. Two or three socks were used. Twelve different sock model/ply combinations were tested. The thickness of the N single socks stacked together was termed ThN single socks stacked. We first tested the thickness of the stack of socks using the procedure described above. After testing we allowed the socks 24h for recovery. Then we tested the thickness of each sock within the stack individually. We termed the thickness of each sock Thsingle sock. We defined the Thickness Quotient as the quotient ThN single socks stacked/(N*[Thsingle sock]average of N socks).
For data collected from test procedures Part 1 and Part 2 described above, we converted IPS raw voltage data to thickness and then imported the data into Matlab (v. 7.11, MathWorks). We added the initial specimen thickness to the change in thickness measured with the IPS to determine total sock thickness at each load level. We then extracted data points from 4s after each load was applied.
In our analysis we considered pressures of 6.3, 50.6, and 101.2 kPa to be representative of donned, standing with equal weight-bearing, and walking conditions, respectively. These pressure levels were selected based from interface stress investigations on amputee subjects reported in the literature3,4,5,6,7,8,9.
Given the limited number of socks available, this study was preliminary and exploratory. Since some of the same socks were used in various comparisons groups, our data were not independent and formal statistical tests would not be valid. However, a descriptive analysis (visual and numeric) can shed light on the research questions. We constructed plots of Stack Quotient (Part 1) and Thickness Quotient (Part 2) by loading condition (donned, standing, walking) for the two sock types (Thin, Thick) and identified sock ply (1 to 6) in the plots.
The thickness of N single socks stacked one on top of the other was approximately equal to the sum (1 to N) of the single sock thicknesses (TABLE 2). The Thickness Quotient (ThN single socks stacked/N*Thsingle sock) averaged 1.0 (s.d. =0.1) for all socks tested. Thickness Quotients varied slightly with loading condition, material, and ply (FIGURE 6A,B), but there was no visible trend in the data suggesting a strong dependence on any of these variables.
Table 2. Part 2: Sock Groups and Thickness Quotients.
| Sock Name and Model | Ply of Single Socks | N, Quantity of Single Socks in Stack | Thickness Quotient, | ||
|---|---|---|---|---|---|
|
| |||||
|
| |||||
| Donned (sitting) |
Standing (equal w.b.) |
Walking (stance phase) |
|||
|
| |||||
| A-Plus/KL | 2 | 2 | 1.0 | 1.0 | 1.0 |
|
| |||||
| Cotton/CS | 1 | 3 | 1.0 | 0.9 | 0.9 |
| Cotton/CS | 3 | 2 | 0.9 | 0.9 | 0.9 |
| Cotton/CS | 5 | 2 | 1.0 | 1.0 | 0.9 |
|
| |||||
| Soft Sock/SP | 1 | 3 | 1.2 | 1.3 | 1.3 |
| Soft Sock/SP | 3 | 2 | 0.8 | 0.8 | 0.8 |
| Soft Sock/SP | 5 | 2 | 1.0 | 1.0 | 1.0 |
|
| |||||
| Soft Sock/SX | 1 | 3 | 1.1 | 1.1 | 1.0 |
| Soft Sock/SX | 3 | 2 | 1.1 | 1.2 | 1.1 |
|
| |||||
| Super Sock/K1 | 3 | 2 | 1.0 | 1.0 | 1.0 |
|
| |||||
| X-Wool/WX | 3 | 2 | 1.0 | 1.0 | 1.0 |
| X-Wool/WX | 5 | 2 | 1.0 | 1.0 | 0.9 |
|
| |||||
| Means (s.d.) | 1.0 (0.1) | 1.0 (0.1) | 1.0 (0.1) | ||
Figure 6A,B. Thickness Quotients for Each Group Tested in Part 2.
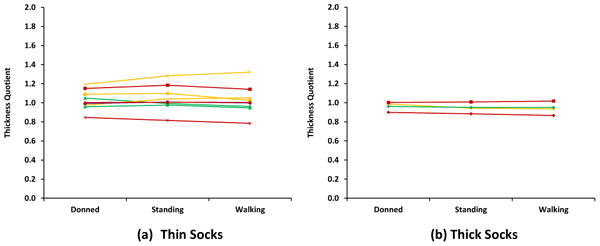
Thickness quotients for simulated donning, standing, and walking conditions for each sock group are joined by a line. Material is depicted by symbol and total ply by color. * = SP; ● = KL; □ = SX; △ = WX; ◊=CS; +=K1; - =MS. Orange=1-ply; purple=2-ply; red=3-ply; yellow=4-ply; green=5-ply; blue=6-ply.
Discussion
Socks are available in a variety of materials and ply. A challenge to prosthesis users and their practitioners is to determine what combination of socks accommodates residual limb volume losses over time. Over the course of the day as fluid volume changes within the residual limb and over weeks or months as the residual limb matures, the limb typically reduces in size, necessitating the addition of more socks to maintain a proper fit. Results from both the present study and our prior investigation2 demonstrate that summing of ply may not be an accurate means of calculating total sock thickness. In addition, units of distance (e.g. mm) are probably better to specify sock thickness rather than ply.
Because a limited number of socks of each model were available for testing, we needed to use some socks in more than one group and thus repeated trials were conducted on some socks. We tried to minimize impact of repeated trials on the results by letting the socks rest for at least 24 h between trials. Because of the lack of independence of sock membership for each group our observations of sock thickness dependence on loading condition, material, and ply should be viewed as exploratory.
In the present study little to no meshing occurred when socks were stacked. Examination of sock surfaces under a microscope showed that all socks tested were fabricated with a stockinette weave (FIGURE 7A,B). Outer sock surfaces had ribs in the vertical direction when the sock was donned. Inner sock surfaces had ribs in the circumferential direction when the sock was donned. These configurations prevented meshing when socks were stacked, and instead individual socks existed as discrete layers within the stack. We checked other products and found that Royal Knit socks, Sterling socks, DAW socks, DAW sheaths, and Silo sheaths (gel backed) were also made with a stockinette weave (though the DAW sheath had the inner and outer layer rib patterns reversed). Thus the total thickness in millimeters of socks worn was equal to the sum of the thicknesses of the individual constituents in millimeters. Applying these results clinically in an example, we state: two 1.0mm Thick Socks worn with one 2.0mm thick sock results in a total sock thickness of 4.0mm.
Figure 7A,B. Magnified Images of Sock Surfaces.
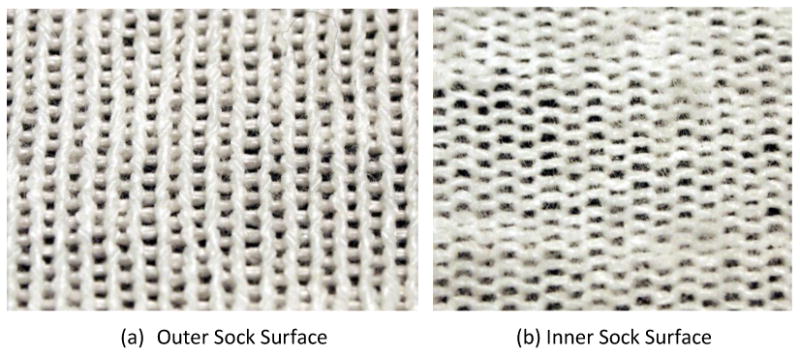
All socks were fabricates with a stockinette weave.
Our observation that Stack Quotient (Threduced-ply stack of total ply P/Thone multi-ply sock of ply P) tended to increase for the simulated donned condition compared with the standing or walking condition warrants further investigation. It suggests that single socks are stiffer than stacked socks of equivalent ply. We postulate that a reason for this result may be that there is no bonding between socks within a stack. Thus the stiffness of a stack of socks would be expected comparable to the stiffness of an individual sock within the stack. This hypothesis needs testing. Models should be considered to determine the biomechanical impact of sock stiffness differences on limb stresses.
The reason the 3-ply Cotton sock tested in Part 1 (three 1-ply socks vs. single 3-ply sock) demonstrated lower Stack Quotients than any of the other groups tested was because of the unusually low thickness of 1-ply Cotton socks. As demonstrated in our prior investigation2, 1-ply Cotton socks were thinner than any other sock tested under all test loading conditions, while 3-ply Cotton socks were not. The reduced thickness of the 1-ply socks resulted in a lower numerator in the calculation of Stack Quotient. The low thickness of 1-ply Cotton socks also caused the more inconsistent Stack Quotient pattern for Thick vs. Thin Socks.
Ordering combinations of socks from low to high, as illustrated in FIGURE 5, may be useful clinically towards prescription of small gradations in thickness. For example, if a patient complains that Soft Socks SX (1+1+1) cause the prosthesis to feel too loose, and SX (3+1+1) cause the prosthesis to feel too tight then the practitioner might try SP (1+1+1) as an intermediary solution. It is important to view FIGURE 5 as a descriptive starting point. To create a useful prescription tool, an extensive study would need to be conducted estimating average thickness of numerous combinations and models of socks in an unbiased way. It would also be useful to quantify how much socks thin over time from wear and laundering.
References
- 1.Highsmith J, Kahle JT. Prosthetic socks: simple, low-cost, helpful ways to protect your skin. inMotion. 2006;16(2):1–4. [Google Scholar]
- 2.Sanders JE, Cagle JC, Harrison DS, Karchin A. Amputee socks: how does sock ply relate to sock thickness? Prosthet Orthot Int. 2012;36(1):77–86. doi: 10.1177/0309364611431290. [DOI] [PMC free article] [PubMed] [Google Scholar]
- 3.Pearson JR, Holmgren G, March L, Oberg K. Pressures in critical regions of the below-knee patellar-tendon-bearing prosthesis. Bull Prosthet Res Spring. 1973:52–76. [PubMed] [Google Scholar]
- 4.Sanders JE, Lam D, Dralle AJ, Okumura R. Interface pressures and shear stresses at thirteen socket sites on two persons with transtibial amputation. J Rehabil Res Dev. 1997;34(1):19–43. [PubMed] [Google Scholar]
- 5.Sanders JE, Zachariah SG, Baker AB, Greve JM, Clinton C. Effects of changes in cadence, prosthetic componentry, and time on interface pressures and shear stresses of three trans-tibial amputees. Clin Biomech. 2000;15(9):684–694. doi: 10.1016/s0268-0033(00)00026-7. [DOI] [PubMed] [Google Scholar]
- 6.Zachariah SG, Sanders JE. Standing interface stresses as a predictor of walking interface stresses in the trans-tibial prosthesis. Prosthet Orthot Int. 2001;25(1):34–40. doi: 10.1080/03093640108726566. [DOI] [PubMed] [Google Scholar]
- 7.Goh JCH, Lee PVS, Chong SY. Static and dynamic pressure profiles of a patellar-tendon-bearing (PTB) socket. J Eng Med. 2003;217(part H):121–126. doi: 10.1243/09544110360579330. [DOI] [PubMed] [Google Scholar]
- 8.Jia X, Suo S, Meng F, Wang R. Effects of alignment on interface pressure for transtibial amputee during walking. Disabil Rehabil Assist Technol. 2008;3(6):339–343. doi: 10.1080/17483100802044634. [DOI] [PubMed] [Google Scholar]
- 9.Dumbleton T, Buis AW, McFadyen A, McHugh BF, McKay G, Murray KD, Sexton S. Dynamic interface pressure distributions of two trans-tibial prosthetic socket concepts. J Rehabil Res Dev. 2009;46(3):405–416. [PubMed] [Google Scholar]


