

Abstract
Objective:
Alcohol expectancies (AEs) are positively associated with drinking behaviors, whereas the use of protective behavioural strategies (PBS) is negatively related to alcohol outcomes among young adults. PBS have been shown to weaken relationships between some alcohol risk factors and alcohol outcomes. This study aimed to examine longitudinally the moderating effect of PBS on the relationships between AEs and alcohol outcomes among young adults.
Method:
Participants (N = 188; 61.7% female) were U.S. young adults participating in a larger longitudinal study. Measures of PBS, AEs, alcohol use, and related consequences were used from the baseline and 12-month follow-up assessments.
Results:
Negative binomial hurdle models found that PBS (total score) significantly moderated the relationship between positive AEs and consequences, such that among high school seniors endorsing higher positive AEs, those using more PBS in high school reported fewer negative consequences 1 year later. PBS (Manner of Drinking) also moderated the relationship between negative AEs and alcohol use, revealing the use of PBS in high school as having a protective function against later drinking among participants with high positive AEs. Last, PBS (Serious Harm Reduction) significantly moderated the associations between positive AEs and alcohol use and between negative AEs and consequences, such that participants with higher AEs and higher PBS use in high school were at greatest risk for drinking and experiencing negative consequences later.
Conclusions:
Overall, these findings suggest that PBS use may be protective by weakening relationships between positive AEs and alcohol outcomes. Limitations and future directions are discussed.
A sizable proportion of young adults drink in a manner that places them at risk for experiencing alcohol-related harm (e.g., Arata et al., 2003; Hingson, 2012; Perkins, 2002). Research has therefore aimed to identify alcohol- related protective factors, such as protective behavioral strategies (PBS). PBS are strategies that individuals can use to reduce the negative consequences associated with their drinking (Martens et al., 2005). Although some researchers use a broad definition of PBS including strategies to avoid drinking (Sugarman & Carey, 2007), researchers commonly use a narrower definition referring to strategies used immediately before, during, and after drinking (Martens et al., 2007b; Pearson, 2013). Students commonly use PBS (Haines et al., 2006), yet degrees of use vary across drinking groups, with moderate drinkers being more likely to use PBS than light and heavy drinkers (i.e., curvilinear effect; Sugarman & Carey, 2007; Walters et al., 2007). Previous research in college samples has established a negative cross-sectional relationship between the use of PBS and alcohol outcomes (e.g., Araas & Adams, 2008; Benton et al., 2004; Borden et al., 2011; Martens et al., 2007a). Longitudinal studies, however, have yielded mixed evidence, with some strategies only being related to alcohol outcomes over time (e.g., Luebbe et al., 2009; Martens et al., 2011) or having differential relationships at the event or daily level (Lewis et al., 2012; Pearson et al., 2013).
Recent studies among college samples have examined the moderating role of PBS in relationships between alcohol risk factors and alcohol outcomes. For instance, Borden and colleagues (2011) showed that the relationship between heavy drinking and negative consequences is stronger among students using fewer PBS. Similar findings have been revealed in the relationships between poor self-regulation (D’Lima et al., 2012) and negative urgency (Weaver et al., 2012) with alcohol-related consequences. Thus, PBS use appears to be protective by weakening relationships between alcohol risk factors and alcohol outcomes.
Alcohol expectancies (AEs) are predictors of drinking behaviors (e.g., Borsari et al., 2007; Ham & Hope, 2003), referring to beliefs regarding positive or negative effects of drinking (Fromme et al., 1993; Goldman et al., 1999). Research among young adults has established that positive AEs are associated with greater alcohol use (e.g., Fromme & D’Amico, 2000; Fromme et al., 1993; Ham et al., 2005) as well as concurrent and future hazardous alcohol use (Zamboanga, 2006; Zamboanga et al., 2006). Findings regarding the predictive role of negative AEs in the same populations have been less consistent. Whereas some studies have found a negative association between negative AEs and drinking (e.g., Fromme & D’Amico, 2000; Nicolai et al., 2010), others have found negative AEs to be related to problematic drinking (Zamboanga et al., 2010) or unrelated to drinking and/or problematic drinking (Neighbors et al., 2007; Zamboanga et al., 2006).
Few studies have examined the relationship between AEs and PBS. One study documented that college students who were the victim of unwanted sexual experiences reported greater positive AEs and alcohol outcomes and less PBS use than students reporting no unwanted sexual experiences (Palmer et al., 2010). Another study showed that PBS mediated the association between positive AEs and alcohol outcomes among women (Madson et al., 2013). Yet, as far as we are aware, the moderating role of PBS on the relationship between AEs and alcohol outcomes has not been tested.
This study aimed to examine longitudinally the moderating effect of PBS on the relationship between AEs and drinking behaviors among young adults. Based on previous research, we expected that PBS would moderate the relationship between positive AEs and alcohol outcomes, such that among participants endorsing positive AEs, those using more PBS would report fewer alcohol outcomes than participants using fewer PBS. Given the inconsistencies found in the literature regarding negative AEs, we were uncertain as to whether the use of PBS would moderate the relationship between negative AEs and alcohol outcomes.
Method
Participants
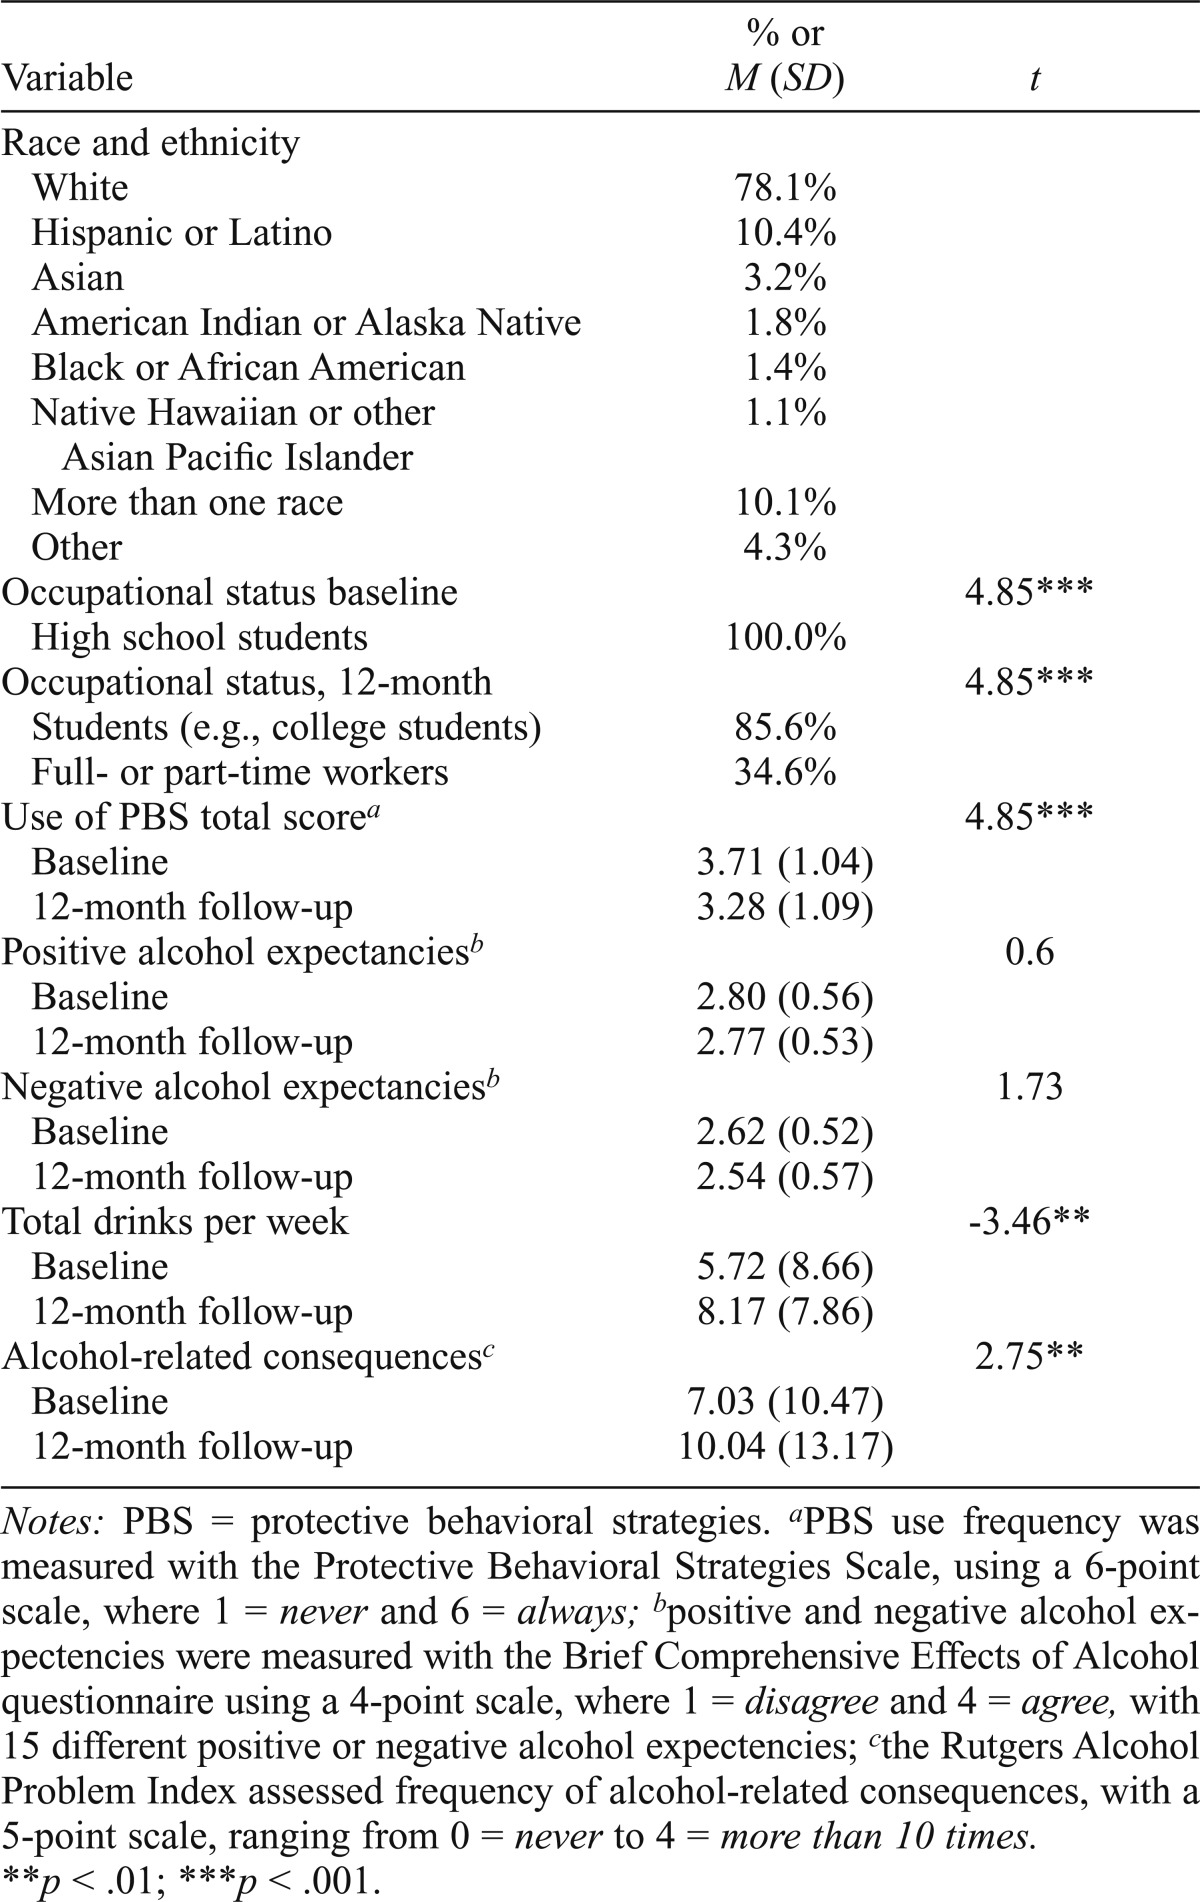
Participants were U.S. young adults who completed baseline and 12-month follow-up assessments as parts of a larger study. Participants were included in this study if they reported drinking at least once in the past month and were not randomized to the intervention in the parent study (including a PBS component). The final sample at baseline included 282 participants (59.2% female) with a mean age of 17.6 years (SD = 0.51) (see Table 1 for sample characteristics). One hundred eighty-eight participants completed a 12-month follow-up assessment (i.e., 66.7% of the baseline sample). Additional tests comparing completers with noncompleters on key variables found noncompleters to be significantly older at baseline (p < .05).
Table 1.
Sample characteristics (N = 282)
| Variable | % or M (SD) | t |
| Race and ethnicity | ||
| White | 78.1% | |
| Hispanic or Latino | 10.4% | |
| Asian | 3.2% | |
| American Indian or Alaska Native | 1.8% | |
| Black or African American | 1.4% | |
| Native Hawaiian or other Asian Pacific Islander | 1.1% | |
| More than one race | 10.1% | |
| Other | 4.3% | |
| Occupational status baseline | 4.85*** | |
| High school students | 100.0% | |
| Occupational status, 12-month | 4.85*** | |
| Students (e.g., college students) | 85.6% | |
| Full- or part-time workers | 34.6% | |
| Use of PBS total scorea | 4.85*** | |
| Baseline | 3.71 (1.04) | |
| 12-month follow-up | 3.28 (1.09) | |
| Positive alcohol expectanciesb | 0.6 | |
| Baseline | 2.80 (0.56) | |
| 12-month follow-up | 2.77 (0.53) | |
| Negative alcohol expectanciesb | 1.73 | |
| Baseline | 2.62 (0.52) | |
| 12-month follow-up | 2.54 (0.57) | |
| Total drinks per week | -3.46** | |
| Baseline | 5.72 (8.66) | |
| 12-month follow-up | 8.17 (7.86) | |
| Alcohol-related consequencesc | 2.75** | |
| Baseline | 7.03 (10.47) | |
| 12-month follow-up | 10.04 (13.17) |
Notes: PBS = protective behavioral strategies.
PBS use frequency was measured with the Protective Behavioral Strategies Scale, using a 6-point scale, where 1 = never and 6 = always;
positive and negative alcohol expectencies were measured with the Brief Comprehensive Effects of Alcohol questionnaire using a 4-point scale, where 1 = disagree and 4 = agree, with 15 different positive or negative alcohol expectencies
the Rutgers Alcohol Problem Index assessed frequency of alcohol-related consequences, with a 5-point scale, ranging from 0 = never to 4 = more than 10 times.
**p < .01;
p < .001.
Recruitment, assessment procedure, and ethics
High school seniors were recruited during classroom visits. Interested students who were 17 or 18 years of age (and had parental consent if they were 17) were invited to complete a web-based baseline survey. Participants who completed baseline were invited to complete a web-based 12-month follow-up assessment. Participants were paid $20 for completion of each survey and were entered into a prize drawing for a laptop and iPods. All procedures were approved by the university institutional review board.
Measures
Protective Behavioral Strategies Scale.
Consistent with most PBS research, we used the narrow definition of PBS (i.e., strategies used when drinking; Pearson, 2013). PBS use was measured with the Protective Behavioral Strategies Scale (PBSS; Martens et al., 2005), which assesses strategies used to be safer when drinking in the past 3 months on a scale ranging from 1 (never) to 6 (always) [i.e., total (α = .89), Limiting/Stopping (LS; seven items; α = .85), Manner of Drinking (MoD; five items; α = .7), and Serious Harm Reduction (SHR; three items; α = .64)]. Mean inter-item correlations ranged from .3 to .4 for the three subscales. Even though PBSS reliability and validity have been mostly established in college samples (Martens et al., 2005, 2007b), one study has used this measure among younger participants (Grazioli et al., 2015). Scores at baseline served as moderators.
Alcohol expectancies.
Positive and negative AEs were assessed at baseline with the Brief Comprehensive Effects of Alcohol questionnaire (B-CEOA; Ham et al., 2005). Participants indicated how much they would expect positive or negative effects to occur if they were under the influence of alcohol, on a scale ranging from 1 (disagree) to 4 (agree) (i.e., positive subscale [eight items; α = .73; mean inter-item correlation = .3], negative subscale [seven items; α = .66; mean inter-item correlation = .2]).
Drinking behaviors.
Alcohol use was measured with the Daily Drinking Questionnaire (Collins et al., 1985). Participants estimated typical drinking on each day of the week over the past 3 months, which was used to calculate the average total number of drinks per week. Alcohol-related consequences over the past year were assessed with the Rutgers Alcohol Problem Index (RAPI; White and Labouvie, 1989) (α = .95). Participants indicated the frequency of 26 problems on a scale ranging from 0 (never) to 4 (more than 10 times). Three items were added to assess drinking and driving. Drinking behaviors at the 12-month follow-up served as dependent variables.
Data analysis plan
The analyses were conducted using SPSS version 19 (IBM Corp., Armonk, NY) and R 3.1.0 (http://cran.rproject.org/bin/windows/base). The alcohol outcomes were positively skewed and overdispersed with a large number of zeros. We thus used a count regression model. A Vuong test indicated that a hurdle negative binomial had the best fit. The hurdle model is appropriate for handling zero-inflated and overdispersed outcomes because it fit all zeros in a logistic regression submodel and the nonzero counts in a truncated count regression submodel, allowing simultaneous examination of the effects of the covariates on “any outcomes” (i.e., zero vs. nonzero; logistic regression submodel) and on the number of outcomes among participants reporting at least one outcome (i.e., nonzero outcomes; count regression submodel) (Atkins et al., 2013).
Two models were tested for each outcome (i.e., one with PBS total score, a second with the subscales). All the variables were included from the beginning. Moderation analyses were used to test for interactions between AEs and PBS in predicting alcohol outcomes (Aiken & West, 1991). We controlled for school (participants were recruited from several high schools) by using the robust cluster-adjusted standard errors. We also controlled for gender and age in each model and for drinks per week (at baseline) in the models with consequences as the outcome. Continuous covariates were mean-centered. Significant interactions were followed with an examination of the slopes to determine the direction and degree of the interaction.
Results
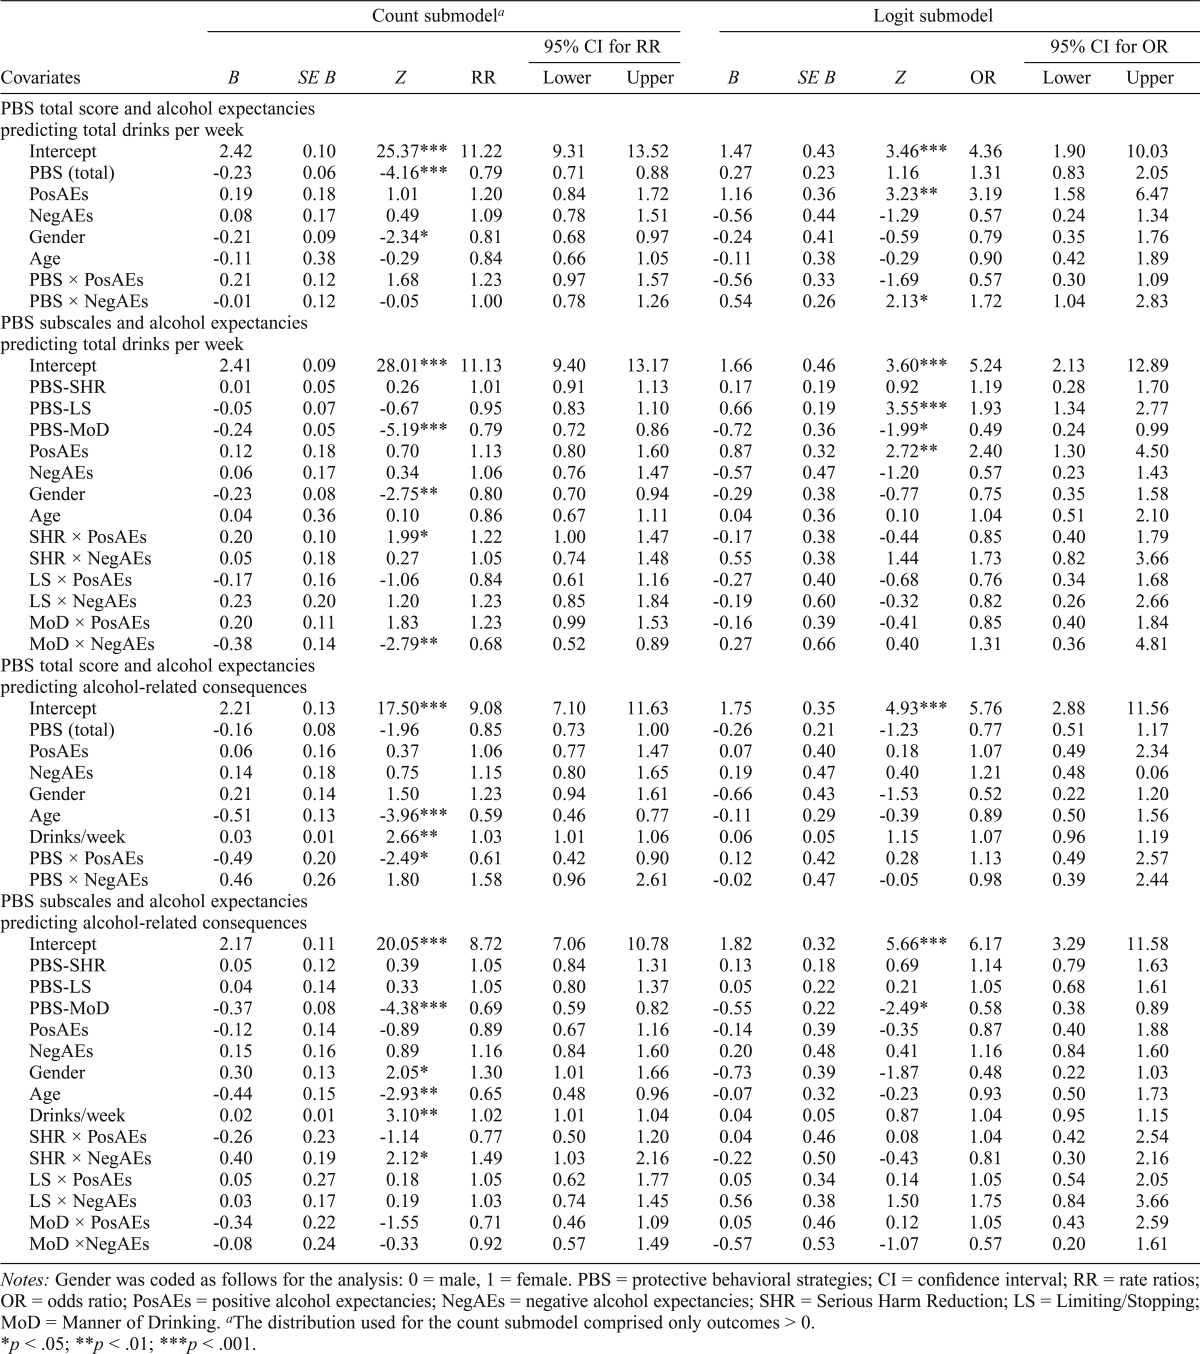
Table 2 presents results from the hurdle models. The magnitude of the associations between the covariates and the outcomes was examined with odds ratios [describing the increase (>1) or decrease (<1) in the odds of reporting ≥1 outcome vs. no outcome] in the logistic submodel and rate ratios [describing the percentage increase (>1) or decrease (<1) in outcomes for each unit increase in the covariate] in the count regression submodel (Atkins & Gallop, 2007).
Table 2.
Total drinks per week and alcohol-related consequences at 12-month follow-up as a function of use of PBS (Total Score, Serious Harm Reduction, Limiting/Stopping, and Manner of Drinking subscales) and positive and negative alcohol expectancies
| Covariates | Count submodela |
Logit submodel |
||||||||||
| 95% CI for RR |
95% CI for OR |
|||||||||||
| B | SE B | Z | RR | Lower | Upper | B | SE B | Z | OR | Lower | Upper | |
| PBS total score and alcohol expectancies predicting total drinks per week | ||||||||||||
| Intercept | 2.42 | 0.10 | 25.37*** | 11.22 | 9.31 | 13.52 | 1.47 | 0.43 | 3.46*** | 4.36 | 1.90 | 10.03 |
| PBS (total) | -0.23 | 0.06 | -4.16*** | 0.79 | 0.71 | 0.88 | 0.27 | 0.23 | 1.16 | 1.31 | 0.83 | 2.05 |
| PosAEs | 0.19 | 0.18 | 1.01 | 1.20 | 0.84 | 1.72 | 1.16 | 0.36 | 3.23** | 3.19 | 1.58 | 6.47 |
| NegAEs | 0.08 | 0.17 | 0.49 | 1.09 | 0.78 | 1.51 | -0.56 | 0.44 | -1.29 | 0.57 | 0.24 | 1.34 |
| Gender | -0.21 | 0.09 | -2.34* | 0.81 | 0.68 | 0.97 | -0.24 | 0.41 | -0.59 | 0.79 | 0.35 | 1.76 |
| Age | -0.11 | 0.38 | -0.29 | 0.84 | 0.66 | 1.05 | -0.11 | 0.38 | -0.29 | 0.90 | 0.42 | 1.89 |
| PBS × PosAEs | 0.21 | 0.12 | 1.68 | 1.23 | 0.97 | 1.57 | -0.56 | 0.33 | -1.69 | 0.57 | 0.30 | 1.09 |
| PBS × NegAEs | -0.01 | 0.12 | -0.05 | 1.00 | 0.78 | 1.26 | 0.54 | 0.26 | 2.13* | 1.72 | 1.04 | 2.83 |
| PBS subscales and alcohol expectancies predicting total drinks per week | ||||||||||||
| Intercept | 2.41 | 0.09 | 28.01*** | 11.13 | 9.40 | 13.17 | 1.66 | 0.46 | 3.60*** | 5.24 | 2.13 | 12.89 |
| PBS-SHR | 0.01 | 0.05 | 0.26 | 1.01 | 0.91 | 1.13 | 0.17 | 0.19 | 0.92 | 1.19 | 0.28 | 1.70 |
| PBS-LS | -0.05 | 0.07 | -0.67 | 0.95 | 0.83 | 1.10 | 0.66 | 0.19 | 3.55*** | 1.93 | 1.34 | 2.77 |
| PBS-MoD | -0.24 | 0.05 | -5.19*** | 0.79 | 0.72 | 0.86 | -0.72 | 0.36 | -1.99* | 0.49 | 0.24 | 0.99 |
| PosAEs | 0.12 | 0.18 | 0.70 | 1.13 | 0.80 | 1.60 | 0.87 | 0.32 | 2.72** | 2.40 | 1.30 | 4.50 |
| NegAEs | 0.06 | 0.17 | 0.34 | 1.06 | 0.76 | 1.47 | -0.57 | 0.47 | -1.20 | 0.57 | 0.23 | 1.43 |
| Gender | -0.23 | 0.08 | -2.75** | 0.80 | 0.70 | 0.94 | -0.29 | 0.38 | -0.77 | 0.75 | 0.35 | 1.58 |
| Age | 0.04 | 0.36 | 0.10 | 0.86 | 0.67 | 1.11 | 0.04 | 0.36 | 0.10 | 1.04 | 0.51 | 2.10 |
| SHR × PosAEs | 0.20 | 0.10 | 1.99* | 1.22 | 1.00 | 1.47 | -0.17 | 0.38 | -0.44 | 0.85 | 0.40 | 1.79 |
| SHR × NegAEs | 0.05 | 0.18 | 0.27 | 1.05 | 0.74 | 1.48 | 0.55 | 0.38 | 1.44 | 1.73 | 0.82 | 3.66 |
| LS × PosAEs | -0.17 | 0.16 | -1.06 | 0.84 | 0.61 | 1.16 | -0.27 | 0.40 | -0.68 | 0.76 | 0.34 | 1.68 |
| LS × NegAEs | 0.23 | 0.20 | 1.20 | 1.23 | 0.85 | 1.84 | -0.19 | 0.60 | -0.32 | 0.82 | 0.26 | 2.66 |
| MoD × PosAEs | 0.20 | 0.11 | 1.83 | 1.23 | 0.99 | 1.53 | -0.16 | 0.39 | -0.41 | 0.85 | 0.40 | 1.84 |
| MoD × NegAEs | -0.38 | 0.14 | -2.79** | 0.68 | 0.52 | 0.89 | 0.27 | 0.66 | 0.40 | 1.31 | 0.36 | 4.81 |
| PBS total score and alcohol expectancies predicting alcohol-related consequences | ||||||||||||
| Intercept | 2.21 | 0.13 | 17.50*** | 9.08 | 7.10 | 11.63 | 1.75 | 0.35 | 4.93*** | 5.76 | 2.88 | 11.56 |
| PBS (total) | -0.16 | 0.08 | -1.96 | 0.85 | 0.73 | 1.00 | -0.26 | 0.21 | -1.23 | 0.77 | 0.51 | 1.17 |
| PosAEs | 0.06 | 0.16 | 0.37 | 1.06 | 0.77 | 1.47 | 0.07 | 0.40 | 0.18 | 1.07 | 0.49 | 2.34 |
| NegAEs | 0.14 | 0.18 | 0.75 | 1.15 | 0.80 | 1.65 | 0.19 | 0.47 | 0.40 | 1.21 | 0.48 | 0.06 |
| Gender | 0.21 | 0.14 | 1.50 | 1.23 | 0.94 | 1.61 | -0.66 | 0.43 | -1.53 | 0.52 | 0.22 | 1.20 |
| Age | -0.51 | 0.13 | -3.96*** | 0.59 | 0.46 | 0.77 | -0.11 | 0.29 | -0.39 | 0.89 | 0.50 | 1.56 |
| Drinks/week | 0.03 | 0.01 | 2.66** | 1.03 | 1.01 | 1.06 | 0.06 | 0.05 | 1.15 | 1.07 | 0.96 | 1.19 |
| PBS × PosAEs | -0.49 | 0.20 | -2.49* | 0.61 | 0.42 | 0.90 | 0.12 | 0.42 | 0.28 | 1.13 | 0.49 | 2.57 |
| PBS × NegAEs | 0.46 | 0.26 | 1.80 | 1.58 | 0.96 | 2.61 | -0.02 | 0.47 | -0.05 | 0.98 | 0.39 | 2.44 |
| PBS subscales and alcohol expectancies predicting alcohol-related consequences | ||||||||||||
| Intercept | 2.17 | 0.11 | 20.05*** | 8.72 | 7.06 | 10.78 | 1.82 | 0.32 | 5.66*** | 6.17 | 3.29 | 11.58 |
| PBS-SHR | 0.05 | 0.12 | 0.39 | 1.05 | 0.84 | 1.31 | 0.13 | 0.18 | 0.69 | 1.14 | 0.79 | 1.63 |
| PBS-LS | 0.04 | 0.14 | 0.33 | 1.05 | 0.80 | 1.37 | 0.05 | 0.22 | 0.21 | 1.05 | 0.68 | 1.61 |
| PBS-MoD | -0.37 | 0.08 | -4.38*** | 0.69 | 0.59 | 0.82 | -0.55 | 0.22 | -2.49* | 0.58 | 0.38 | 0.89 |
| PosAEs | -0.12 | 0.14 | -0.89 | 0.89 | 0.67 | 1.16 | -0.14 | 0.39 | -0.35 | 0.87 | 0.40 | 1.88 |
| NegAEs | 0.15 | 0.16 | 0.89 | 1.16 | 0.84 | 1.60 | 0.20 | 0.48 | 0.41 | 1.16 | 0.84 | 1.60 |
| Gender | 0.30 | 0.13 | 2.05* | 1.30 | 1.01 | 1.66 | -0.73 | 0.39 | -1.87 | 0.48 | 0.22 | 1.03 |
| Age | -0.44 | 0.15 | -2.93** | 0.65 | 0.48 | 0.96 | -0.07 | 0.32 | -0.23 | 0.93 | 0.50 | 1.73 |
| Drinks/week | 0.02 | 0.01 | 3.10** | 1.02 | 1.01 | 1.04 | 0.04 | 0.05 | 0.87 | 1.04 | 0.95 | 1.15 |
| SHR × PosAEs | -0.26 | 0.23 | -1.14 | 0.77 | 0.50 | 1.20 | 0.04 | 0.46 | 0.08 | 1.04 | 0.42 | 2.54 |
| SHR × NegAEs | 0.40 | 0.19 | 2.12* | 1.49 | 1.03 | 2.16 | -0.22 | 0.50 | -0.43 | 0.81 | 0.30 | 2.16 |
| LS × PosAEs | 0.05 | 0.27 | 0.18 | 1.05 | 0.62 | 1.77 | 0.05 | 0.34 | 0.14 | 1.05 | 0.54 | 2.05 |
| LS × NegAEs | 0.03 | 0.17 | 0.19 | 1.03 | 0.74 | 1.45 | 0.56 | 0.38 | 1.50 | 1.75 | 0.84 | 3.66 |
| MoD × PosAEs | -0.34 | 0.22 | -1.55 | 0.71 | 0.46 | 1.09 | 0.05 | 0.46 | 0.12 | 1.05 | 0.43 | 2.59 |
| MoD ×NegAEs | -0.08 | 0.24 | -0.33 | 0.92 | 0.57 | 1.49 | -0.57 | 0.53 | -1.07 | 0.57 | 0.20 | 1.61 |
Notes: Gender was coded as follows for the analysis: 0 = male, 1 = female. PBS = protective behavioral strategies; CI = confidence interval; RR = rate ratios; OR = odds ratio; PosAEs = positive alcohol expectancies; NegAEs = negative alcohol expectancies; SHR = Serious Harm Reduction; LS = Limiting/Stopping; MoD = Manner of Drinking.
The distribution used for the count submodel comprised only outcomes > 0.
p < .05;
p < .01;
p < .001.
Total drinks per week
Findings from the logit submodels indicated that positive AEs and PBS-LS were associated with reporting one or more drinks versus zero drinks per week, whereas PBS-MoD was associated with reporting zero drinks versus one or more drinks per week. Lastly, results indicated a significant interaction between PBS (total score) and negative AEs.
The count submodels revealed significant associations between gender (rate ratios [RRs] = 0.80–0.81) and PBS (total score, MoD; RRs = 0.79) and drinks per week, such that being male was associated with 20% more drinks, whereas each unit increase in PBS was associated with about 21% fewer drinks. Next, results indicated significant interactions between PBS-SHR and positive AEs and between PBS-MoD and negative AEs. As shown in Figure 1, among participants with lower positive AEs, those using more PBS-SHR reported fewer drinks than those using fewer PBS-SHR, whereas among participants with higher positive AEs, those using more PBS-SHR reported more drinks than those using fewer PBS-SHR. The second interaction indicated that among participants endorsing high negative AEs, those using more PBS-MoD reported fewer drinks than did those using fewer PBS-MoD.
Figure 1.

Relationships between positive and negative alcohol expectancies (AEs) endorsed at baseline and alcohol outcomes at 12-month follow-up among young adults with a low, medium, or high use of protective behavioral strategies (PBS).
Alcohol-related consequences
The logit submodels indicated that PBS-MoD was associated with reporting zero consequences versus one or more consequences. In the count submodels, the associations between age (RR = 0.59–0.65), gender (RR = 1.30), and drinks per week (RR = 1.01) with negative consequences were significant, such that being older and a male was associated with 40% fewer and 30% more consequences, respectively, whereas each increase in drinks was associated with about 1% more consequences. The association between PBS-MoD and consequences was significant (RR = 0.69), indicating that each increase in PBS-MoD was associated with about 31% fewer consequences. There was a significant moderating effect of PBS total score in the relationship between positive AEs and consequences, such that among participants endorsing higher positive AEs, those using more PBS reported fewer consequences than those using fewer PBS. Similarly, the interaction between PBS-SHR and negative AEs was significant, indicating that among participants with lower negative AEs, participants using fewer PBS-SHR reported more consequences than those using more PBS-SHR, yet among participants with higher negative AEs, those using more PBS-SHR were the most at risk regarding consequences (Figure 1).
Discussion
This study examined the moderating effects of PBS in the relationships between AEs and alcohol outcomes in a longitudinal sample of young adults. Findings revealed that among participants endorsing high positive AEs, those using more PBS experienced fewer problems than those using fewer PBS. Similarly, among participants with high negative AEs, those using more PBS (MoD) reported drinking less than those using fewer PBS. These results are consistent with research that has shown PBS to be protective by weakening relationships between alcohol risk factors and alcohol outcomes (e.g., Benton et al., 2004; Borden et al., 2011; D’Lima et al., 2012). PBS may therefore serve as a buffer against the negative consequences associated with endorsing high positive AEs and alcohol consumption related to endorsing high negative AEs.
Next, we found that whereas PBS-SHR use was protective against drinking among participants with low positive AEs, its use was associated with more drinking among those endorsing high positive AEs. Similarly, we found that among participants with low negative AEs, those using more PBSSHR experienced fewer consequences than those using fewer PBS, yet among participants with high negative AEs, those using more PBS-SHR were at greater risk for consequences. These results are consistent with longitudinal studies that have found positive relationships between the use of PBS and alcohol outcomes (Lewis et al., 2012; Pearson et al., 2013). It may be that students using more PBS while drinking are actually those who drink more and who use PBS while drinking in high-risk settings (Pearson, 2013; Prince et al., 2013). It is also possible that participants with high negative AEs who use more PBS are experiencing early symptoms of alcohol use disorders. In fact, a recent study identified young adults with high negative and positive AEs as a particularly problematic risk profile (Leeman et al., 2012).
To the best of our knowledge, this is the first study examining the moderating role of PBS in the relationships between AEs and alcohol outcomes, and these results would need to be replicated to demonstrate generalizability. If replicated, these findings suggest that increasing PBS use may weaken the associations between positive AEs and negative consequences and between negative AEs and alcohol use. Next, our results that PBS did not have a protective function against alcohol use among participants endorsing high positive AEs suggest that strategies aiming to reduce the risks instead of reducing the amount of drinking may be a better fit for individuals endorsing high positive AEs.
This study has limitations that deserve mention. First, even though the PBSS has been widely used among young adults, only one study has used this measure among younger participants (Grazioli et al., 2015). Further, consistent with most PBS research, we used the narrow definition of PBS and did not assess the use of strategies to avoid drinking (Sugarman & Carey, 2007). Future research exploring the use of strategies to avoid drinking and further validating the PBSS on younger populations is needed. Second, our data relied on responses to self-report questionnaires, and their validity may be a concern, although participants were assured of confidentiality. Next, Cronbach’s α for the negative AEs subscale was low, suggesting a low internal consistency possibly affecting the results. That being said, the inter-item correlation value corresponded to standards in the literature (Briggs & Cheek, 1986). Finally, whereas the longitudinal nature of our study is a contribution to the literature, our retention rate after 1 year was around 67%. Therefore, future studies are needed to replicate and extend findings from this study.
Despite these limitations, we believe that this study makes an interesting contribution to the literature on PBS by providing preliminary findings suggesting that PBS may be protective by weakening the relationships between high positive AEs and alcohol-related consequences and between high negative AEs and alcohol use among young adults. If replicated by future research, these findings suggest that PBS-based interventions targeted to high school seniors endorsing high AEs may represent a promising way to reduce future alcohol-related harm in this population.
Footnotes
This research was supported by National Institute on Alcohol Abuse and Alcoholism Grant R01AA018276-03 (awarded to Mary E. Larimer) and Swiss National Science Foundation Grant PP1LAP3-148418 (awarded to Véronique S. Grazioli).
References
- Aiken L. S., West S. G. Multiple regression: Testing and interpreting interactions. Thousand Oaks, CA: Sage; 1991. [Google Scholar]
- Araas T. E., Adams T. B. Protective behavioral strategies and negative alcohol-related consequences in college students. Journal of Drug Education. 2008;38:211–224. doi: 10.2190/DE.38.3.b. [DOI] [PubMed] [Google Scholar]
- Arata C. M., Stafford J., Tims M. S. High school drinking and its consequences. Adolescence. 2003;38:567–579. [PubMed] [Google Scholar]
- Atkins D. C., Baldwin S. A., Zheng C., Gallop R. J., Neighbors C. A tutorial on count regression and zero-altered count models for longitudinal substance use data. Psychology of Addictive Behaviors. 2013;27:166–177. doi: 10.1037/a0029508. [DOI] [PMC free article] [PubMed] [Google Scholar]
- Atkins D. C., Gallop R. J. Rethinking how family researchers model infrequent outcomes: A tutorial on count regression and zeroinflated models. Journal of Family Psychology. 2007;21:726–735. doi: 10.1037/0893-3200.21.4.726. [DOI] [PubMed] [Google Scholar]
- Benton S. L., Schmidt J. L., Newton F. B., Shin K., Benton S. A., Newton D. W. College student protective strategies and drinking consequences. Journal of Studies on Alcohol. 2004;65:115–121. doi: 10.15288/jsa.2004.65.115. [DOI] [PubMed] [Google Scholar]
- Borden L. A., Martens M. P., McBride M. A., Sheline K. T., Bloch K. K., Dude K. The role of college students’ use of protective behavioral strategies in the relation between binge drinking and alcoholrelated problems. Psychology of Addictive Behaviors. 2011;25:346–351. doi: 10.1037/a0022678. [DOI] [PubMed] [Google Scholar]
- Borsari B., Murphy J. G., Barnett N. P. Predictors of alcohol use during the first year of college: Implications for prevention. Addictive Behaviors. 2007;32:2062–2086. doi: 10.1016/j.addbeh.2007.01.017. [DOI] [PMC free article] [PubMed] [Google Scholar]
- Briggs S. R., Cheek J. M. The role of factor analysis in the development and evaluation of personality scales. Journal of Personality. 1986;54:106–148. [Google Scholar]
- Collins R. L., Parks G. A., Marlatt G. A. Social determinants of alcohol consumption: The effects of social interaction and model status on the self-administration of alcohol. Journal of Consulting and Clinical Psychology. 1985;53:189–200. doi: 10.1037//0022-006x.53.2.189. [DOI] [PubMed] [Google Scholar]
- D’Lima G. M., Pearson M. R., Kelley M. L. Protective behavioral strategies as a mediator and moderator of the relationship between self-regulation and alcohol-related consequences in first-year college students. Psychology of Addictive Behaviors. 2012;26:330–337. doi: 10.1037/a0026942. [DOI] [PubMed] [Google Scholar]
- Fromme K., D’Amico E. J. Measuring adolescent alcohol outcome expectancies. Psychology of Addictive Behaviors. 2000;14:206–212. doi: 10.1037//0893-164x.14.2.206. [DOI] [PubMed] [Google Scholar]
- Fromme K., Stroot E. A., Kaplan D. Comprehensive effects of alcohol: Development and psychometric assessment of a new expectancy questionnaire. Psychological Assessment. 1993;5:19–26. [Google Scholar]
- Goldman M. S., Del Boca F. K., Darkes J.1999Alcohol expectancy theory: The application of cognitive neurosciences Blane H., Leonard K.Psychological theories of drinking and alcoholism (2nd ed.203–246.New York, NY: Guildford Press [Google Scholar]
- Grazioli V. S., Dillworth T. M., Witkiewitz K., Andersson C., Kilmer J. R., Pace T., et al. Protective behavioral strategies and future drinking behaviors: Effect of drinking intentions. Psychology of Addictive Behaviors. 2015 doi: 10.1037/adb0000041. [DOI] [PubMed] [Google Scholar]
- Haines M. P., Barker G., Rice R. M. The personal protective behaviors of college student drinkers: Evidence of indigenous protective norms. Journal of American College Health. 2006;55:69–76. doi: 10.3200/JACH.55.2.69-76. [DOI] [PubMed] [Google Scholar]
- Ham L. S., Hope D. A. College students and problematic drinking: A review of the literature. Clinical Psychology Review. 2003;23:719–759. doi: 10.1016/s0272-7358(03)00071-0. [DOI] [PubMed] [Google Scholar]
- Ham L. S., Stewart S. H., Norton P. J., Hope D. A. Psychometric assessment of the Comprehensive Effects of Alcohol questionnaire: Comparing a brief version to the original full scale. Journal of Psychopathology and Behavioral Assessment. 2005;27:141–158. [Google Scholar]
- Hingson R. W., White A. M.2012Prevalence and consequences of college student alcohol use Correia C. J., Murphy J. G., Barnett N. P.College student alcohol abuse: A guide to assessment, intervention, and prevention (Wiley ed3–24.Hoboken, NJ: John Wiley & Sons [Google Scholar]
- Leeman R. F., Kulesza M., Stewart D. W., Copeland A. L. Cluster analysis of undergraduate drinkers based on alcohol expectancy scores. Journal of Studies on Alcohol and Drugs. 2012;73:238–249. doi: 10.15288/jsad.2012.73.238. [DOI] [PMC free article] [PubMed] [Google Scholar]
- Lewis M. A., Patrick M. E., Lee C. M., Kaysen D. L., Mittman A., Neighbors C. Use of protective behavioral strategies and their association to 21st birthday alcohol consumption and related negative consequences: A between- and within-person evaluation. Psychology of Addictive Behaviors. 2012;26:179–186. doi: 10.1037/a0023797. [DOI] [PMC free article] [PubMed] [Google Scholar]
- Luebbe A. M., Varvel S., Dude K. Reciprocal relations of protective behavioral strategies and risk-amplifying behaviors with alcohol-related consequences: Targets for intervention with female college students. Journal of Alcohol and Drug Education. 2009;53:7–32. [Google Scholar]
- Madson M. B., Moorer K. D., Zeigler-Hill V., Bonnell M. A., Villarosa M. Alcohol expectancies, protective behavioral strategies, and alcohol-related outcomes: A moderated mediation study. Drugs: Education, Prevention, & Policy. 2013;20:286–296. [Google Scholar]
- Martens M. P., Ferrier A. G., Sheehy M. J., Corbett K., Anderson D. A., Simmons A. Development of the Protective Behavioral Strategies Survey. Journal of Studies on Alcohol. 2005;66:698–705. doi: 10.15288/jsa.2005.66.698. [DOI] [PubMed] [Google Scholar]
- Martens M. P., Martin J. L., Littlefield A. K., Murphy J. G., Cimini M. D. Changes in protective behavioral strategies and alcohol use among college students. Drug and Alcohol Dependence. 2011;118:504–507. doi: 10.1016/j.drugalcdep.2011.04.020. [DOI] [PMC free article] [PubMed] [Google Scholar]
- Martens M. P., Neighbors C., Dams-O’Connor K., Lee C. M., Larimer M. E. The factor structure of a dichotomously scored Rutgers Alcohol Problem Index. Journal of Studies on Alcohol and Drugs. 2007a;68:597–606. doi: 10.15288/jsad.2007.68.597. [DOI] [PubMed] [Google Scholar]
- Martens M. P., Pederson E. R., LaBrie J. W., Ferrier A. G., Cimini M. D. Measuring alcohol-related protective behavioral strategies among college students: Further examination of the Protective Behavioral Strategies Scale. Psychology of Addictive Behaviors. 2007b;21:307–315. doi: 10.1037/0893-164X.21.3.307. [DOI] [PubMed] [Google Scholar]
- Neighbors C., Lee C. M., Lewis M. A., Fossos N., Larimer M. E. Are social norms the best predictor of outcomes among heavy-drinking college students? Journal of Studies on Alcohol and Drugs. 2007;68:556–565. doi: 10.15288/jsad.2007.68.556. [DOI] [PMC free article] [PubMed] [Google Scholar]
- Nicolai J., Demmel R., Moshagen M. The comprehensive alcohol expectancy questionnaire: Confirmatory factor analysis, scale refinement, and further validation. Journal of Personality Assessment. 2010;92:400–409. doi: 10.1080/00223891.2010.497396. [DOI] [PubMed] [Google Scholar]
- Palmer R. S., McMahon T. J., Rounsaville B. J., Ball S. A. Coercive sexual experiences, protective behavioral strategies, alcohol expectancies and consumption among male and female college students. Journal of Interpersonal Violence. 2010;25:1563–1578. doi: 10.1177/0886260509354581. [DOI] [PMC free article] [PubMed] [Google Scholar]
- Pearson M. R. Use of alcohol protective behavioral strategies among college students: A critical review. Clinical Psychology Review. 2013;33:1025–1040. doi: 10.1016/j.cpr.2013.08.006. [DOI] [PMC free article] [PubMed] [Google Scholar]
- Pearson M. R., D’Lima G. M., Kelley M. L. Daily use of protective behavioral strategies and alcohol-related outcomes among college students. Psychology of Addictive Behaviors. 2013;27:826–831. doi: 10.1037/a0032516. [DOI] [PMC free article] [PubMed] [Google Scholar]
- Perkins H. W. Social norms and the prevention of alcohol misuse in collegiate contexts. Journal of Studies on Alcohol, Supplement. 2002;14:164–172. doi: 10.15288/jsas.2002.s14.164. [DOI] [PubMed] [Google Scholar]
- Prince M. A., Carey K. B., Maisto S. A. Protective behavioral strategies for reducing alcohol involvement: A review of the methodological issues. Addictive Behaviors. 2013;38:2343–2351. doi: 10.1016/j.addbeh.2013.03.010. [DOI] [PubMed] [Google Scholar]
- Sugarman D. E., Carey K. B. The relationship between drinking control strategies and college student alcohol use. Psychology of Addictive Behaviors. 2007;21:338–345. doi: 10.1037/0893-164X.21.3.338. [DOI] [PMC free article] [PubMed] [Google Scholar]
- Walters S. T., Roudsari B. S., Vader A. M., Harris T. R. Correlates of protective behavior utilization among heavy-drinking college students. Addictive Behaviors. 2007;32:2633–2644. doi: 10.1016/j.addbeh.2007.06.022. [DOI] [PMC free article] [PubMed] [Google Scholar]
- Weaver C. C., Martens M. P., Smith A. E. Do protective behavioral strategies moderate the relationship between negative urgency and alcohol-related outcomes among intercollegiate athletes? Journal of Studies on Alcohol and Drugs. 2012;73:498–503. doi: 10.15288/jsad.2012.73.498. [DOI] [PMC free article] [PubMed] [Google Scholar]
- White H. R., Labouvie E. W. Towards the assessment of adolescent problem drinking. Journal of Studies on Alcohol. 1989;50:30–37. doi: 10.15288/jsa.1989.50.30. [DOI] [PubMed] [Google Scholar]
- Zamboanga B. L. From the eyes of the beholder: Alcohol expectancies and valuations as predictors of hazardous drinking behaviors among female college students. American Journal of Drug and Alcohol Abuse. 2006;32:599–605. doi: 10.1080/00952990600920573. [DOI] [PubMed] [Google Scholar]
- Zamboanga B. L., Horton N. J., Leitkowski L. K., Wang S. C. Do good things come to those who drink? A longitudinal investigation of drinking expectancies and hazardous alcohol use in female college athletes. Journal of Adolescent Health. 2006;39:229–236. doi: 10.1016/j.jadohealth.2005.11.019. [DOI] [PubMed] [Google Scholar]
- Zamboanga B. L., Schwartz S. J., Ham L. S., Borsari B., Van Tyne K. Alcohol expectancies, pregaming, drinking games, and hazardous alcohol use in a multiethnic sample of college students. Cognitive Therapy and Research. 2010;34:124–133. [Google Scholar]